Inspiration
Recently, we got exposed to entrepreneurship and came to know that in recent years there's a hit in the number of startups being founded especially during the pandemic periods, which is changing in very recent years and we understood that the lack of knowledge in fast-moving, high-performing, and cutting edge domains and the availability of the investors in each domain was the cause for the situation.
What it does
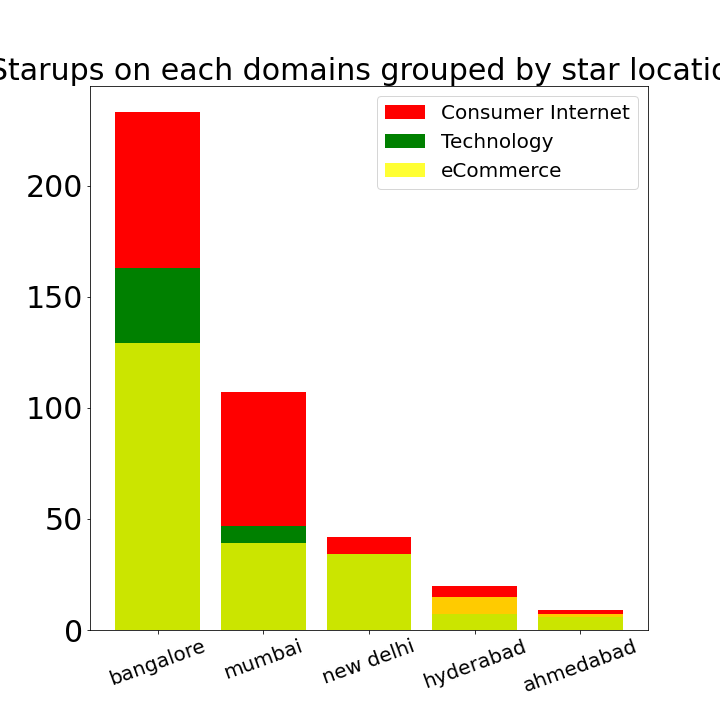
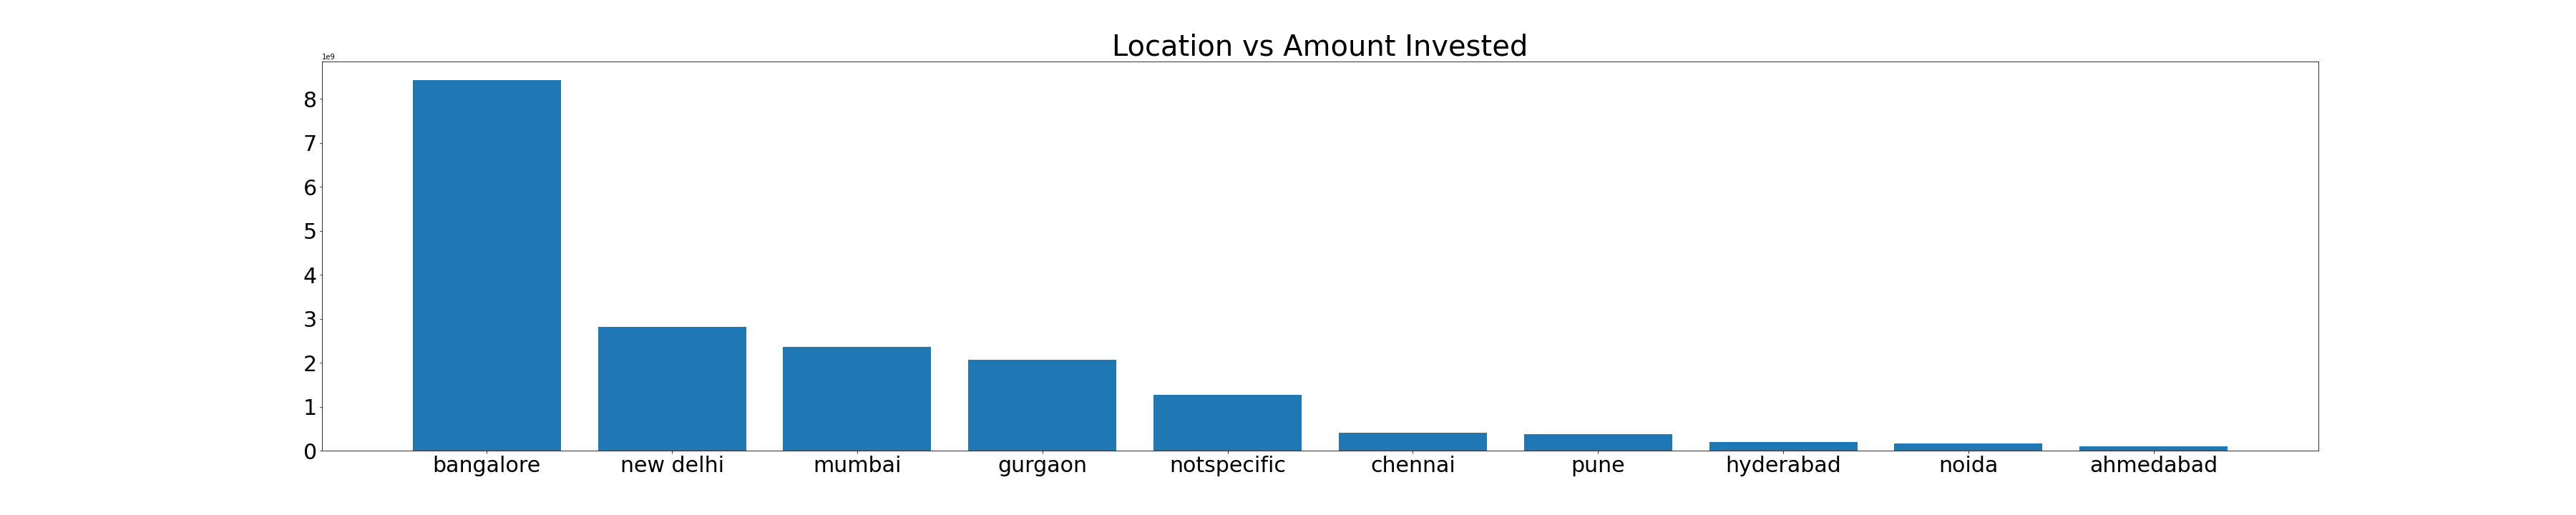
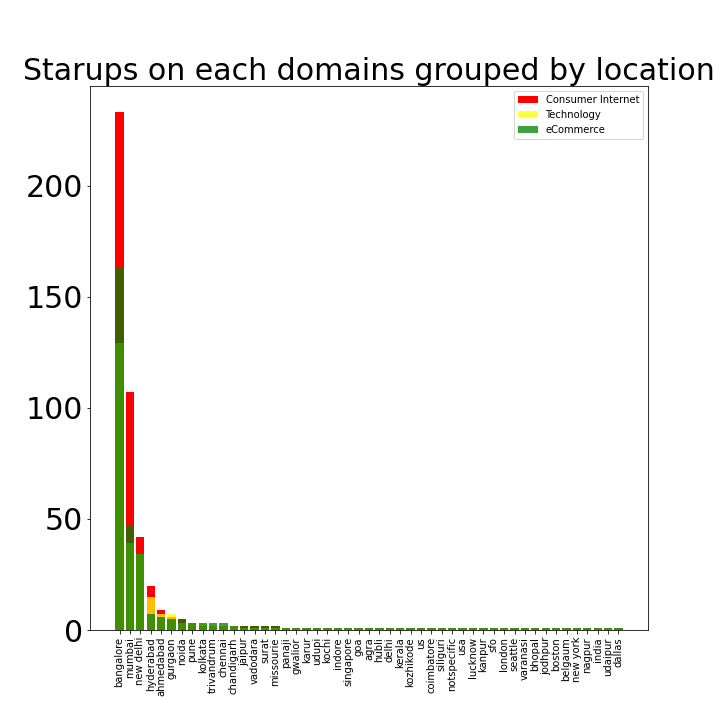
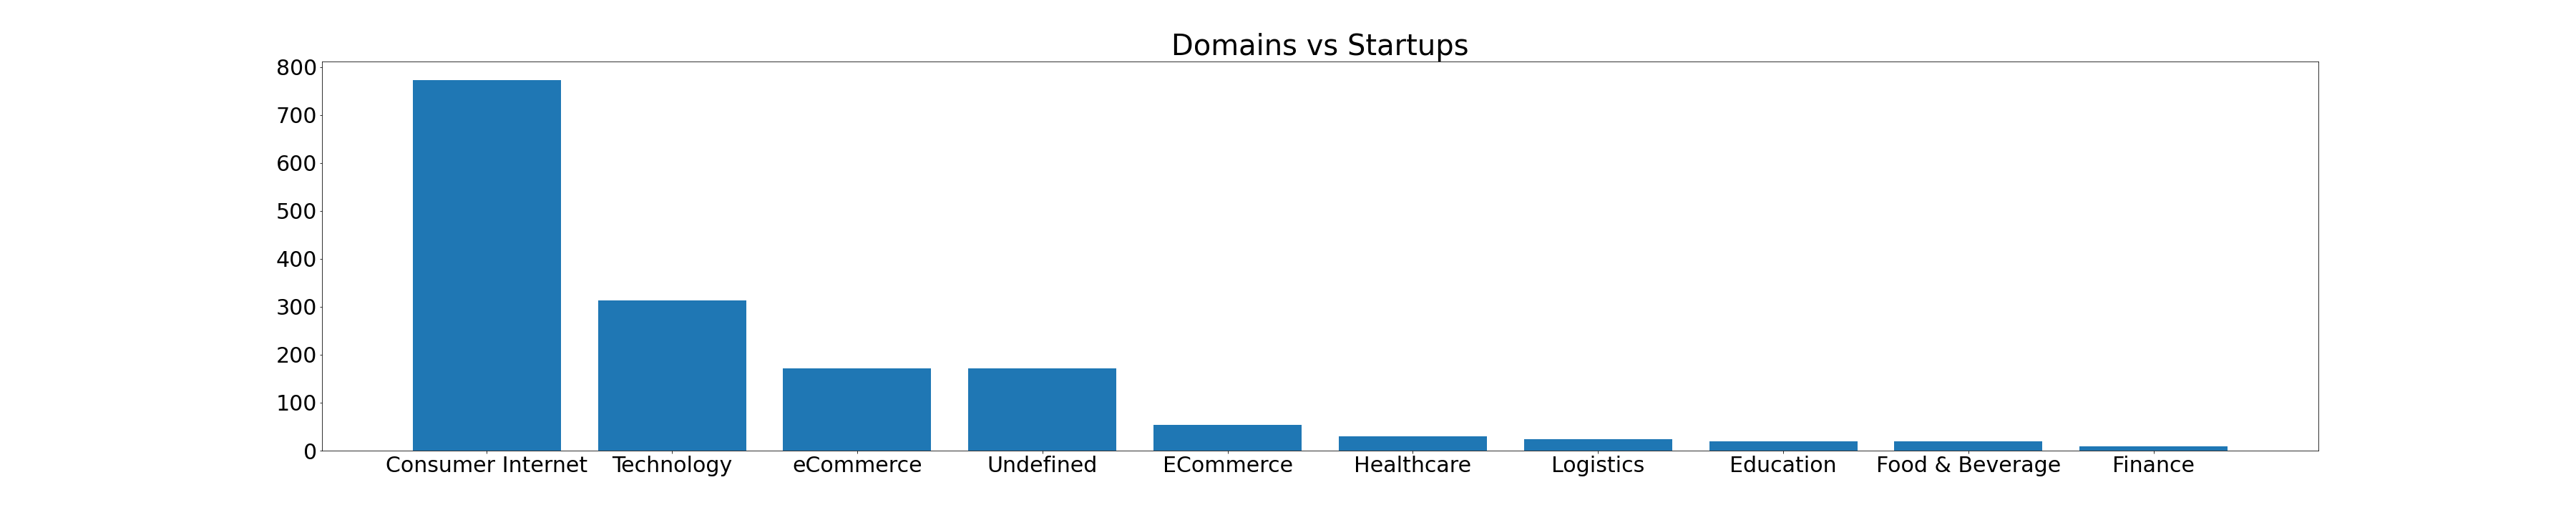
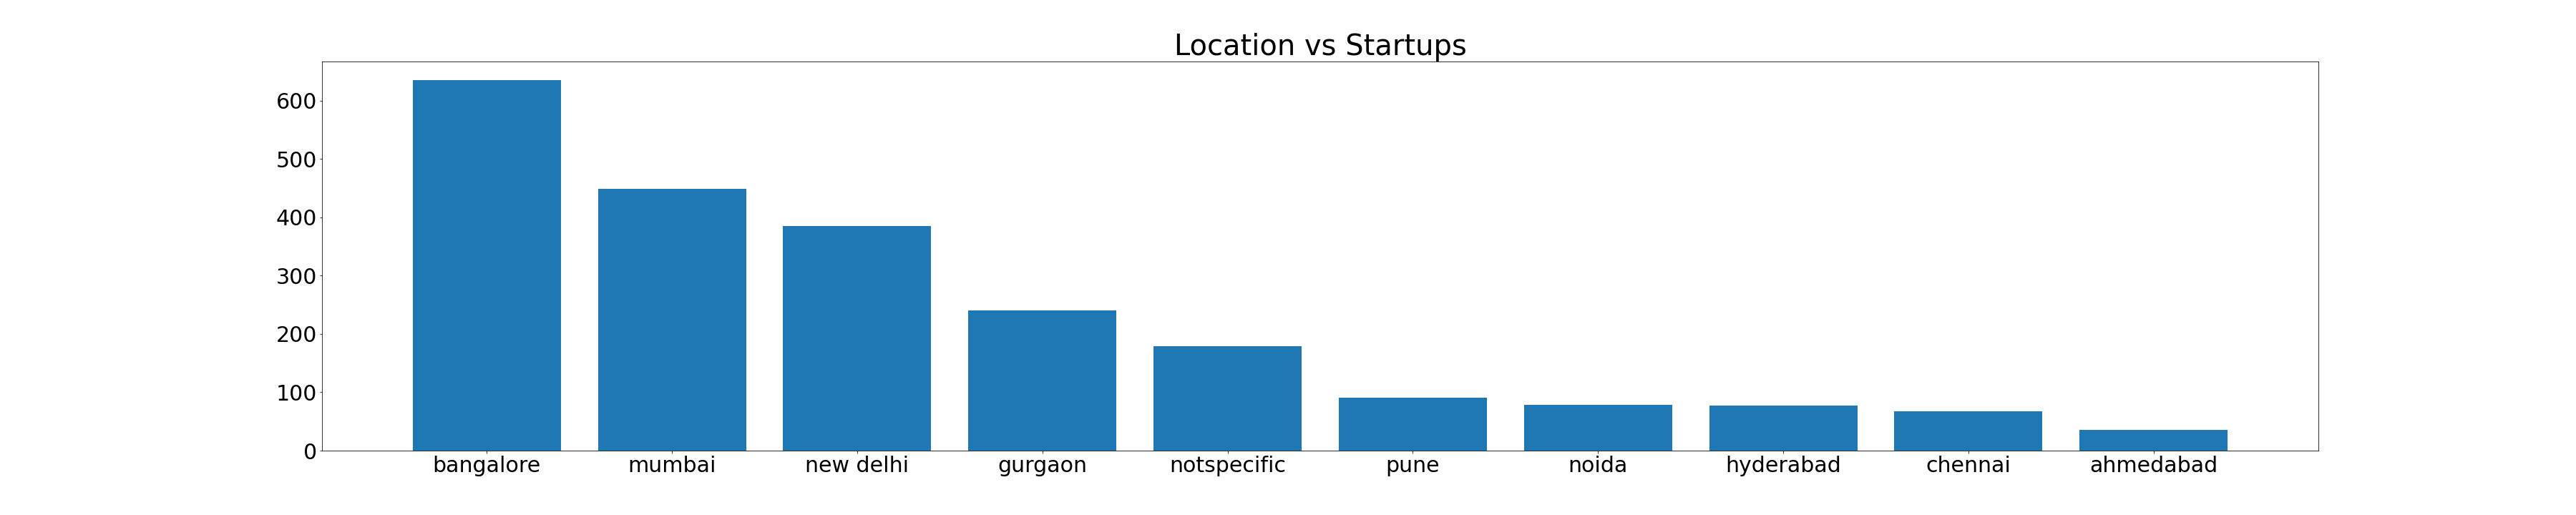
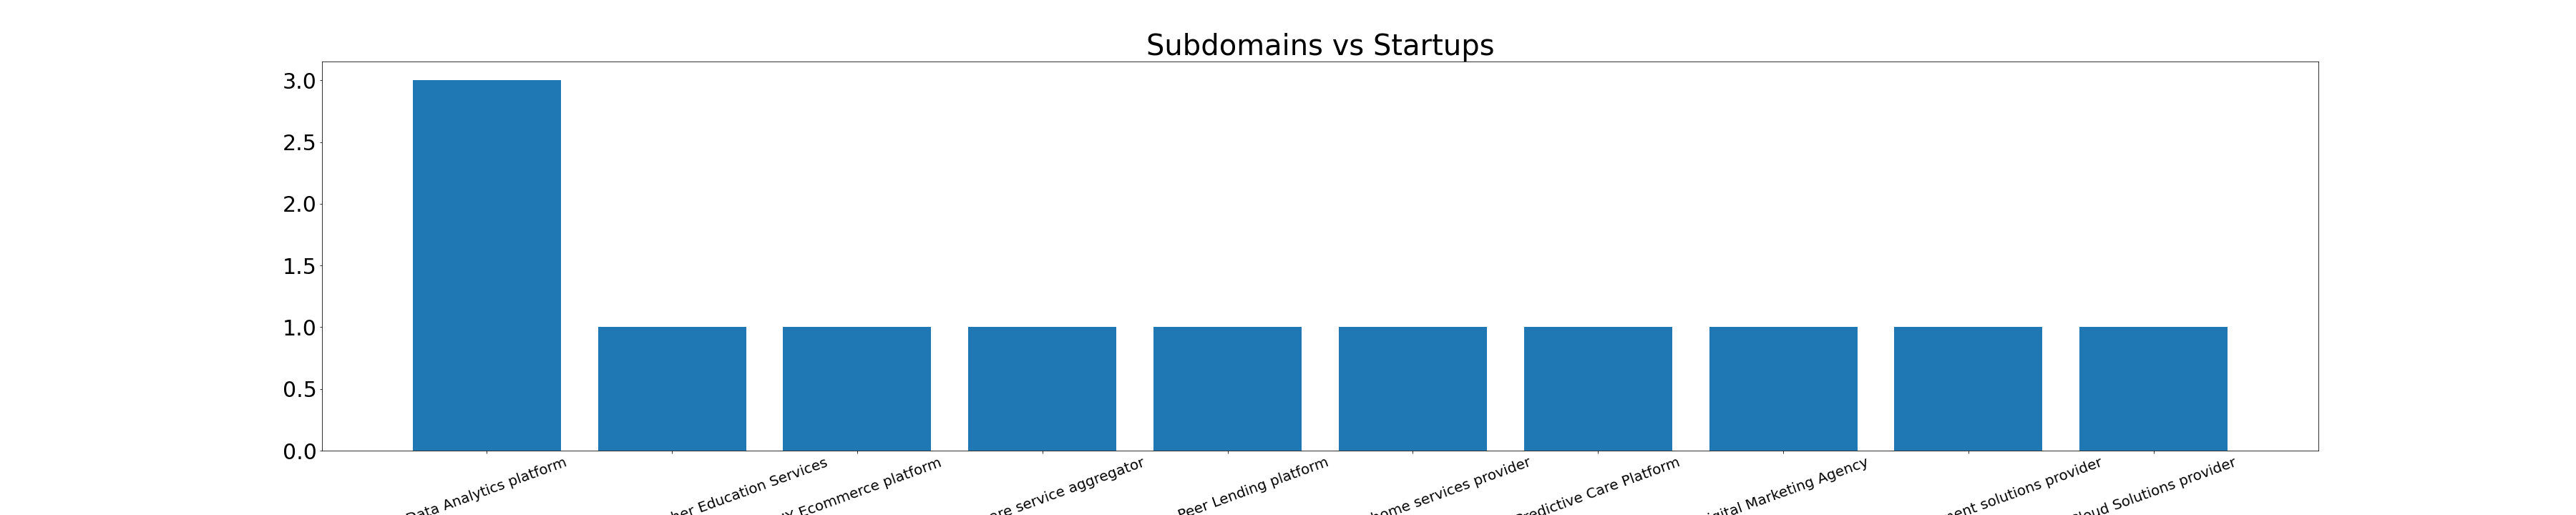
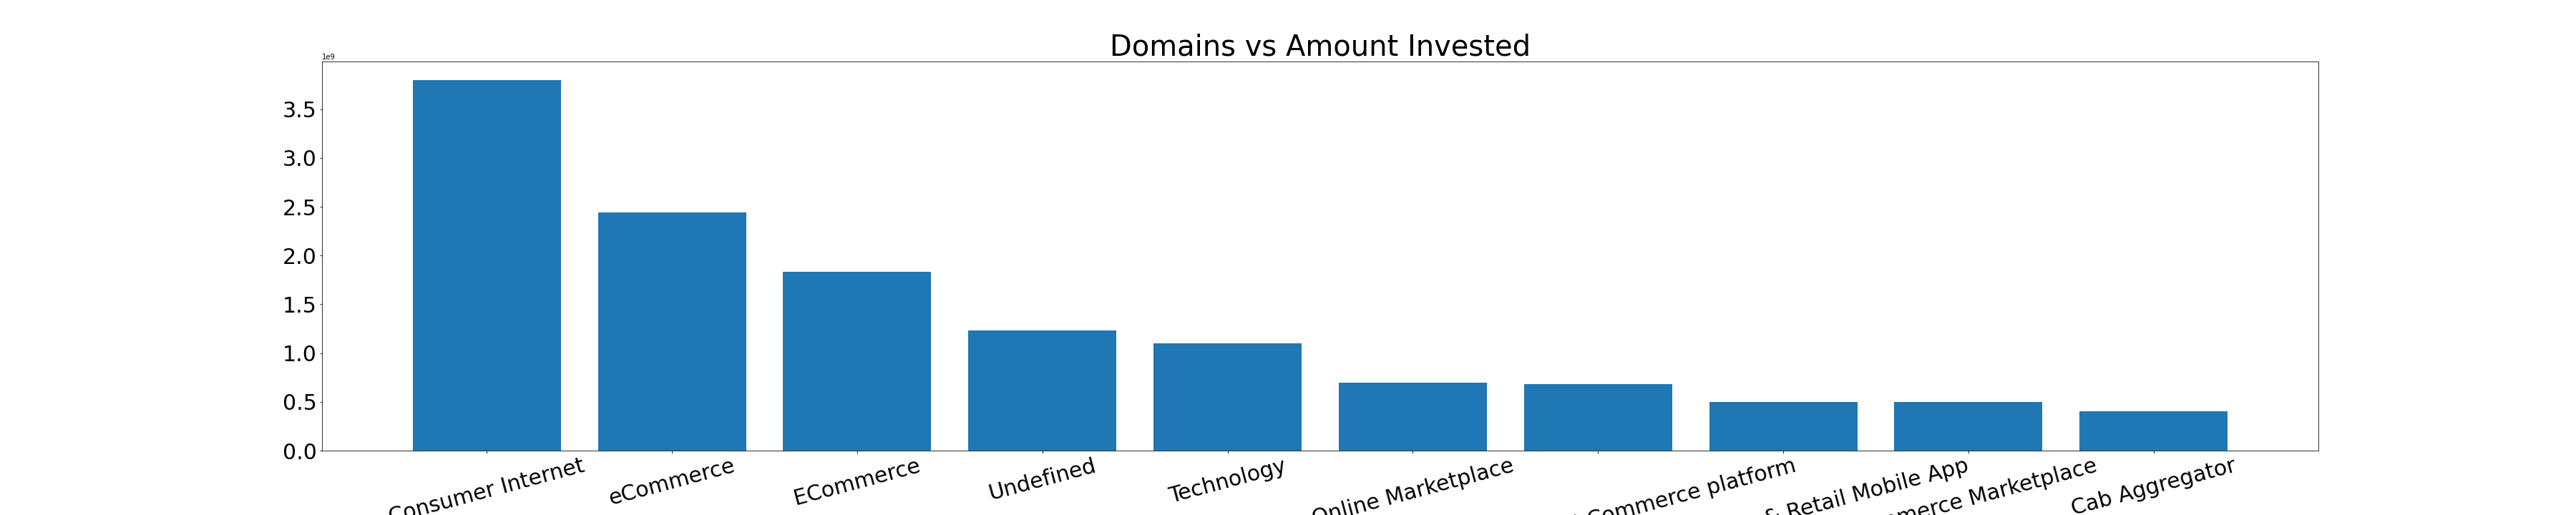
The visualization provides insights into the investment interests in the various domains and individuals can choose to either move towards the market or challenge it.
How we built it
We have used Python as our main programming language. Libraries used: Numpy, pandas, matplotlib. Platform Used: Jupyter Notebook & IBM Z. We scrabbled around for an accurate visualization in order to provide with best insights.
Challenges we ran into
Our team is always eager to implement innovative ideas. We had to find accurate and valid datasets for our visualization which was quite time-consuming finally we found our dataset in Kaggle, we discussed a lot about sanitation and the approach to achieve it, and decided on which metrics to visualize. Finally, we came up with the best and most feasible solution which enabled us to make better visualizations
Accomplishments that we're proud of
We focused on data sanitization and our target is to produce rich insights.
What we learned
This was the first time we are using IBM Z cloud and to be honest and it was amazing, it threw light on enterprise computing, connecting to a virtual cloud instance, and setting up the docker runtime was very interesting.
What's next for An Analysis of Startups in India
We plan to run our insights in a machine learning model which can find out the market gaps and facilitate young minds with information about investors in various domains which is already available in the dataset.

Log in or sign up for Devpost to join the conversation.