-
-

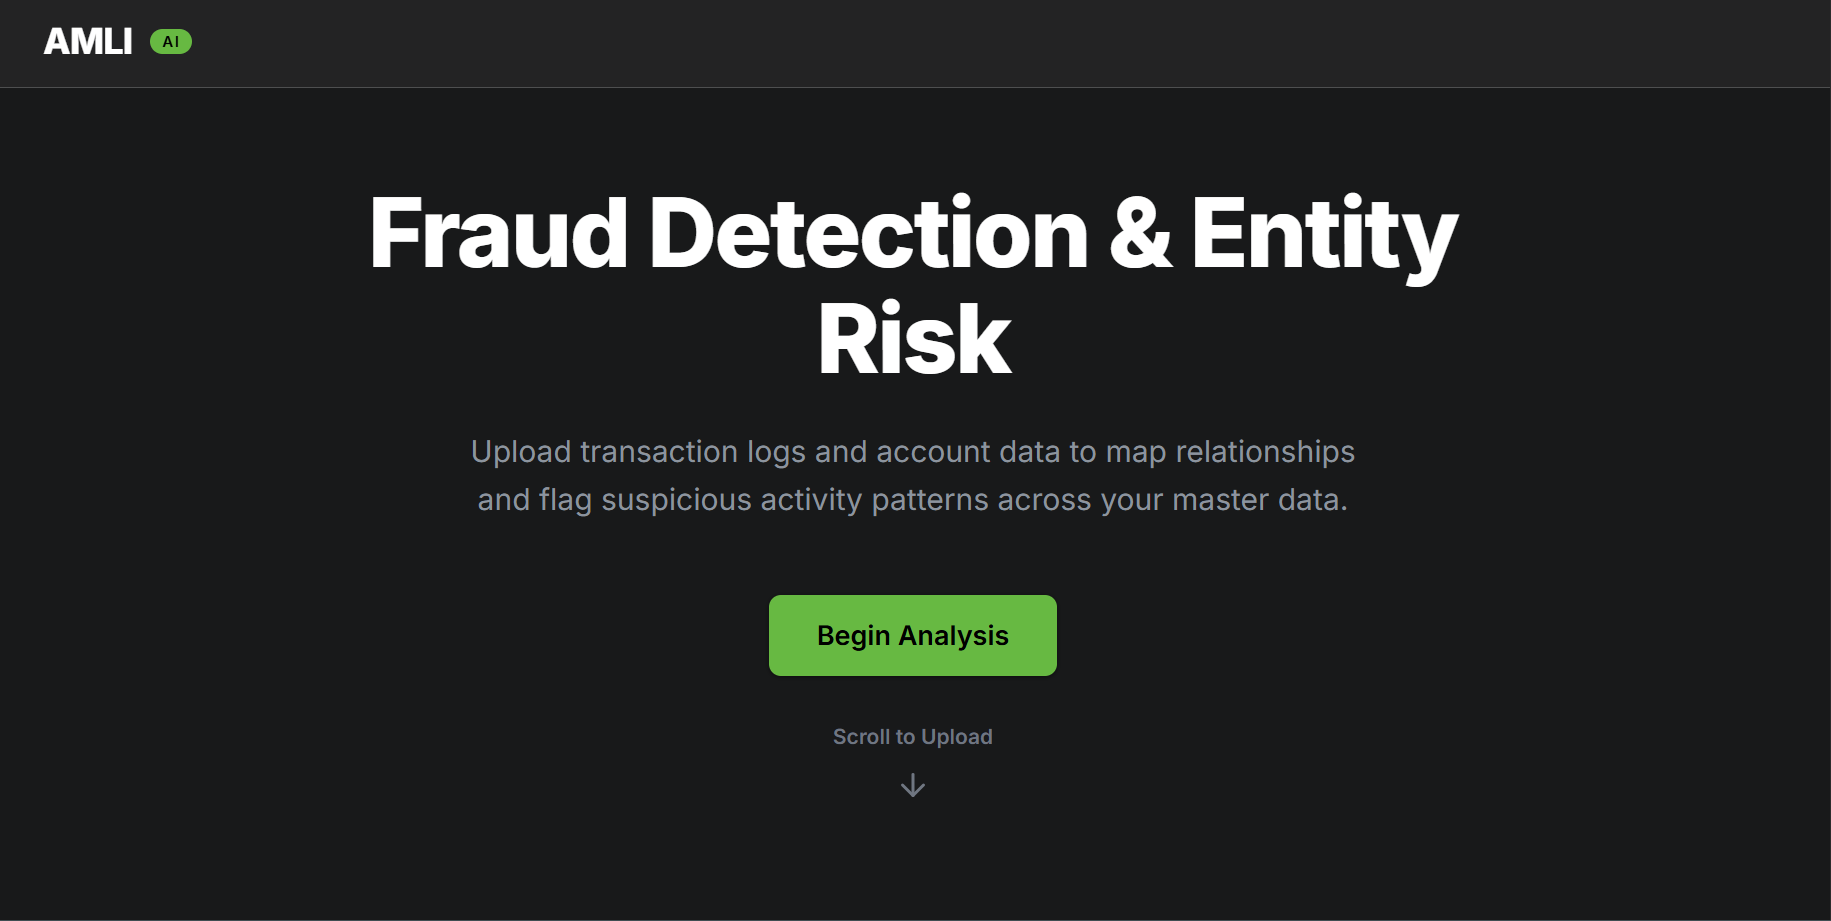
landing page
-
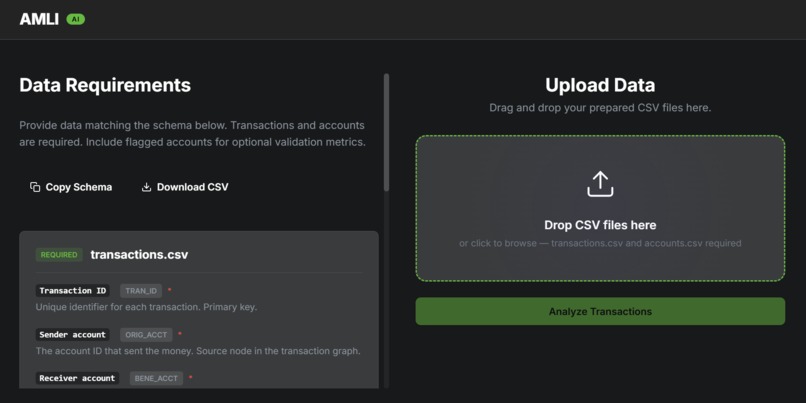
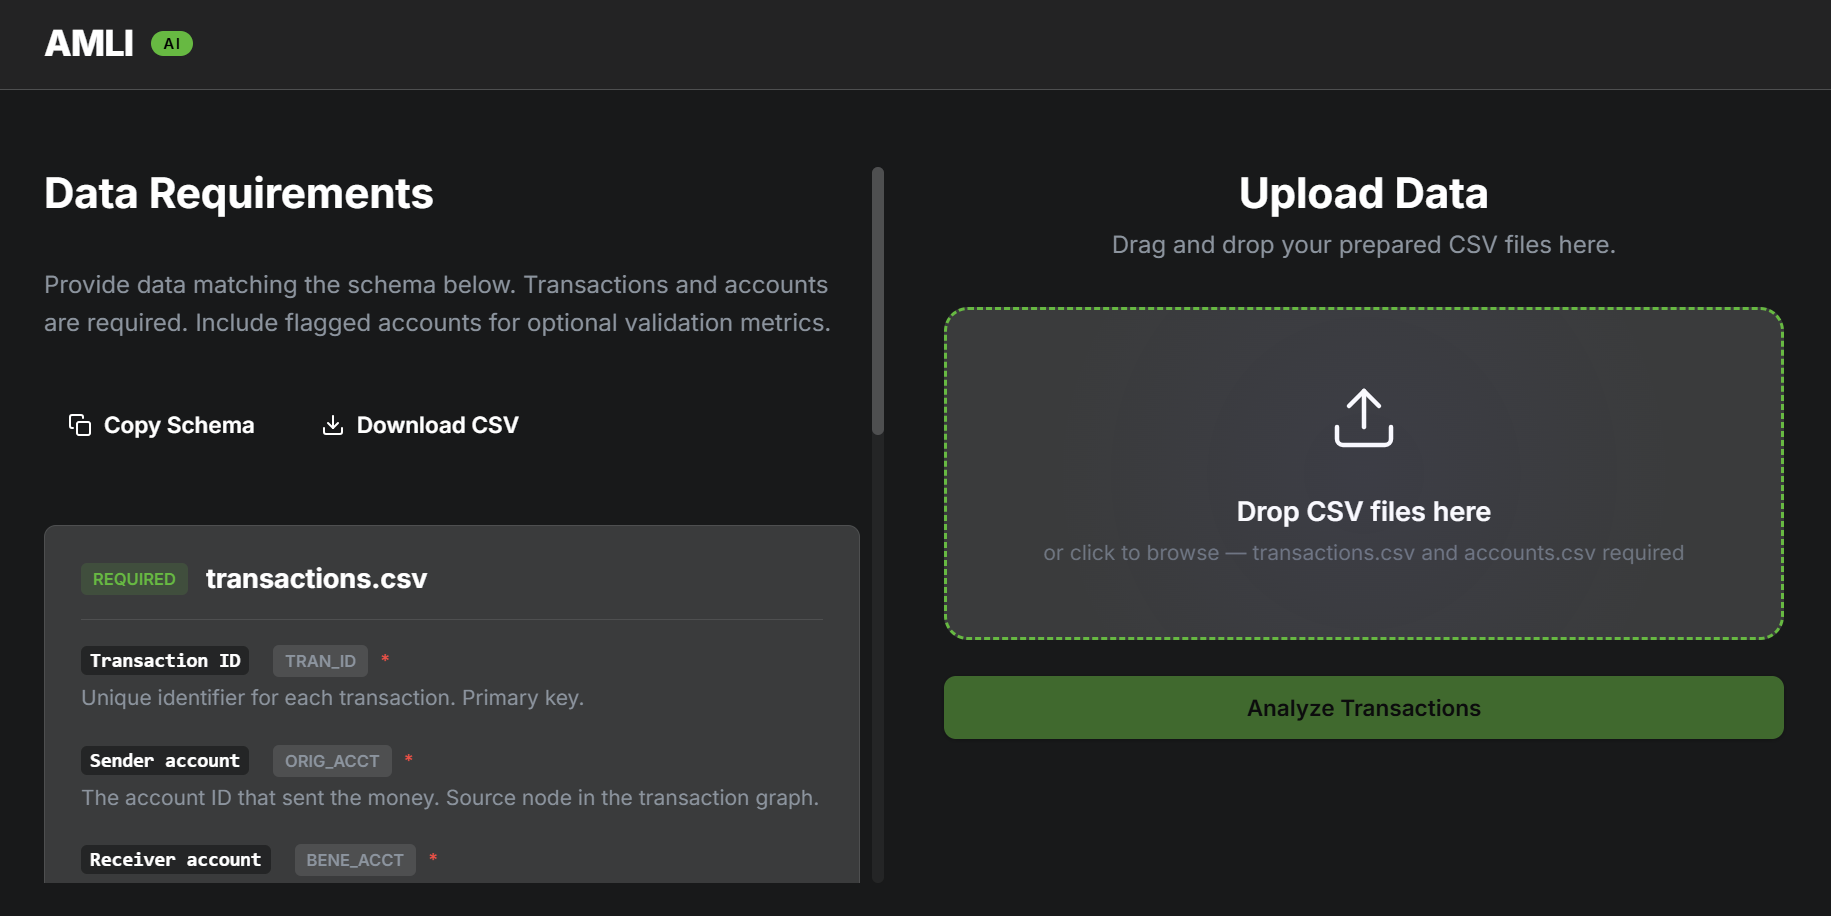
file upload
-
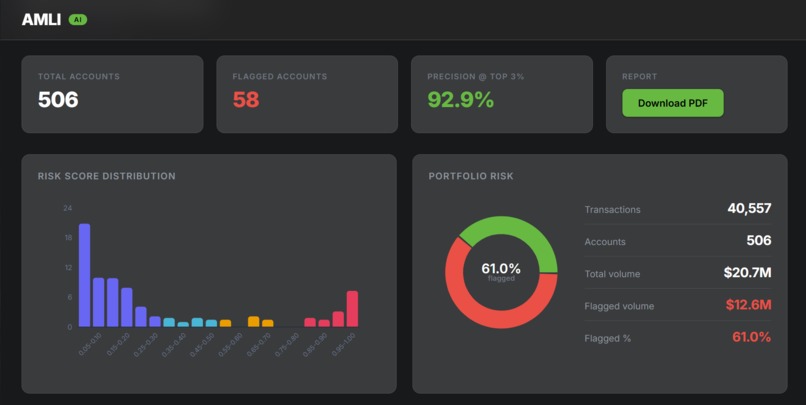
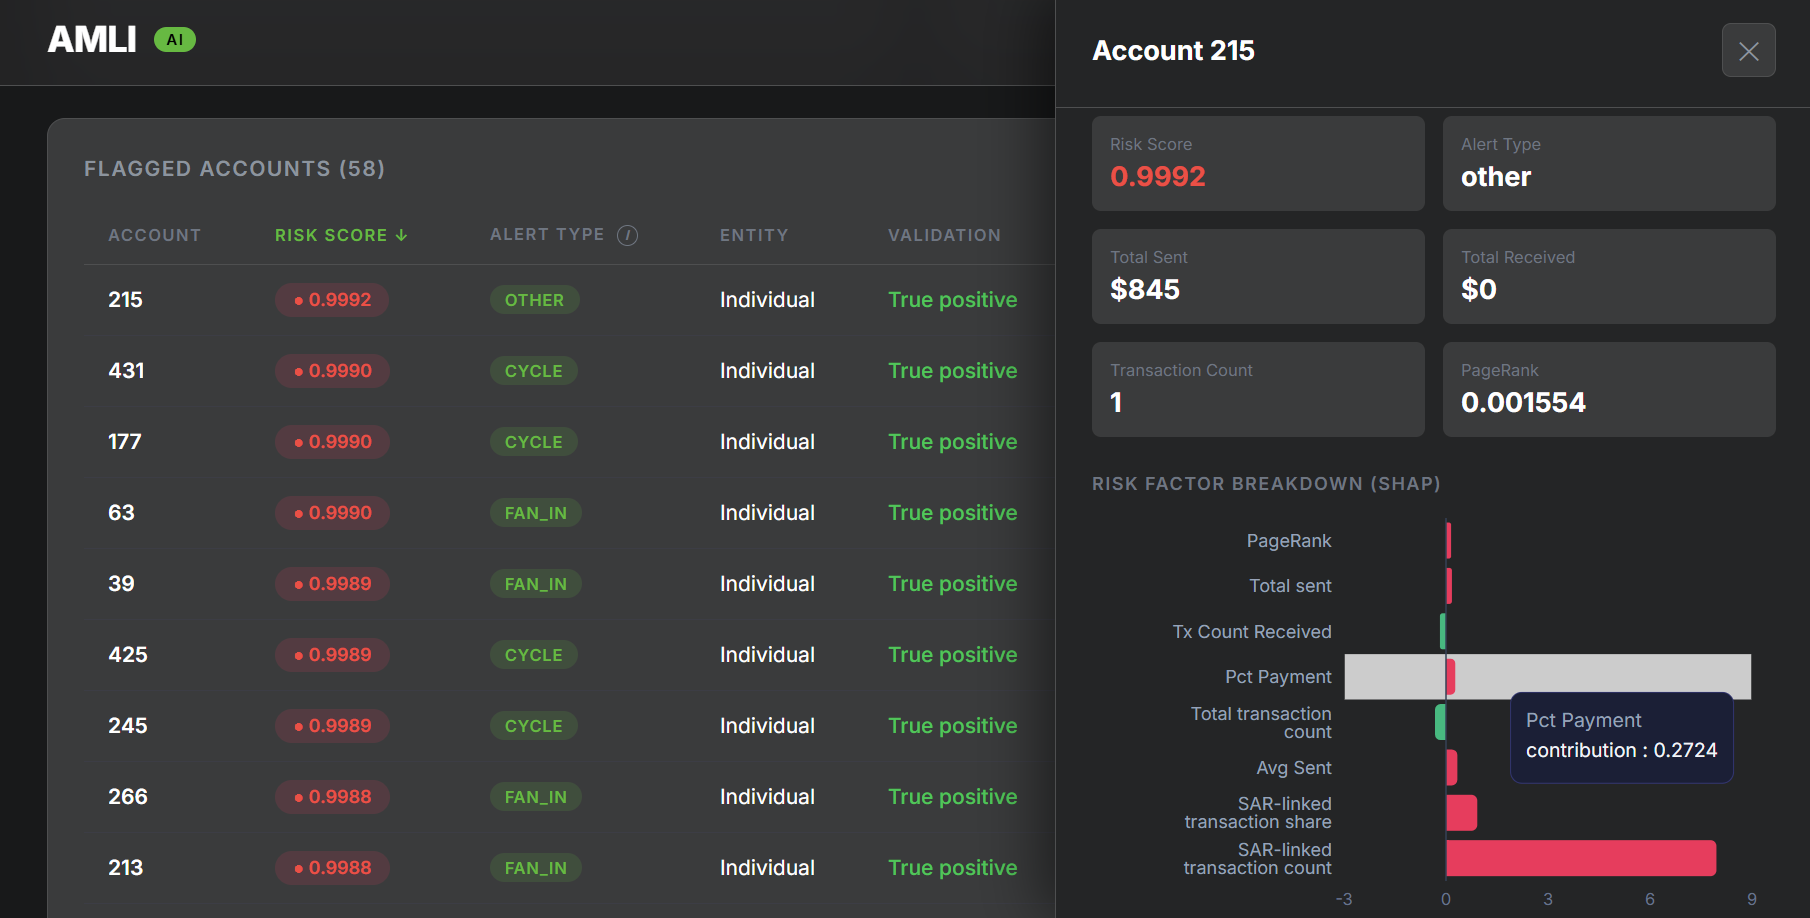
dashboard
-

analytics

Anti-Money Laundering Intelligence (AMLI)
💡 Inspiration
AML compliance is one of the most operationally expensive challenges in financial services. Global compliance costs exceed $274 billion annually, with US and Canadian institutions alone spending an estimated $61 billion on financial crime compliance. Despite this, detection remains largely reactive — rule-based systems flag obvious patterns while sophisticated laundering schemes slip through.
In our own capacity, we wanted to explore whether a graph-aware machine learning pipeline could surface behavioral anomalies that transaction-level rules miss, and whether an LLM could meaningfully translate the resulting mathematical risk signals into language a compliance investigator could act on.
⚙️ What it does
AMLI is an experimental compliance analysis tool. Users upload banking data — accounts and transactions — and the system builds a behavioral profile for each account while mapping the full transaction flow into a directed network graph. A risk score p(y=1 given x) is computed for every customer, and accounts crossing the high-risk threshold receive a plain-English Compliance Investigator Summary generated by IBM watsonx.ai Granite.
The output is a dashboard showing flagged accounts ranked by risk, with SHAP-based feature attribution charts and LLM summaries explaining the specific behaviors driving each flag.
🏗️ Architecture
The pipeline is designed to capture both behavioral and structural signals:
- Frontend: Next.js dashboard for dataset upload, run management, and results visualization including a force-directed network graph of flagged account clusters
- Backend: FastAPI service handling asynchronous pipeline execution via background tasks, with pandas for behavioral feature engineering and igraph for network graph construction
- Feature Engineering: Two parallel feature sets — tabular behavioral metrics (transaction velocity, structuring indicators, send/receive ratios) and topological graph metrics (PageRank, betweenness centrality, community detection via Louvain)
- Machine Learning: LightGBM binary classifier trained on the combined feature set, with scale_pos_weight to handle class imbalance at under 0.1% positive rate. Evaluated on AUC-ROC rather than accuracy given the imbalance
- Explainability: SHAP computes each feature's contribution by averaging its marginal effect across all possible subsets of the remaining features — giving a fair, additive decomposition of the model's prediction for each account. The top contributing features are structured into a prompt and sent to IBM watsonx.ai (Granite) to generate the final compliance summary
- Infrastructure: Fully containerized via Docker Compose — three services: Next.js frontend, FastAPI backend, and PostgreSQL for run persistence and report storage
🎯 Feasibility, Viability, Desirability
- Feasibility: The pipeline is lightweight and asynchronous, designed to handle large transaction datasets within realistic compute constraints. Progress is streamed to the frontend so the UI remains responsive during processing
- Viability: The architecture mirrors real-world data pipeline patterns. Replacing the CSV upload layer with a direct database connector would allow a system like this to integrate into existing operational workflows with minimal structural changes
- Desirability: The UI is designed to reduce investigator cognitive load. SHAP values are surfaced as visual waterfall charts and translated into readable summaries — the goal being that a compliance analyst with no ML background can immediately understand why an account was flagged and what to do next
🧠 Challenges
Graph analytics at scale introduced significant computational overhead. Betweenness centrality is an O(V × E) operation — on a 50K node, 5M edge graph this caused the API to time out entirely. We resolved this by moving all graph computation into FastAPI BackgroundTasks and streaming status updates to the frontend, keeping the UI responsive throughout.
Highly imbalanced training data required rethinking our evaluation approach. Standard accuracy is meaningless at a 0.1% positive rate — a model predicting zero for everything scores 99.9%. We shifted entirely to AUC-ROC and precision at the top percentile as our primary metrics, and used scale_pos_weight to prevent the model from collapsing to the majority class.
Honestly, there were way too many issues to count and as one would expect we barely scraped together a working end product. Cheers 🤙
🚀 What's next
The most valuable near-term addition would be a temporal graph dimension — tracking how transaction networks evolve over time rather than analyzing a static snapshot. We're also interested in deploying an open-weight LLM locally to handle compliance summarization without relying on an external API, which would make the system viable in air-gapped banking environments where data cannot leave the network.
Built With
- docker
- fastapi
- fpdf2
- ibm-watsonx.ai
- igraph
- lightgbm
- next.js
- pandas
- postgresql
- python
- react
- recharts
- shap
- sqlalchemy
- typescript

Log in or sign up for Devpost to join the conversation.