-
-
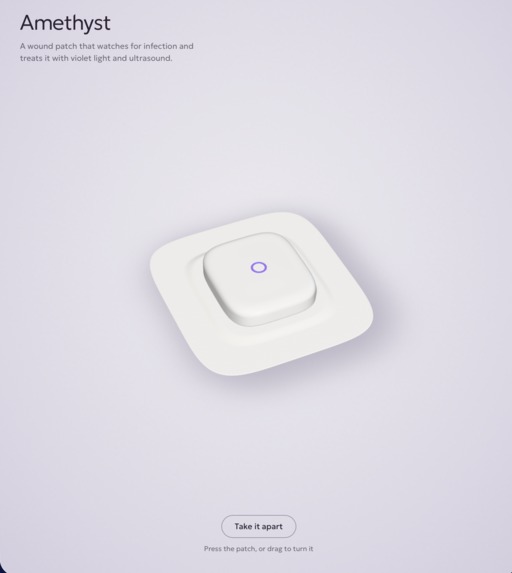
Amethyst Patch
-
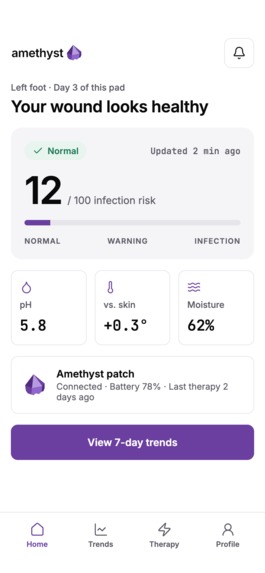
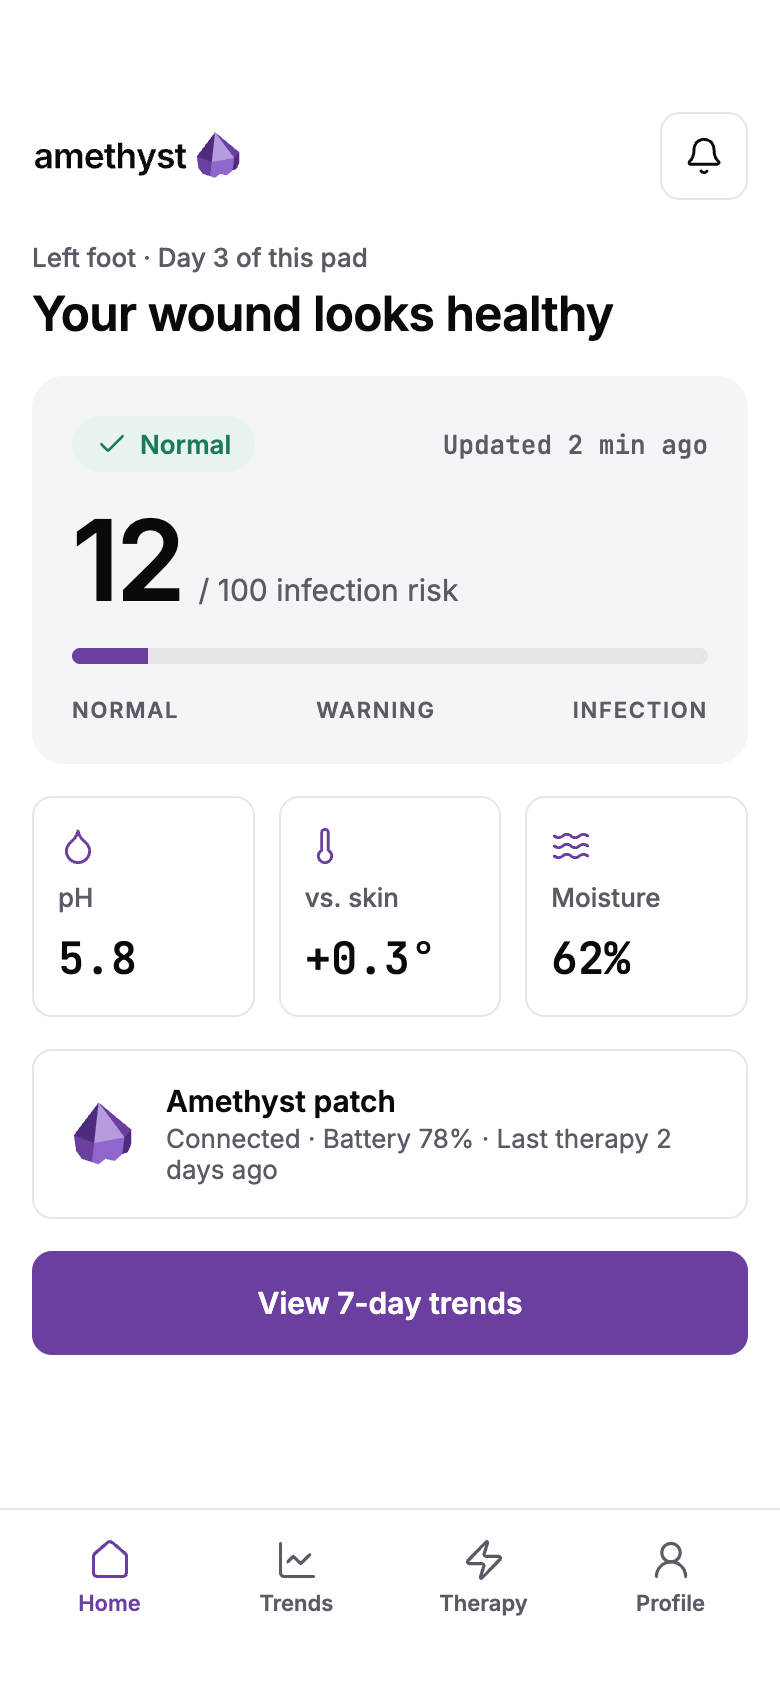
Home Page
-
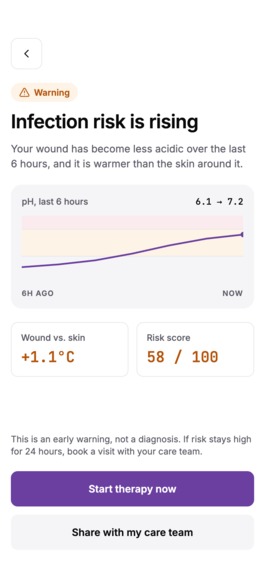
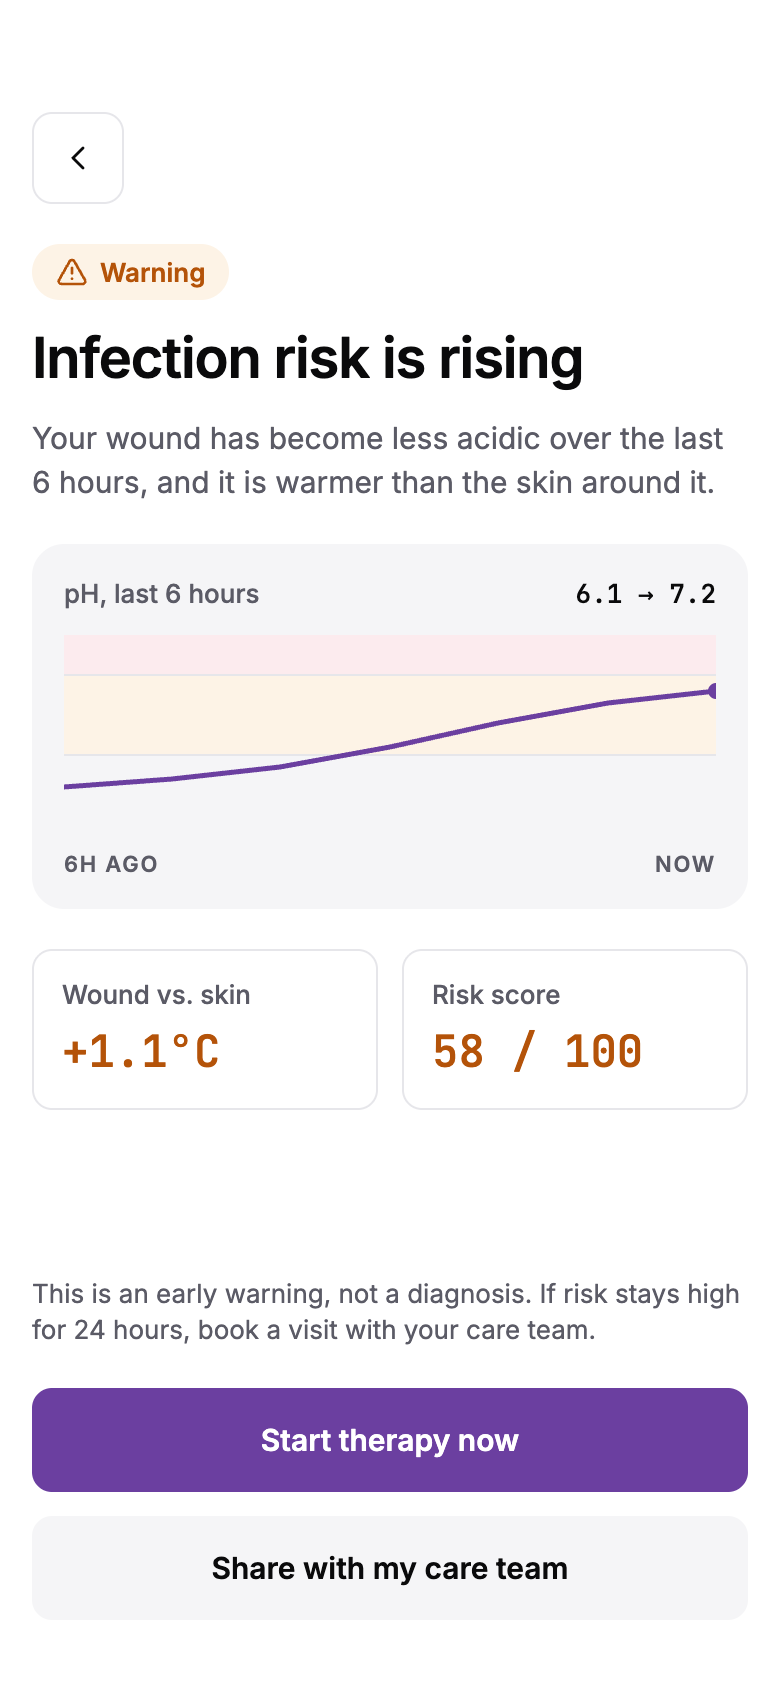
Risk alert
-
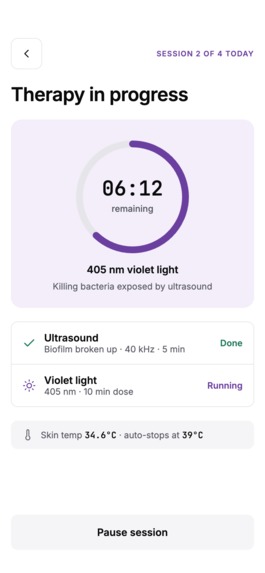
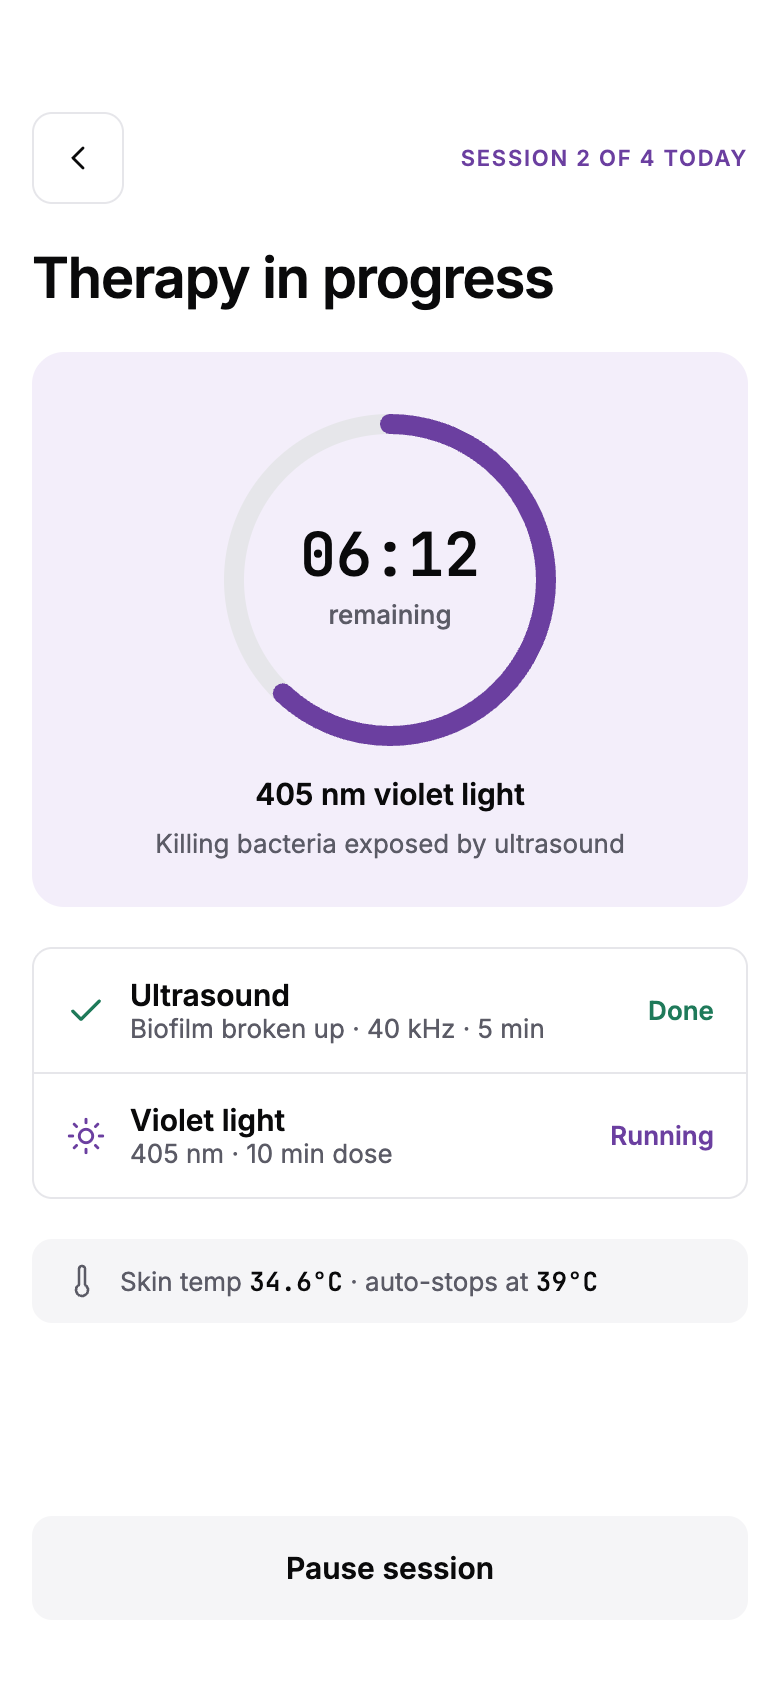
Therapy
-
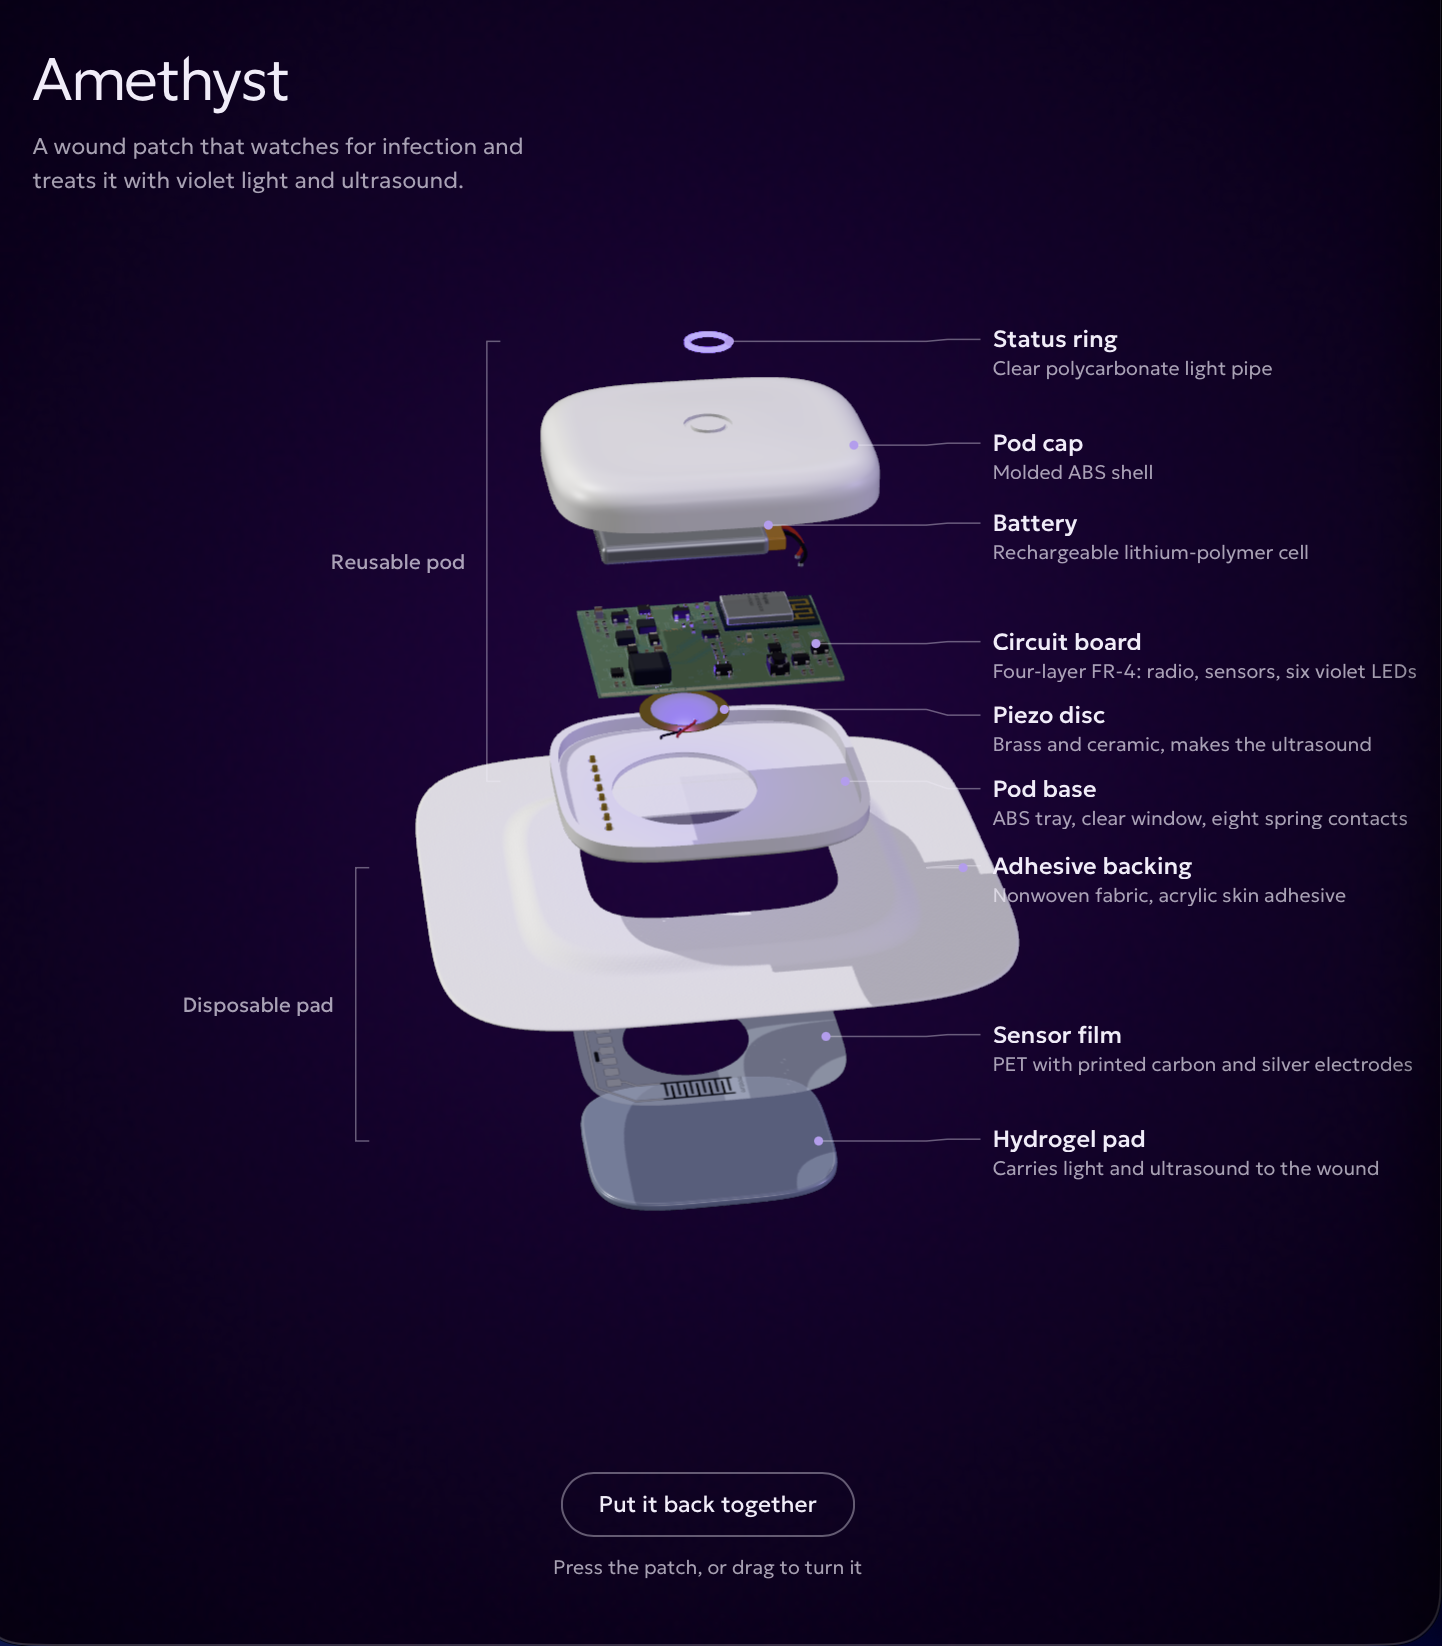
Hardware Components
-
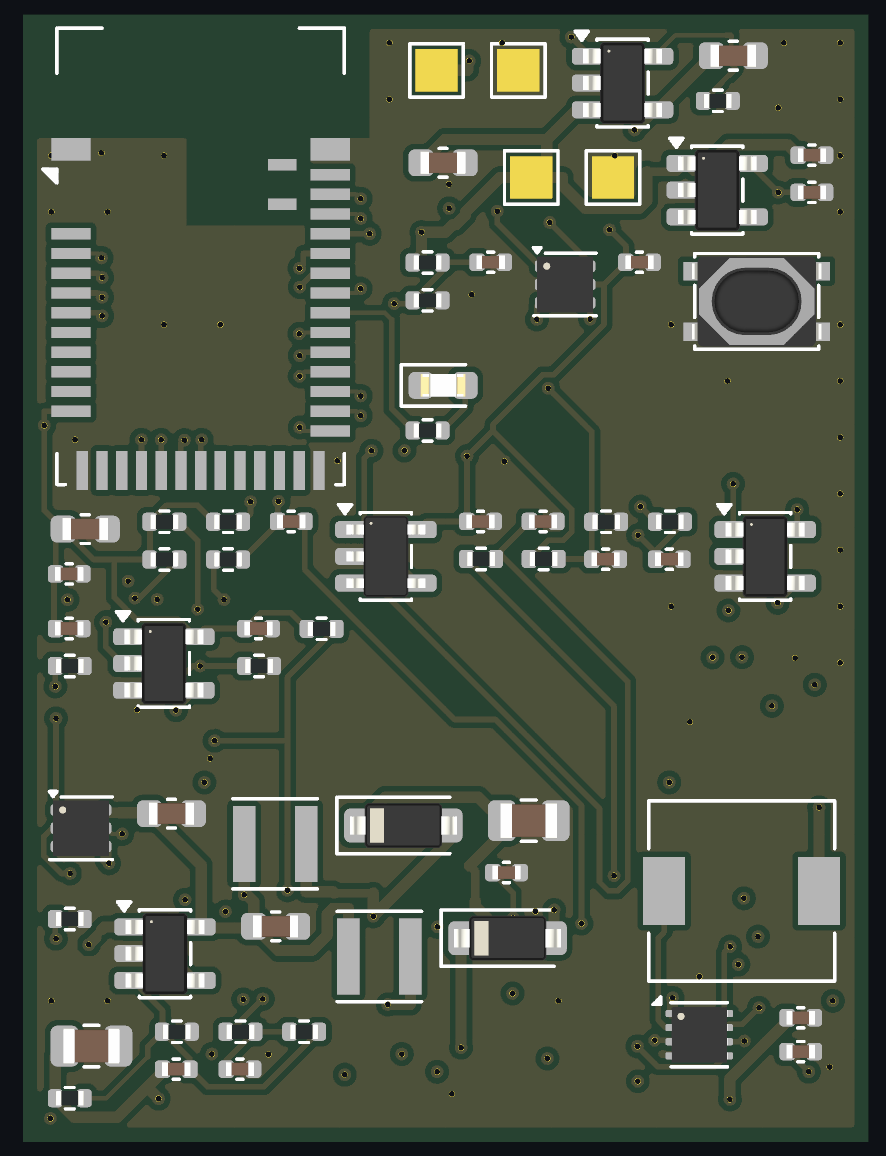
Custom PCB
-
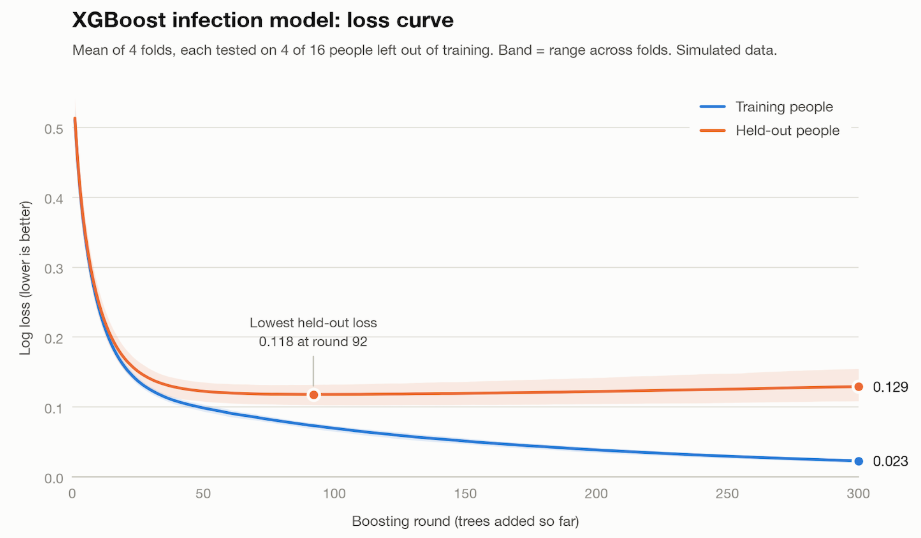
Loss Curve for XG Boost Model
Inspiration
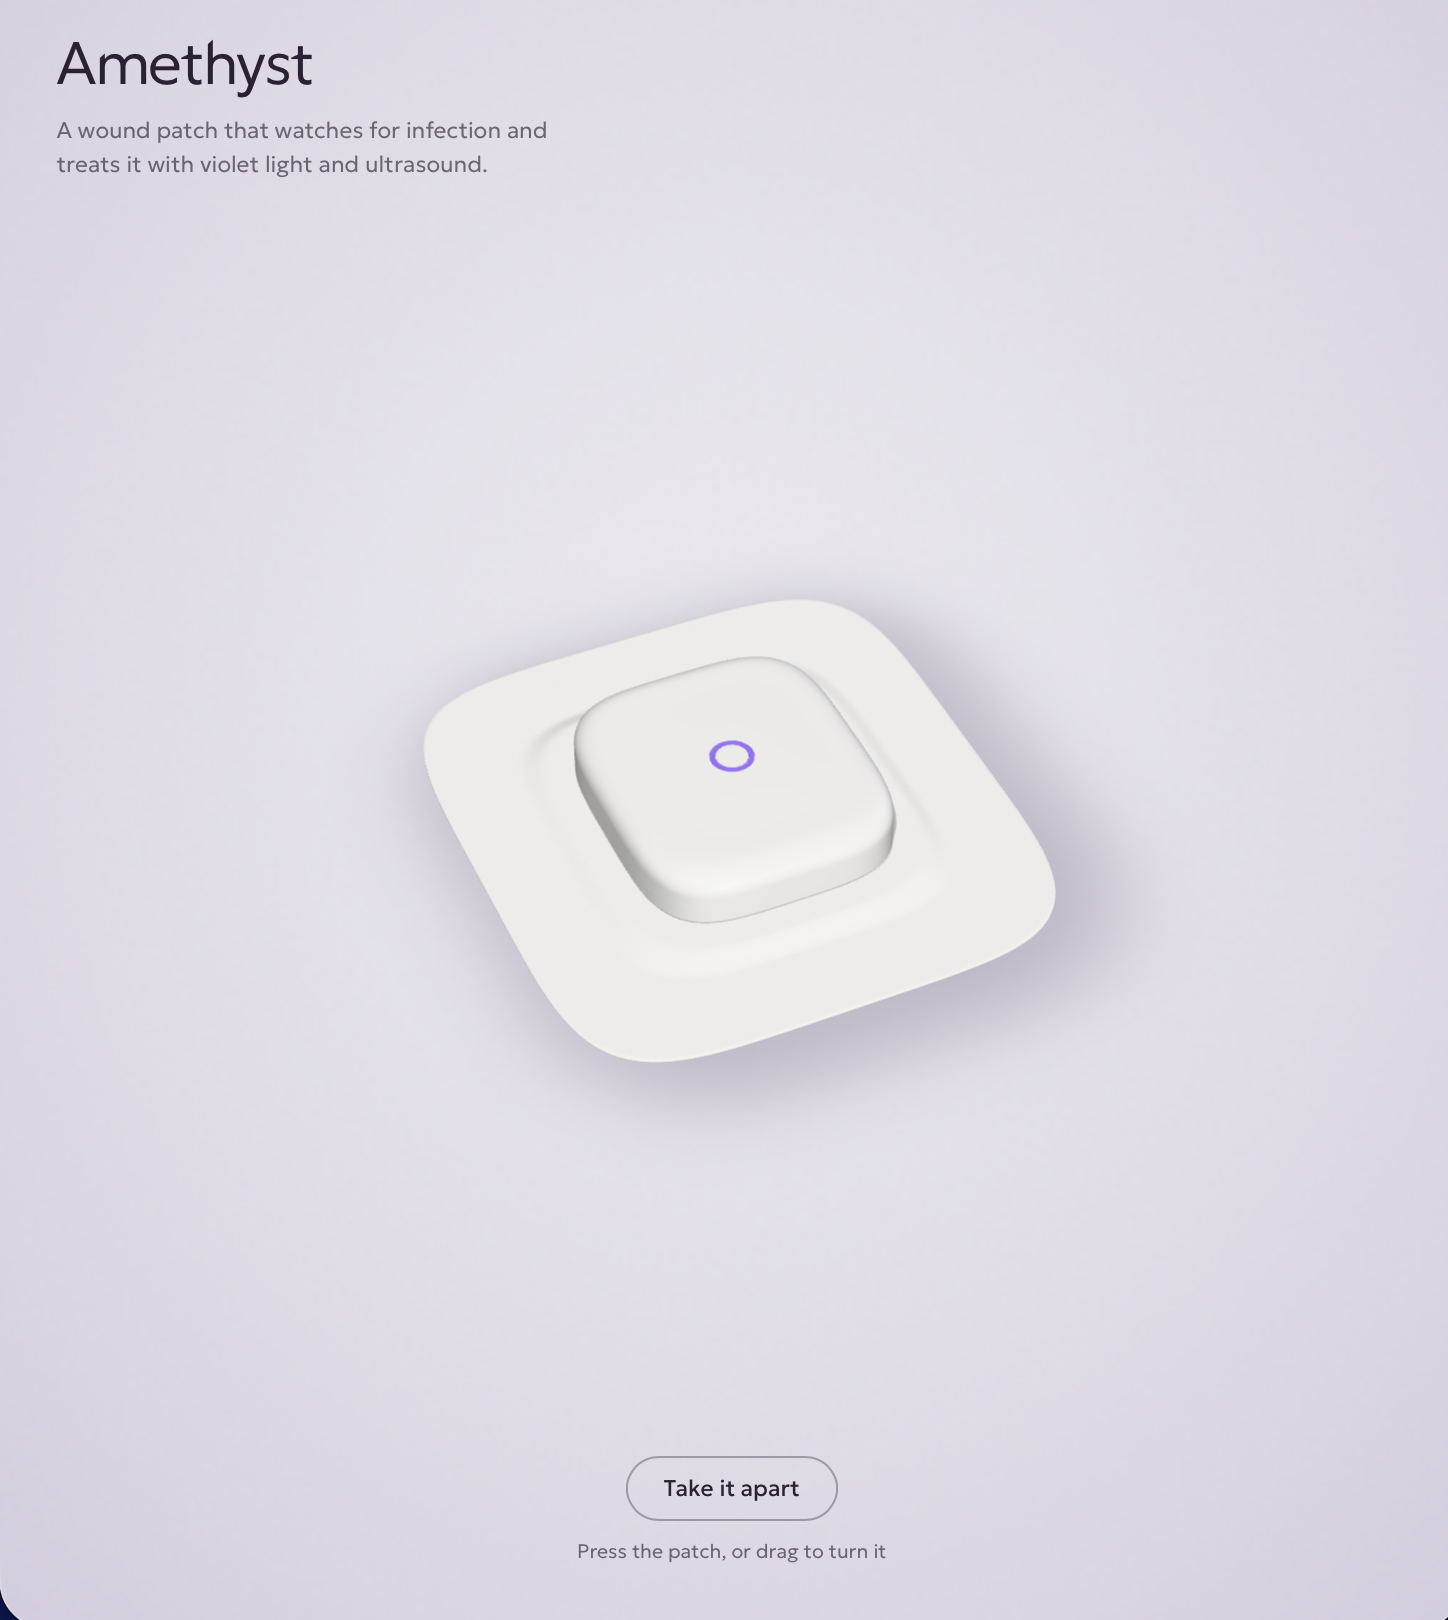
A wound can be getting infected for a day or more before anyone notices. By then it's red, swollen and often already a serious problem. For people with diabetes it's worse: nerve damage takes away the pain that would normally warn them, and an infected foot ulcer can lead to a hospital stay or an amputation.
The early signs are measurable long before they're visible. Infected wounds become more alkaline, warmer and wetter. We wanted a dressing that notices those changes and treats the infection before a person would. Its treatment uses violet light, so we called it Amethyst.
What it does
Amethyst is a smart wound patch that watches for infection, treats it, and keeps the care team in the loop.
- Senses: every 30 minutes the patch reads wound pH, moisture (impedance), and temperature at three spots: the wound edge, healthy skin nearby as a reference, and the air. Blood glucose comes from the wearer's CGM.
- Predicts: a trained XGBoost model compares each reading with that patient's own first-day baseline. It scores both how likely an infection is and how severe the signs are, giving a 0–100 risk score.
- Treats: when risk reaches the treat tier, the patch runs low-frequency ultrasound to break up biofilm, then 405 nm violet light to kill bacteria. Lower-risk wounds get gentle healing ultrasound and closer monitoring instead.
- Thinks: a Gemini agent reviews every decision. It explains the trend in plain language and flags readings that don't make sense. It also points out when the sensors disagree with the model and says when a clinician should take a look.
- Shows: a companion app gives the wearer their risk, trends, alerts, a guided therapy session, and one-tap sharing with their care team.
- Records: every reading and assessment is stored in Databricks, where a care-team dashboard shows every monitored wound, which ones need attention, and what the agent concluded.
Example: if a temperature sensor suddenly reads 43 °C, the agent recognizes a sensor fault rather than a fever. If the patch peels off, treatment is automatically skipped.
How we built it
Research and data
We pulled values from 30+ published studies on how pH, temperature and moisture change during wound infection. No public dataset of continuous wound-sensor readings with infection outcomes exists, so we built a simulator from those values and real continuous glucose monitor data from 16 people (PhysioNet). It simulates 600 wounds over 14 days, with a reading every 30 minutes:
$$600 \text{ wounds} \times 14 \text{ days} \times 48 \text{ readings/day} = 403{,}200 \text{ labelled readings}$$
The simulation includes realistic noise: showers, dressing changes, sensor drift and patches peeling off.
Model: random forest vs. XGBoost
Each of the 5 input signals gets 5 features: a 6-hour rolling median, the change from the patient's own day-1 baseline, the 6-hour change, the 24-hour change and the 24-hour standard deviation. Two time-of-day features capture the daily temperature cycle:
$$5 \times 5 + 2 = 27 \text{ features}, \qquad \text{tod} = \left(\sin\frac{2\pi h}{24},\ \cos\frac{2\pi h}{24}\right)$$
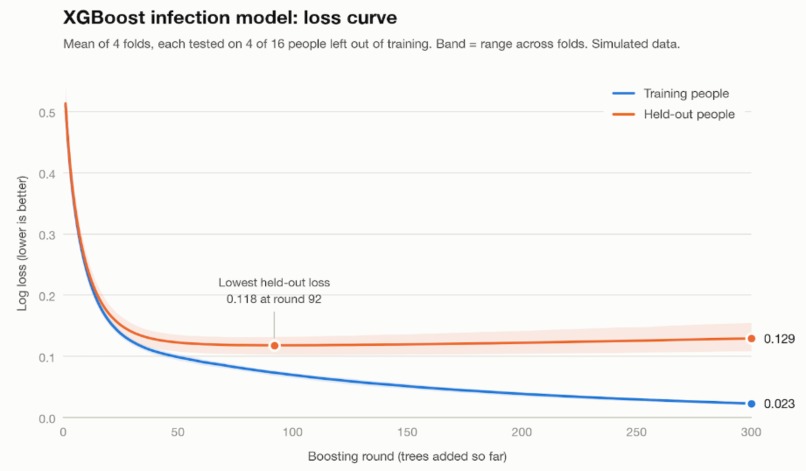
We trained both classifiers on the same features and tested them on people they had never seen (leave-one-person-out validation, 16 folds):
- AUC: random forest 0.976, XGBoost 0.978
- Brier skill score: random forest 0.834, XGBoost 0.845
- Infected wounds detected: 100% for both
- Median hours from infection onset to alarm: random forest 30.3, XGBoost 27.2
- False alarms on clean wounds: random forest 0.3%, XGBoost 2.1%
- Model size: random forest 11.9 MB, XGBoost 3.1 MB
- Time per prediction: random forest 12.4 ms, XGBoost 0.14 ms
$$30.3 - 27.2 = 3.1 \text{ h earlier}, \qquad \frac{11.9}{3.1} \approx 3.8\times \text{ smaller}, \qquad \frac{12.4}{0.14} \approx 89\times \text{ faster}$$
We chose XGBoost: on a wearable, catching infection earlier, a smaller model and faster predictions matter most. The random forest had 7× fewer false alarms (2.1 ÷ 0.3 = 7). The severity scaling, risk smoothing and the agent's review help absorb that trade-off.
From probability to a treatment plan
The model outputs three classes (normal, warning, infection). The likelihood of infection is
$$p = P(\text{warning}) + P(\text{infection})$$
Trained on cleanly separated data, the classifier is near-certain for any sustained shift, even a mild one. So we multiply it by a severity score: how far the signs have actually moved from the patient's own baseline toward a full infection (pH +0.65, temperature +1.6 °C, moisture impedance −35%, wound glucose −40%):
$$s = \text{mean of the 3 largest of } \left\lbrace \frac{\Delta \text{pH}}{0.65},\ \frac{\Delta T}{1.6^{\circ}\text{C}},\ \frac{-\Delta \ln Z}{-\ln 0.65},\ \frac{-\Delta g / g_0}{0.40}\right\rbrace$$
Each term is capped at 1.25 and s at 1. Using the top 3 of 4 means an infection whose pH never rises (it happens) still scores.
To stop one noisy reading from triggering treatment, we smooth the product with an exponential moving average (time constant τ = 3 h, step Δt = 0.5 h):
$$R_t = R_{t-1} + \alpha(100 p_t s_t - R_{t-1}), \qquad \alpha = \frac{\Delta t}{\tau + \Delta t} = \frac{0.5}{3.5} \approx 0.143$$
A single reading at full strength (p·s = 1) only raises the risk from 0 to 14.3. A sustained full-strength infection reaches watch (30) in 1.5 h, treat (55) in 3 h and intensive (80) in 5.5 h.
Tiers have 10-point hysteresis: each tier is entered at its threshold but only left 10 points below it, so the device doesn't flip on and off every reading.
405 nm light. Light only runs in the treat tier (risk ≥ 55); below that, doses would be too small to kill bacteria. The dose scales from risk 30 to 90, and the 36 J/cm² daily cap is split over 3 sessions:
$$x = \min\left(\max\left(\frac{R - 30}{60}, 0\right), 1\right), \qquad E_{\text{session}} = \frac{36}{3}x = 12x \ \text{J/cm}^2$$
At 10 mW/cm² (0.010 W/cm²), time is energy divided by power. At the treat threshold:
$$R = 55:\quad x = \frac{25}{60} = 0.417 \Rightarrow E = 5 \text{ J/cm}^2 \Rightarrow t = \frac{5}{0.010} = 500 \text{ s} \approx 8.3 \text{ min}$$
At maximum risk:
$$E = 12 \text{ J/cm}^2 \Rightarrow t = \frac{12}{0.010} = 1200 \text{ s} = 20 \text{ min}, \qquad 3 \times 12 = 36 \text{ J/cm}^2 \text{ per day}$$
Low-frequency ultrasound runs before the light to break up biofilm. It scales from risk 55 to 90:
$$y = \min\left(\max\left(\frac{R - 55}{35}, 0\right), 1\right), \qquad t_{\text{US}} = \max(4,\ 10y) \text{ min}, \qquad I = 0.1 + 0.4y \ \text{W/cm}^2$$
Worked example. At R = 72.5:
$$x = \frac{42.5}{60} = 0.708 \Rightarrow E = 8.5 \text{ J/cm}^2 \Rightarrow t = 850 \text{ s} \approx 14.2 \text{ min}$$
$$y = \frac{17.5}{35} = 0.5 \Rightarrow t_{\text{US}} = 5 \text{ min}, \qquad I = 0.1 + 0.4 \times 0.5 = 0.3 \text{ W/cm}^2$$
So the session is 5 min of ultrasound, then 14.2 min of violet light.
Healing ultrasound (monitor and watch tiers): 20 min/day split over 3 sessions:
$$\frac{20}{3} \approx 6.7 \text{ min per session}$$
Hardware
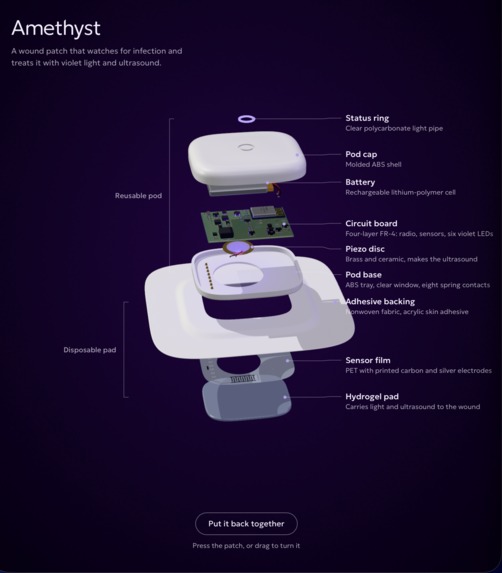
A reusable 30 × 40 mm, 4-layer pod that clips onto a disposable hydrogel pad. It has:
- an nRF52832 Bluetooth chip;
- three TMP117 temperature sensors (wound edge, reference skin, ambient);
- a moisture sensor that drives a 1 kHz signal through the pad electrodes and measures impedance, with no dedicated chip;
- a buffered pH electrode;
- a ring of six 405 nm LEDs;
- a 30 kHz piezo disc driven by an H-bridge.
A pad-ID resistor tells the board a pad is attached. A button gives a daily pain and odour check-in.
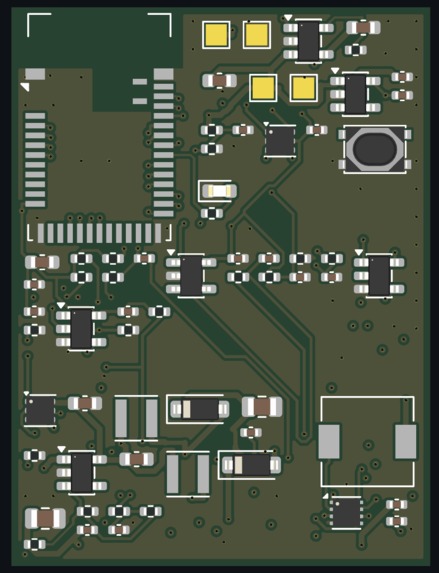
The whole board is generated from one Python file: the schematic, part placement, autorouting (all 178 connections) and design-rule checks rebuild in one command.
Power and heat. Sensing averages about 22 µA, so roughly 60 days on a 40 mAh cell. We modelled skin heating to pick the light intensity:
- At 10 mW/cm², skin reaches 37.3 °C, or 38.7 °C on a poorly perfused diabetic foot, even including the LEDs' own heat. Both are below our 41 °C ceiling.
- At 20 mW/cm², the diabetic foot would reach 43.4 °C, so we stayed at 10.
Firmware
Written in C. It reads every 30 minutes (the model's time step), streams readings to the phone, and takes the dosing plan directly as a command. 15 tests pass on a simulated board.
Safety in three layers
- Software: the dosing engine caps every dose.
- Firmware: the patch enforces the same caps again, even if the phone asks for more:
- 10 mW/cm² of light;
- 36 J/cm² per day;
- 10 minutes of pulsed ultrasound;
- a stop above 41 °C;
- no therapy if the patch is lifted (above 150 kΩ), no pad is attached, or the battery is low.
- Hardware: logic gates wired to the temperature sensors' alert pins cut therapy at 42 °C, even if the firmware crashes.
The AI agent
A Gemini agent calls three tools: fetch the sensor history, run the XGBoost model, and run the dosing engine. It never invents a risk score or a dose; those always come from our model and our capped dosing code.
The agent judges the evidence: it describes the trend against the patient's baseline, flags sensor faults and lifted patches, points out signals that disagree with the model, rates its own confidence, and decides whether a clinician should review. We gave it each sensor's accuracy on its own, so it weighs the strong signals (moisture, temperature, pH) above the weak one (blood glucose, which meals push around).
After it writes, our code fact-checks its notes against the tool results (risk score, tier, lifted patch, clinician review) and makes it correct anything that doesn't match. Each assessment takes about 5 seconds and costs about half a cent.
App, cloud and demo
- App (Expo): five screens: Pair, Home, Risk alert, Therapy (a live countdown that auto-stops at 39 °C), and Trends against the patient's baseline.
- Databricks: readings and assessments are stored in two tables on a SQL warehouse, and a care-team dashboard shows every monitored wound, which need attention, and the agent's conclusions.
- Live demo and hardware API (FastAPI): the patch, or any script, can
POST /api/readingsand get back a risk score and therapy plan. The demo UI animates the whole pipeline live, and the app updates within a second. If the AI is unavailable, a rule-based summary takes over so the demo never breaks. - Demo film: made in Remotion.
Challenges we ran into
- No real labelled data exists, so we built a literature-grounded simulator and validated it on people the model had never seen.
- An overconfident model. Trained on clean simulated data, the classifier said "infection" with near-100% confidence for even a mild shift, so the risk score jumped straight from 0 to 100. We fixed it by multiplying the likelihood by a severity score, so a mild change gives a moderate risk and a full infection a high one.
- Real infections don't follow the textbook. In some infections pH doesn't rise, and temperature can rise by less than 1 °C. Our severity score uses the strongest 3 of 4 signs, and we taught the agent that one missing sign isn't evidence against infection, while still catching real sensor faults.
- Picking the model: the random forest had 7× fewer false alarms, but XGBoost detected infection 3.1 h earlier and was 89× faster. We chose early detection.
- Dosing that makes sense: smoothing the risk created a zone where a wound was being watched but got no treatment at all. We redesigned the tiers: watch now means closer monitoring plus healing ultrasound, and antibacterial light starts only at treat, where the dose is actually high enough to kill bacteria.
- Heat: our modelling showed brighter light would overheat a diabetic foot, so we capped intensity at 10 mW/cm² and added a hardware temperature cutoff.
Accomplishments that we're proud of
- AUC 0.978 on patients the model had never seen, with every infected wound detected a median of 27.2 hours after onset (simulated data).
- A model small enough for a wearable: 3.1 MB, 0.14 ms per prediction.
- A full stack in one weekend: board → firmware → model → AI agent → app → cloud dashboard.
- Safety enforced at three independent layers: software, firmware and hardware.
- An agent that reliably separates sensor faults, lifted patches and meal-related glucose spikes from real infections, with its notes fact-checked by code.
What we learned
- Moisture is the single strongest predictor of infection (AUC 0.95 alone), ahead of temperature (0.93) and pH (0.92).
- A model that's 99% sure isn't the same as a wound that's 99% infected; how likely and how bad are different questions.
- The most accurate model isn't automatically the best one; speed and size matter on a device.
- An AI that knows when not to trust the data is worth as much as an accurate model.
What's next
- Fabricate the board, then measure the real light and ultrasound intensity at the wound.
- Collect real patch data and retrain the model.
- Add a wound-fluid glucose sensor and the 1.5 MHz healing transducer to the next board.
- Work with clinicians to validate the dosing settings.
Honest limits
- The model is trained on simulated data, and the doses are prototype settings from the literature, not a validated medical protocol.
- The board is designed and autorouted but not yet fabricated, and the firmware has run only on a simulated board.
- Light and ultrasound intensities at the wound are estimates until we measure them.
- The board's ultrasound runs at 30 kHz, within the 20–40 kHz range used by clinical wound devices. The 1.5 MHz healing mode and wound-fluid glucose sensing aren't on this board yet.
- Evidence for combining light and ultrasound comes from lab studies so far.


Log in or sign up for Devpost to join the conversation.