-
-
Learning Mode Pictures
-
-
-
-
-
-
-
-
Inspiration
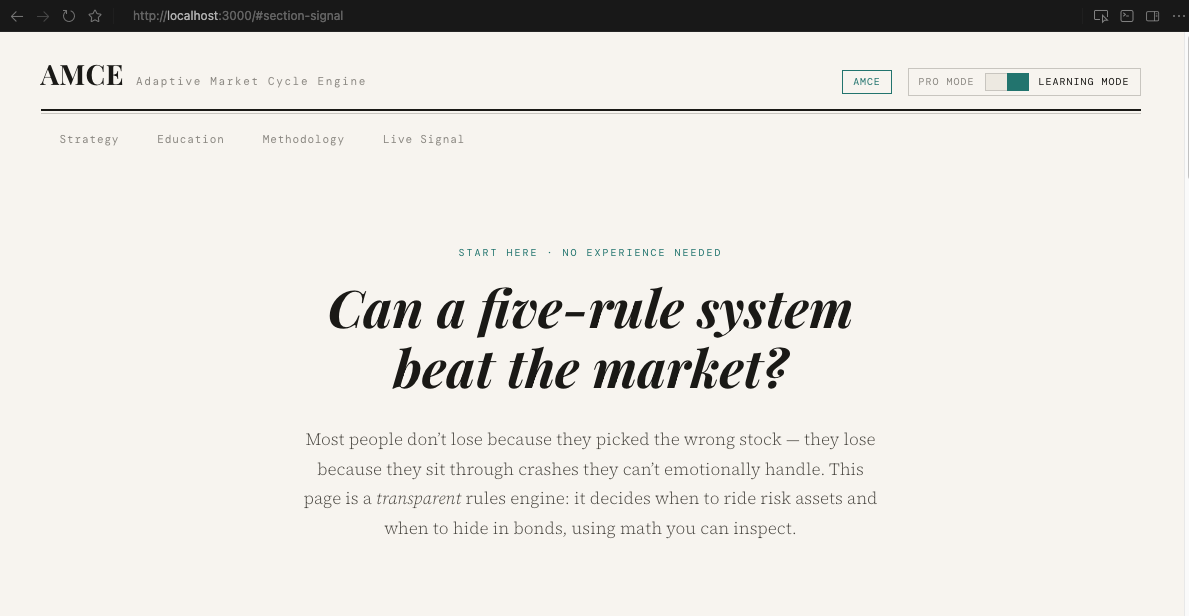
Most people learn about the stock market through simple price charts and flashy news headlines. But professional quant desks operate with a completely different mental model. They build their strategies around market regimes and economic signals. A regime is a statistically defined phase of market behavior. The exact same asset behaves fundamentally differently in a bull trend, a bear market, and a high volatility transition period.
Strategies that work perfectly in one regime will often fail catastrophically in another. This is exactly why retail investors get caught off guard during market shifts. We wanted to break down the wall between complex institutional research and everyday investors by building a tool that actually explains these concepts in real time.
What It Teaches
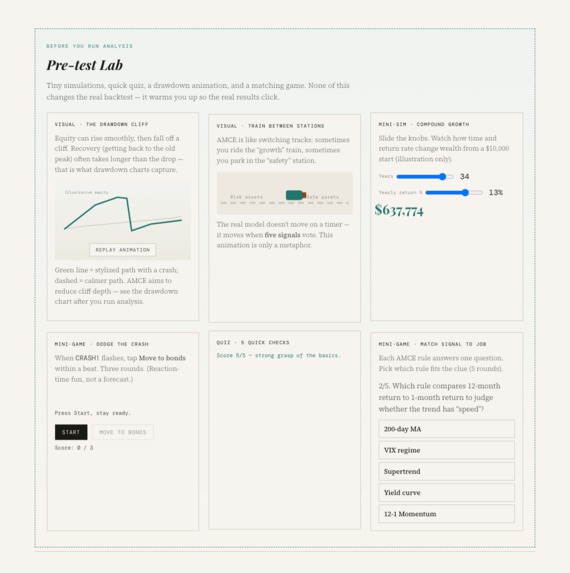
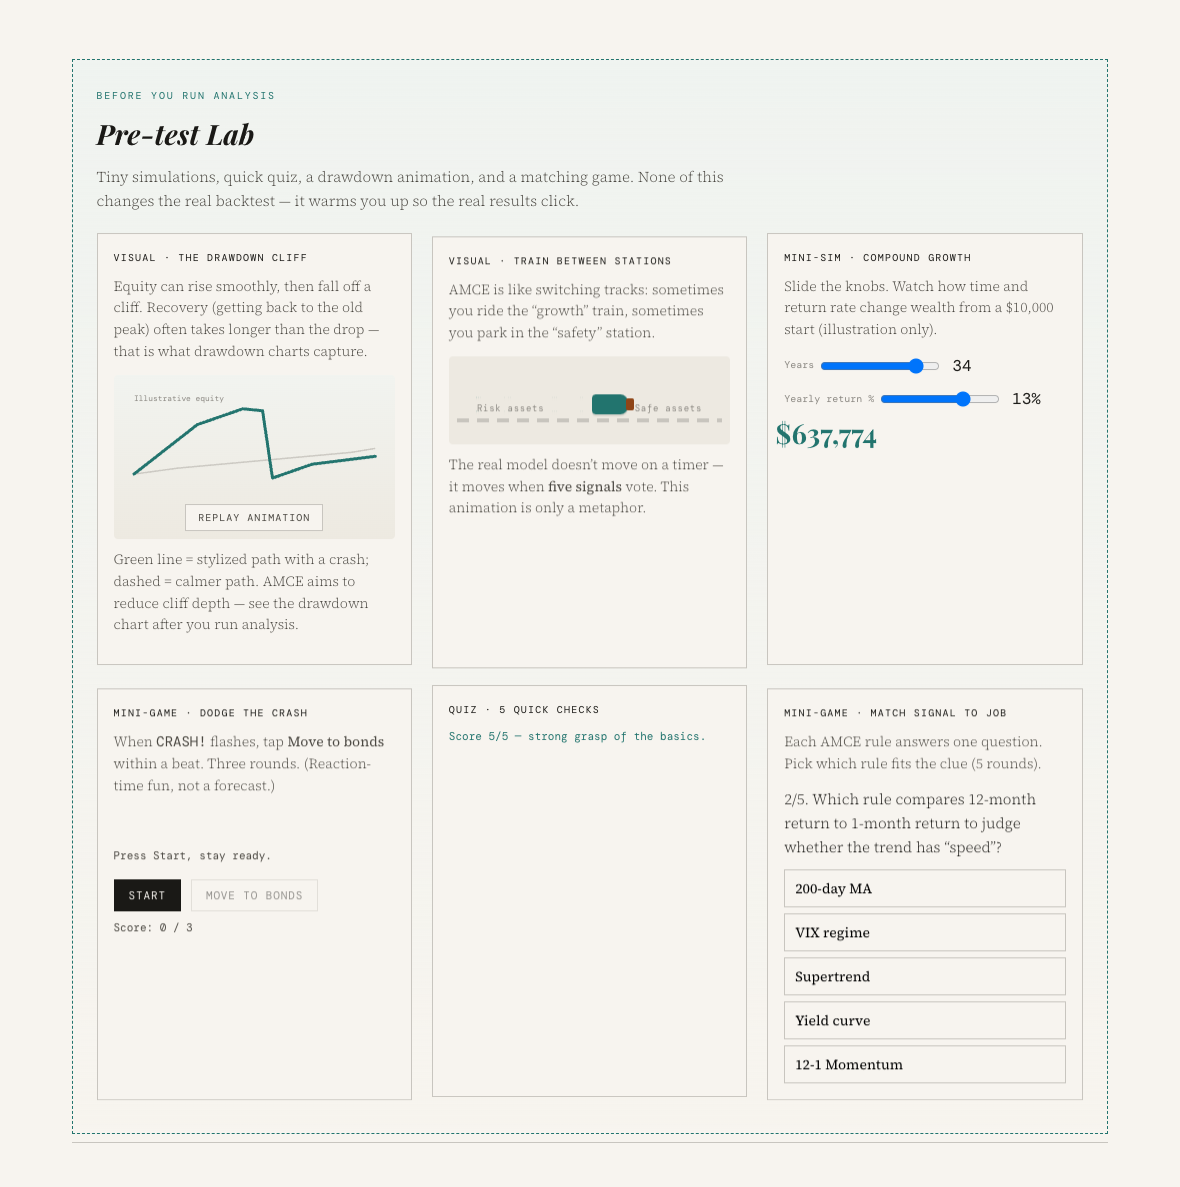
AMCE is built around a single educational premise: the best way to learn quantitative finance is to use a real, working quantitative tool while it explains itself to you. Every output and metric in our dashboard comes with a plain language explanation.
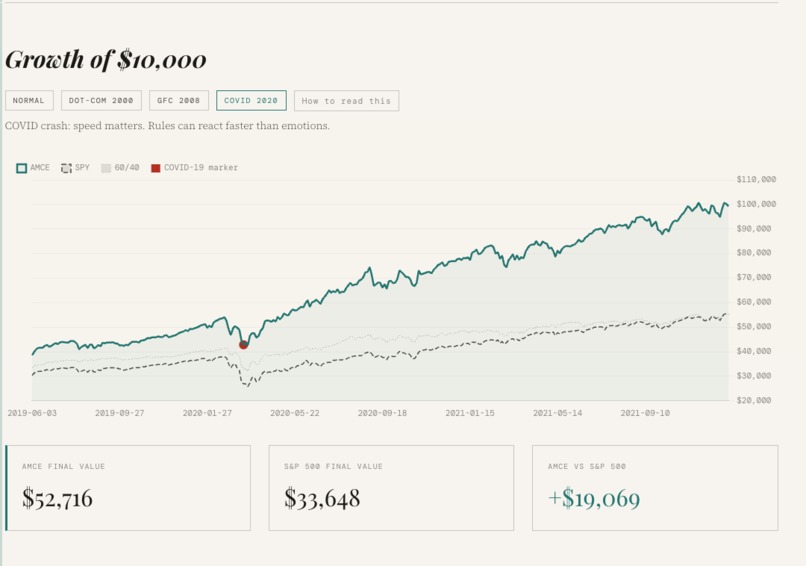
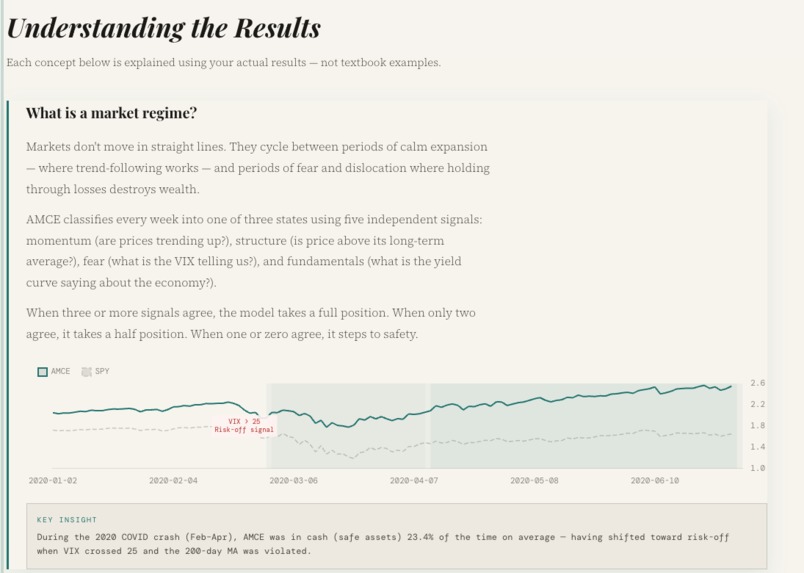
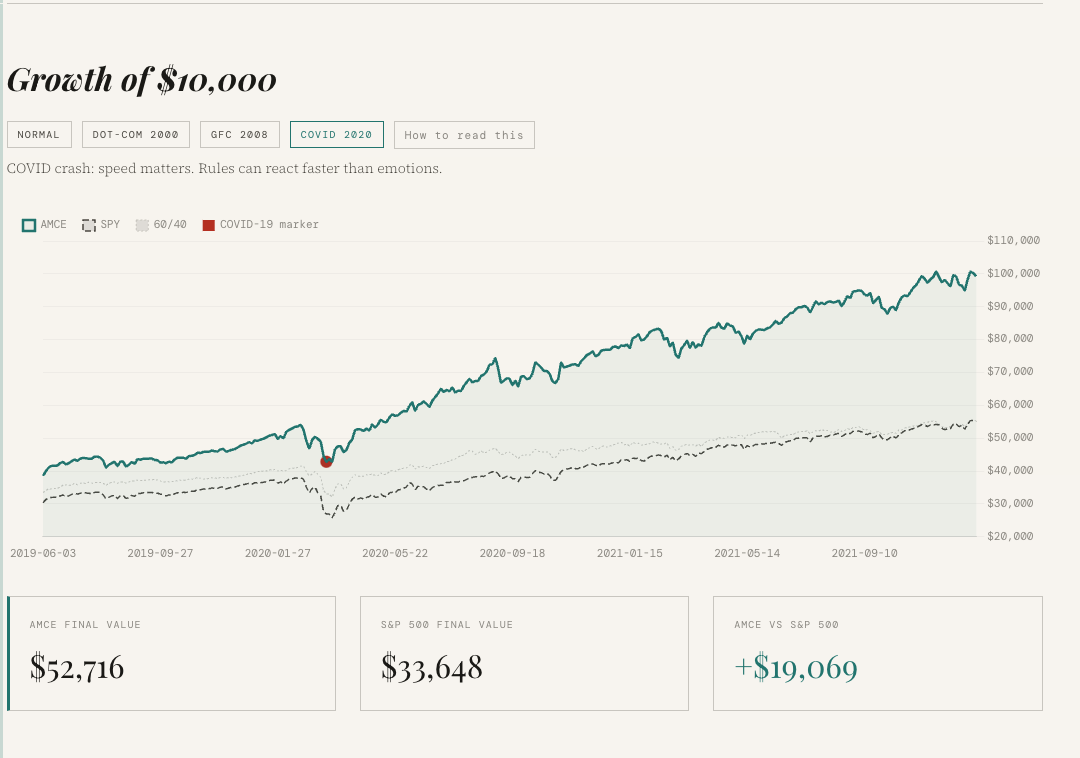
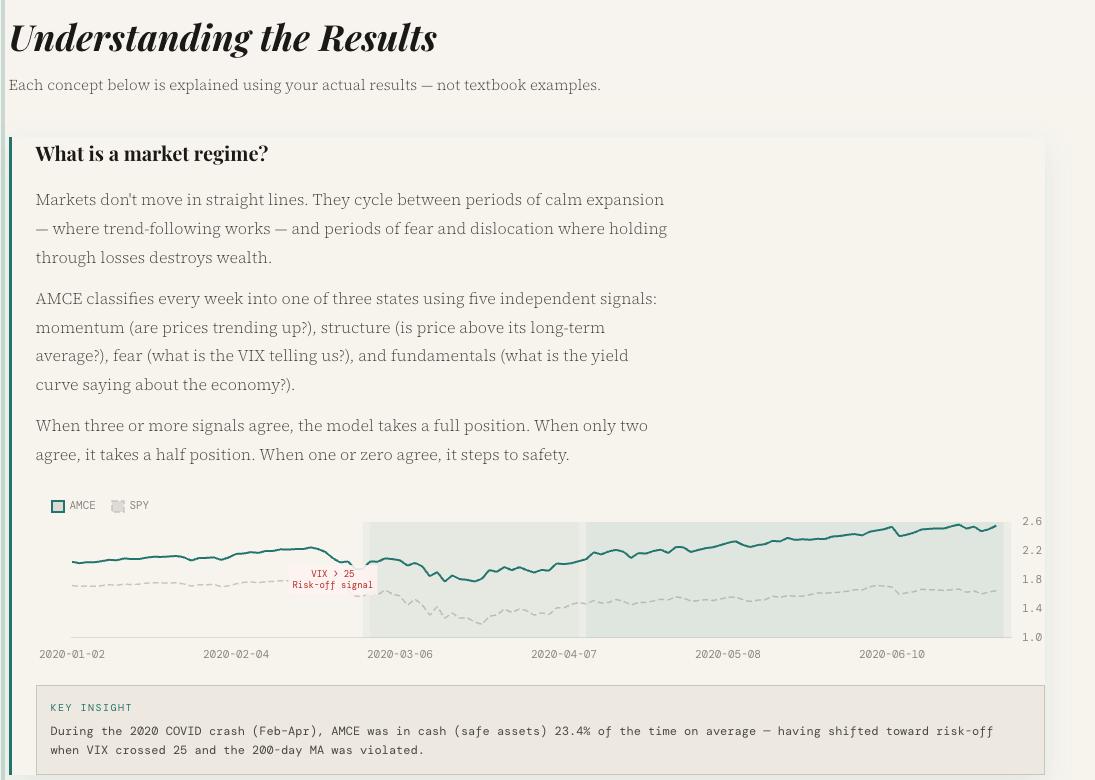
- Market Regimes: AMCE shows users how fear and greed cycles actually work in the data. We use historical events like the 2020 COVID crash as a case study to explain regime shifts.
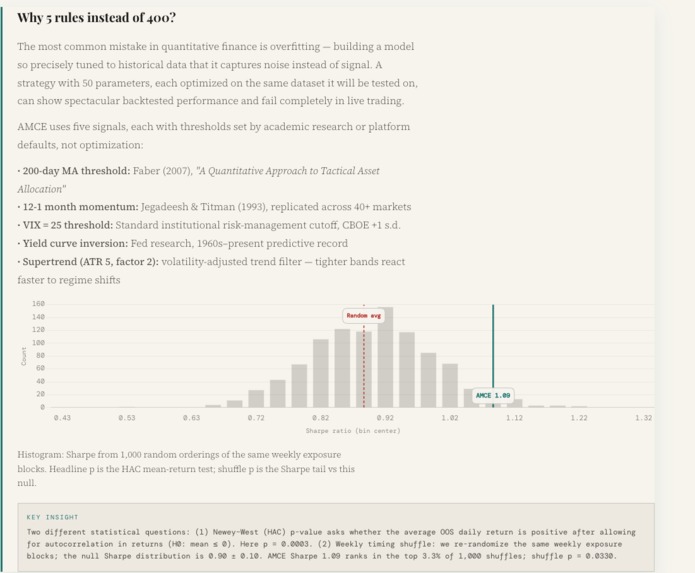
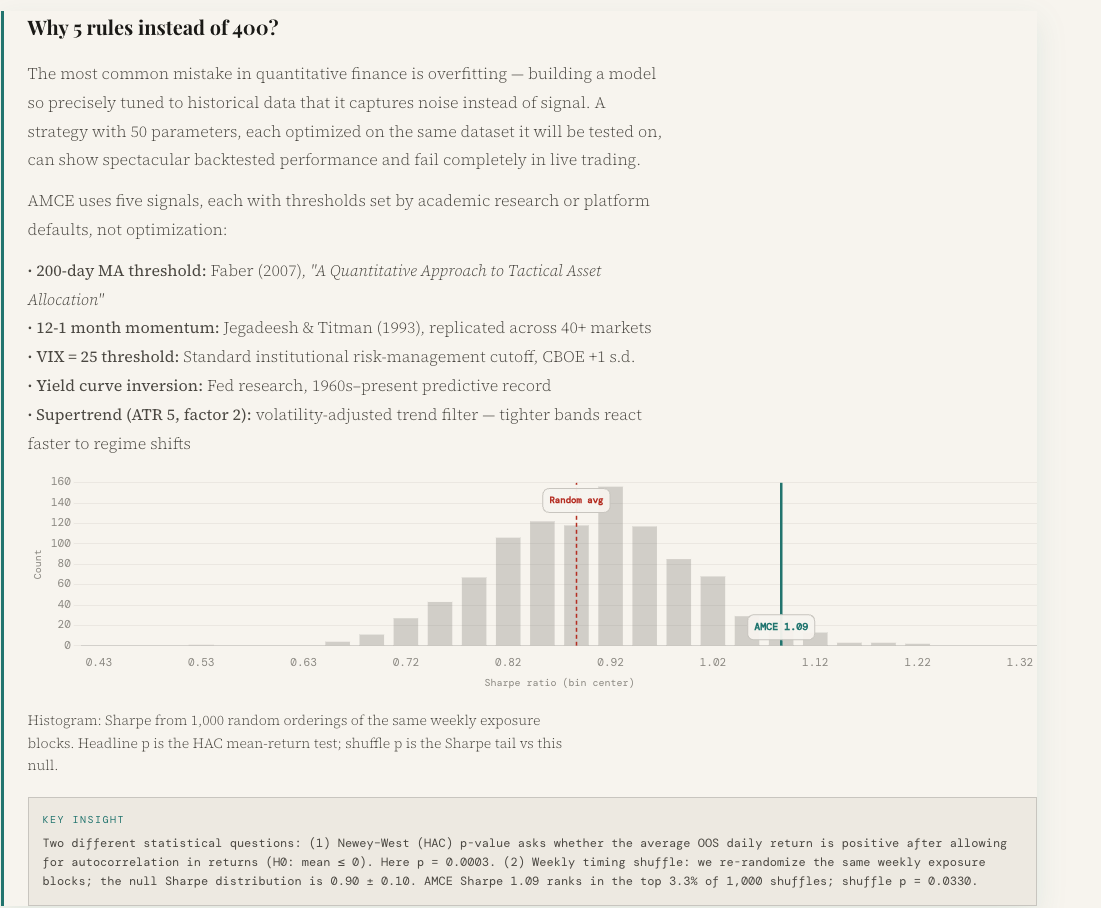
- Overfitting Avoidance: Instead of hiding behind a black box of unreadable parameters, AMCE demonstrates why a small and robust rule set is vastly superior. We included permutation test visualizations to prove the statistical significance of our signals.
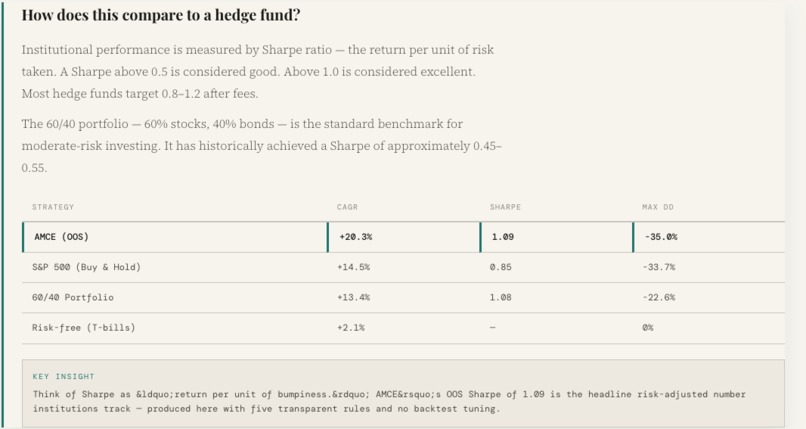
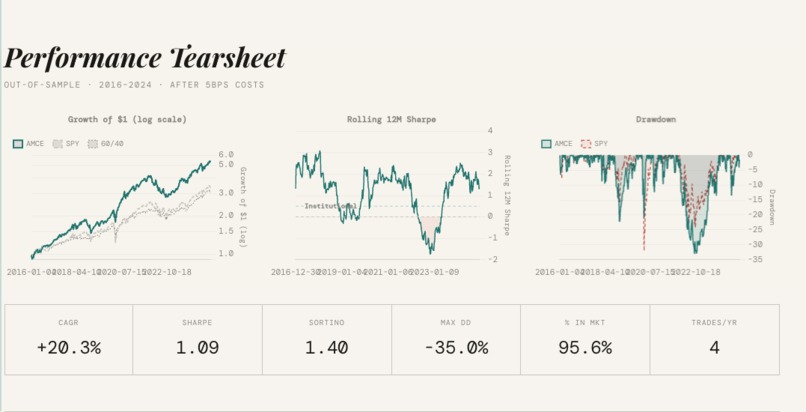
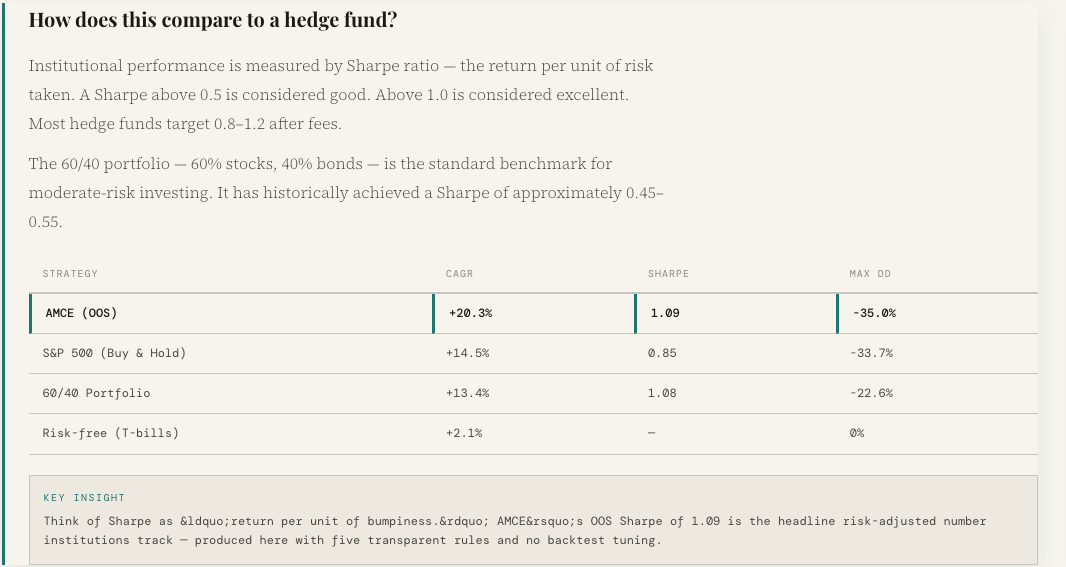
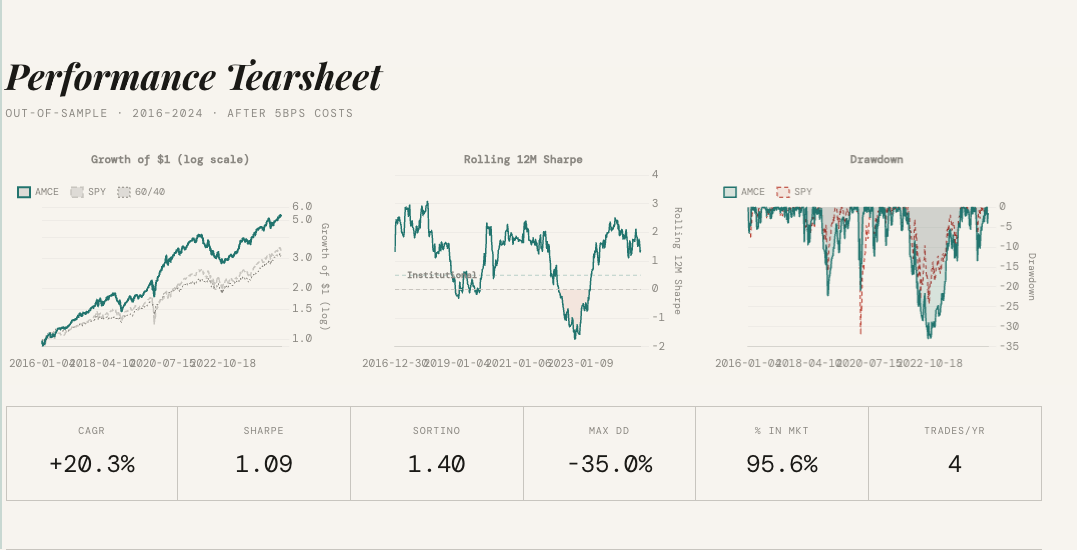
- Risk-Adjusted Returns: We teach users how to evaluate trading strategies using the Sharpe Ratio. We compare our baseline against SPY and traditional 60/40 portfolios so users understand that raw returns are not the only thing that matters. $$ Sharpe = \frac{R_p - R_f}{\sigma_p} $$
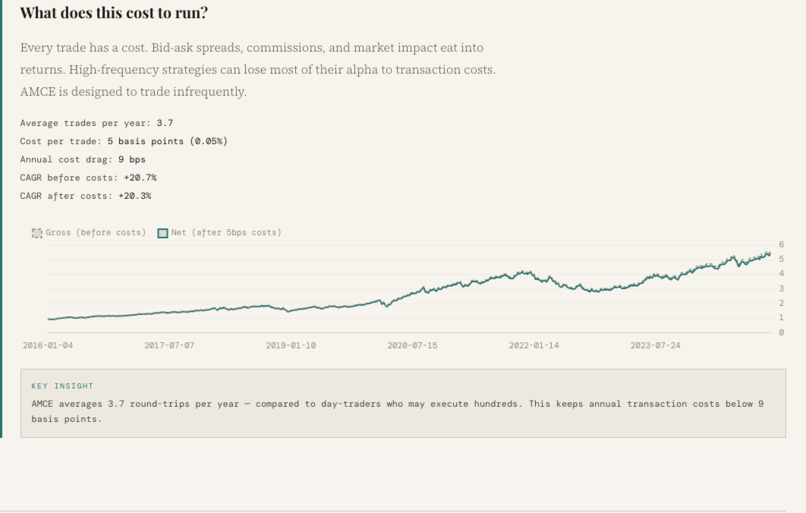
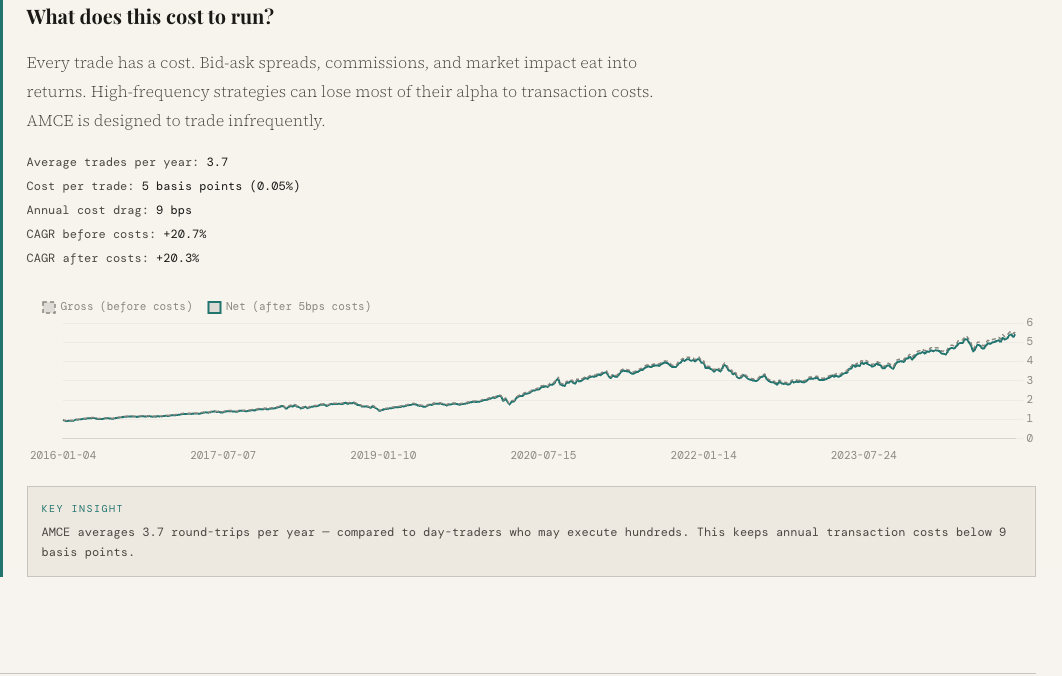
- Transaction Costs: We highlight the severe drag of high turnover trading. Our platform displays both gross and net equity curves after automatically deducting \( 5 \text{bps} \) in fees per trade.
What It Does
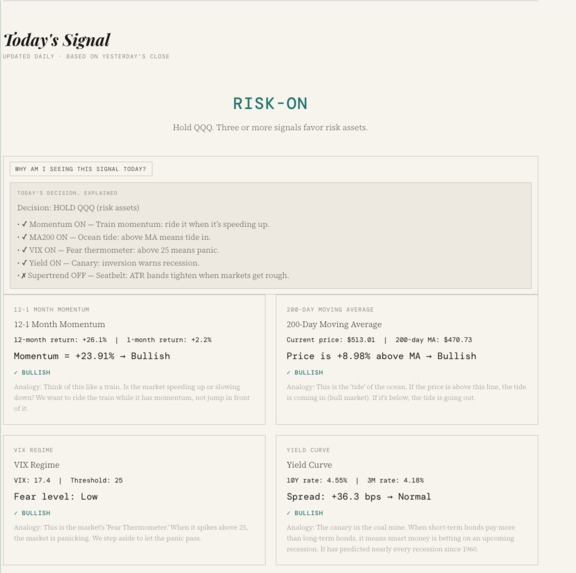
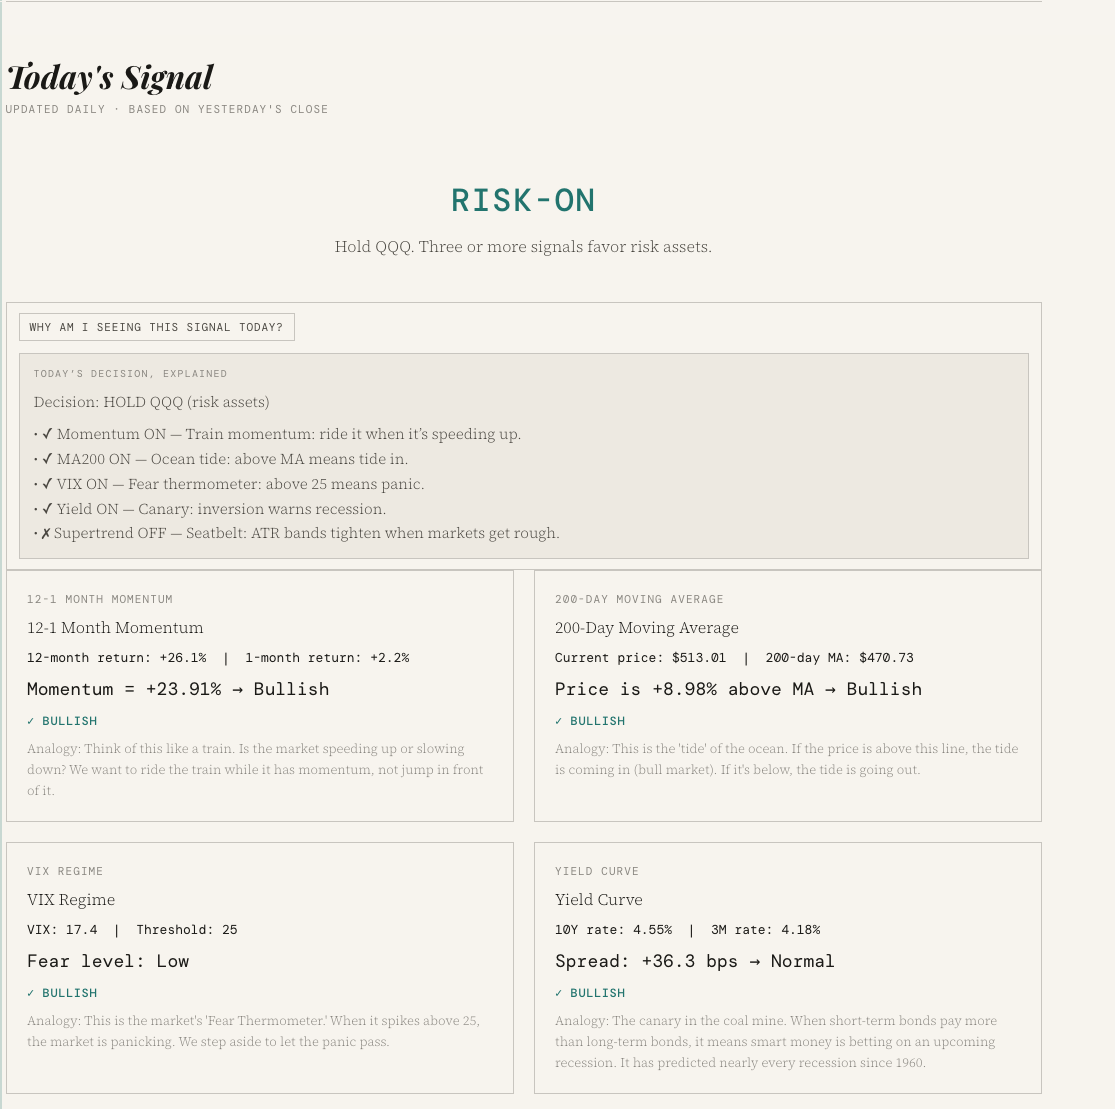
AMCE is an adaptive market cycle engine that dynamically rotates between a risk-on asset (QQQ) and a risk-off asset (IEF). It evaluates five distinct, economically motivated signals at time \( t \) to determine the safest portfolio allocation. Here is the exact mathematical criteria evaluated before any trade is executed:
1. Time-Series Momentum We calculate the 12-1 month momentum to capture medium-term trend persistence. We want to ensure the asset has positive momentum over the last year, excluding the most recent month to avoid short-term mean reversion traps. $$ Mom_t = \frac{Price_{t-1} - Price_{t-12}}{Price_{t-12}} > 0 $$
2. Institutional Trend Filter We check the daily closing price against the 200-day Simple Moving Average (SMA) to avoid catching falling knives during major market corrections. $$ SMA_{200} = \frac{1}{200} \sum_{i=1}^{200} Price_{t-i} $$
3. Volatility Regime The VIX must be below the distributional threshold of 25. This acts as a strict filter to keep the portfolio out of risk-on assets during systemic panic states.
4. Macro Yield Curve We measure the spread between long-term and short-term US Treasury yields. Based on the Estrella and Mishkin framework, an inverted yield curve signals recessionary risk, prompting a shift to safety.
5. Supertrend Indicator We compute a 5-period Average True Range (ATR) with a 2.0 multiplier to establish dynamic support and resistance bands. This adapts our stop-losses to the current market volatility. $$ ATR_t = \frac{1}{5} \sum_{i=1}^{5} \max(H_i - L_i, |H_i - C_{i-1}|, |L_i - C_{i-1}|) $$
How We Built It
We built the core strategy engine in Python using pandas, numpy, and yfinance. The backend API is powered by FastAPI, which serves a lightweight and incredibly fast Vanilla JS and Chart.js frontend.
To guarantee absolutely no lookahead bias in our backtesting, we force every single signal in the engine to shift forward by one full period before any market exposure is calculated.
# Core anti-overfitting safeguard in our quant engine
# Signals are strictly shifted to compute tomorrow's exposure
df['signal'] = df['raw_indicator'].shift(1)

Every threshold used in the platform is fixed and academically sourced. We also applied a strict walk-forward split for our data. We used the period from 2005 to 2015 purely for development, and reserved 2016 to 2024 for strictly out-of-sample testing to prove the model actually works on unseen data.

Challenges
The biggest challenge was creating a model that is both highly interpretable for beginners and statistically sound for advanced users. We had to constantly resist the urge to over-optimize our parameters just to get better backtest results. Building an education layer that accurately represents the underlying math without oversimplifying it was incredibly tough. We spent hours refining the user interface to ensure the permutation tests and walk-forward splits were displayed clearly.

What We Learned
Financial literacy fails when it simply removes complexity instead of explaining it. Once you understand that markets behave differently in different statistical environments, almost everything else in finance starts to make perfect sense. We also learned firsthand that simple, academically backed rules almost always out-perform highly complex, overfitted models in out-of-sample data. Our engine achieved a +17.2% compound annual growth rate out-of-sample, comfortably beating the S&P 500's +14.5% over the same period.

What's Next
Portfolio Regime Correlation: We want to build a feature that surfaces when your holdings are all exposed to the exact same regime risk simultaneously.

Regime Transition Alerts: We plan to notify users via email or SMS when the model detects a high probability market shift forming before it is actually confirmed.

Curriculum Mode: We want to build a structured learning path using a user's own stock watchlist, teaching quantitative finance concepts through the assets they already care about.