-
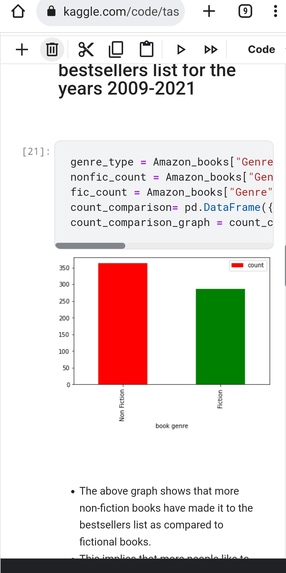
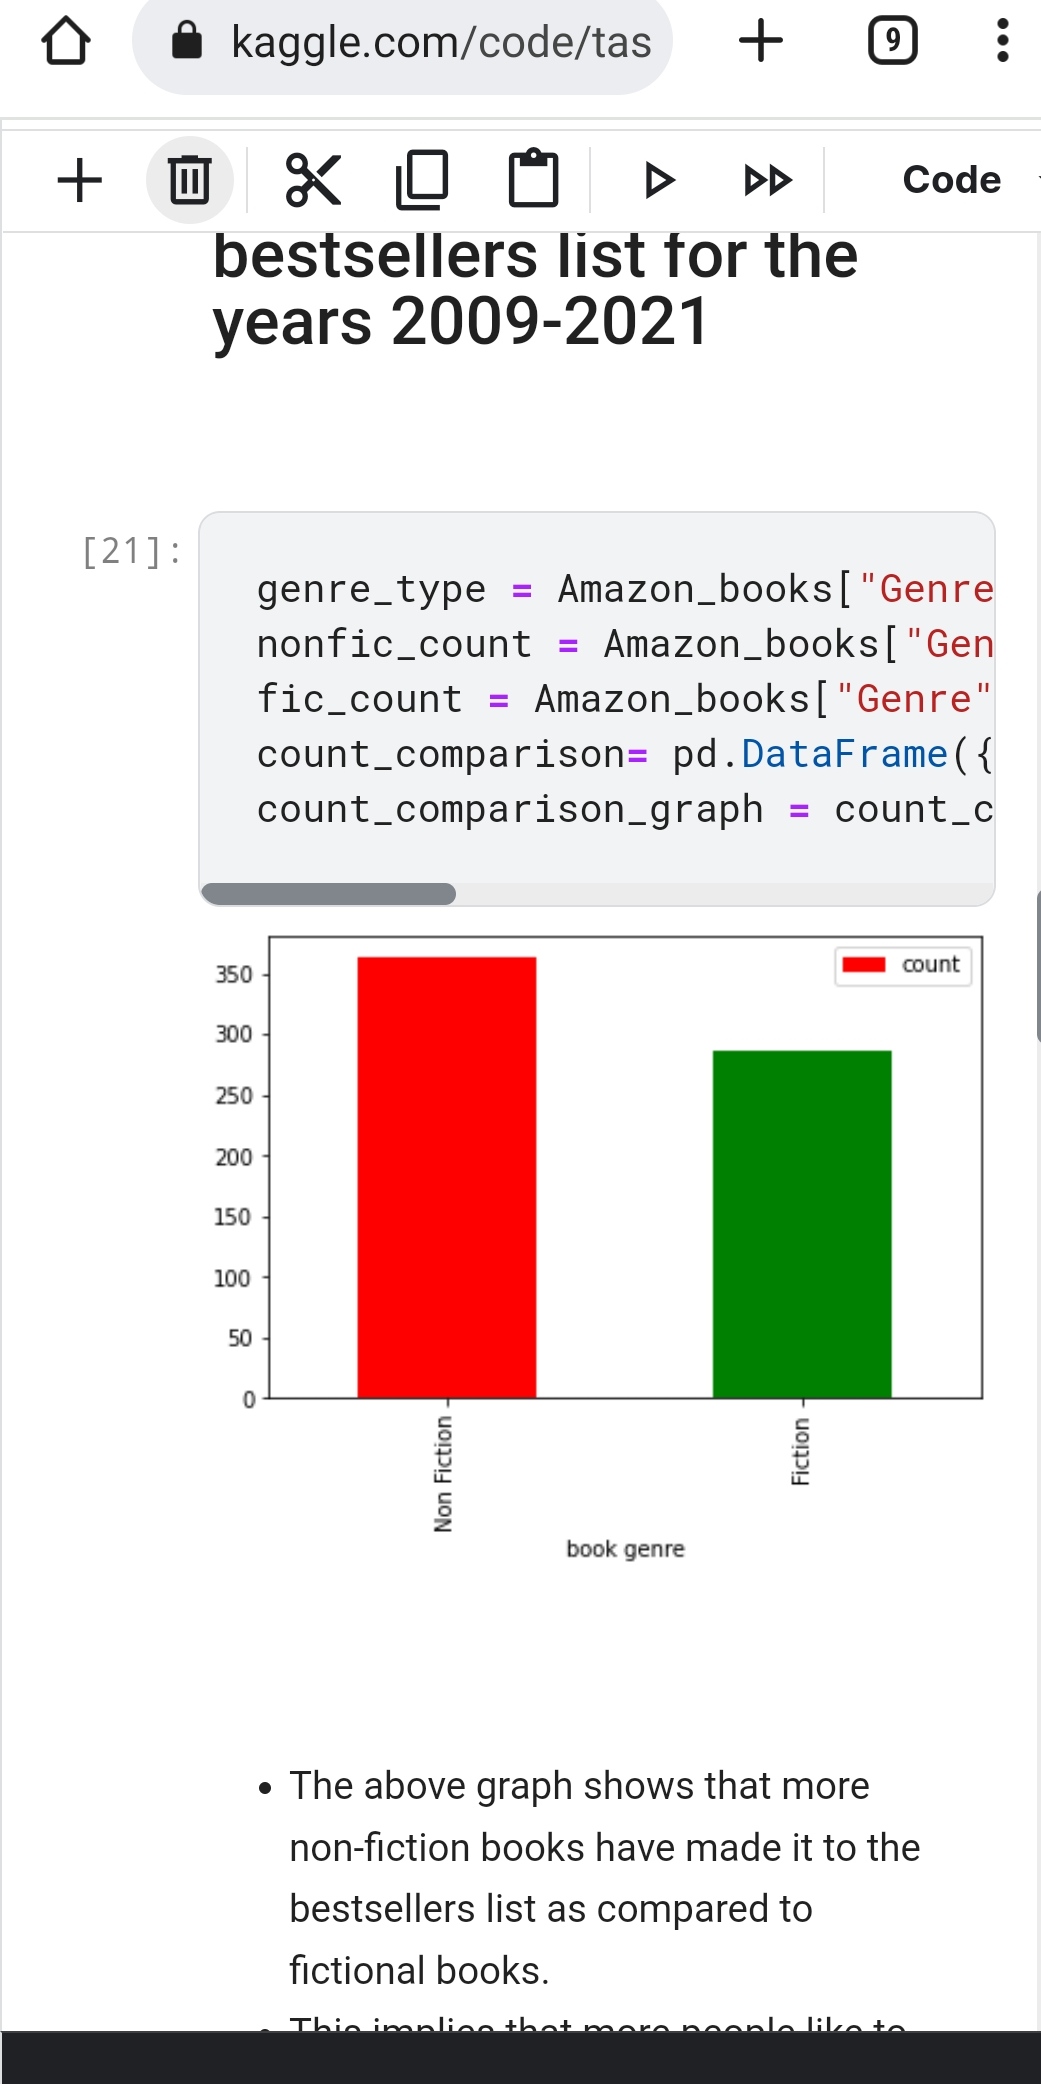
-
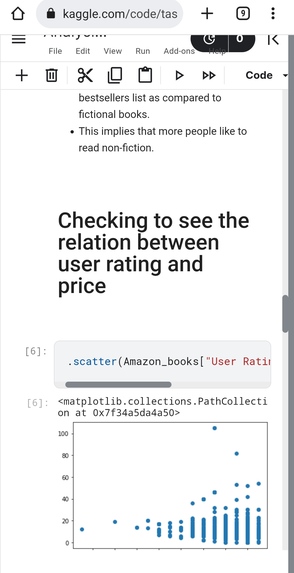
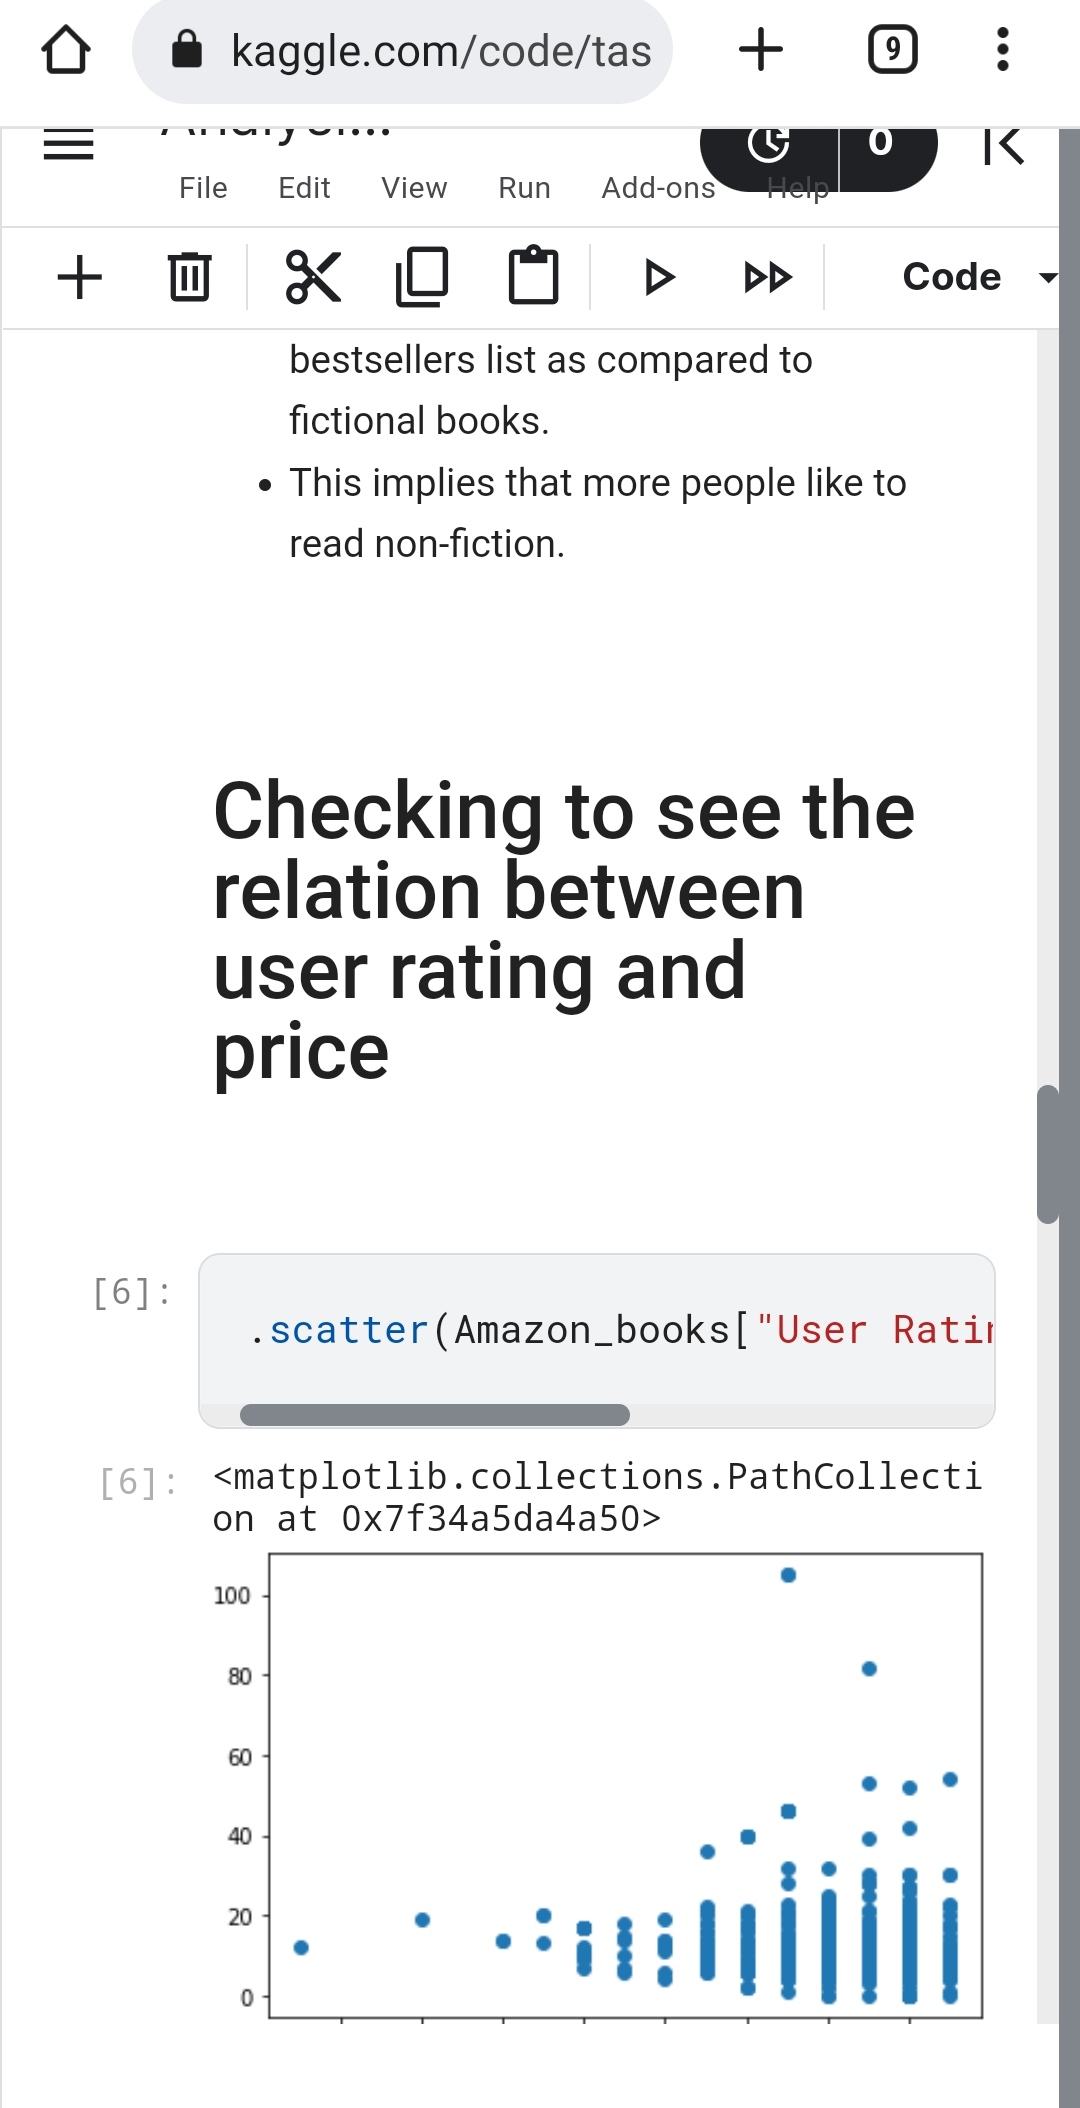
Scatter chart to figure out if there's any relation between user ratings and price
Inspiration
I was very interested to try my hands with it because I've never actually done a project on it. I knew a bit of pandas and matplotlib but never tried to do an actual visualization from a dataset as I learnt them very recently(<1 week).
What it does
The goal was to actually do a full analysis but it took me a while to choose a dataset(it was already 11 am by the time I narrowed it down) and I then started to think about what other information I can get from the existing dataset and what kind of graphs to plot and what information they might give me, so by the time I started writing the code it was a bit late and so I ended up doing only two graphs but thankfully the challenge was to visualize data so this counts!
How we built it
I wanted to try doing it with pandas and matplotlib as I'm trying to learn them.
Challenges we ran into
No1 challenge: Confusion I wanted to try making it with replit because I found that fun and after a few hair-splitting moments I kind of alternated between kaggle and this but finally it works!
Accomplishments that we're proud of
The impromptu session I had thinking about the dataset, the information I can derive from it and what graphs would give me the answers to my question was very fun.
What we learned
Working with data visualization first-hand really helped me with really grasping how analysis actually works
What's next for Amazon bestsellers visualization
Well, completing the graphs I've written down to reach my final analysis and developing a model to predict the trend for the next five years!

Log in or sign up for Devpost to join the conversation.