Inspiration
Floods are among the deadliest and most frequent climate disasters, and they hit vulnerable people/communities the hardest. What struck us is that the warning signs often already exist in data: satellite data on heavy rainfall, saturated soil, rising water, dam surveys. That data is scattered across agencies, formats and private systems, so it rarely comes together in time. We wanted to change that. Amalga supports UN SDG 11 (resilient communities) and SDG 13 (climate action), and extensively uses satellite data from NASA!
What it does
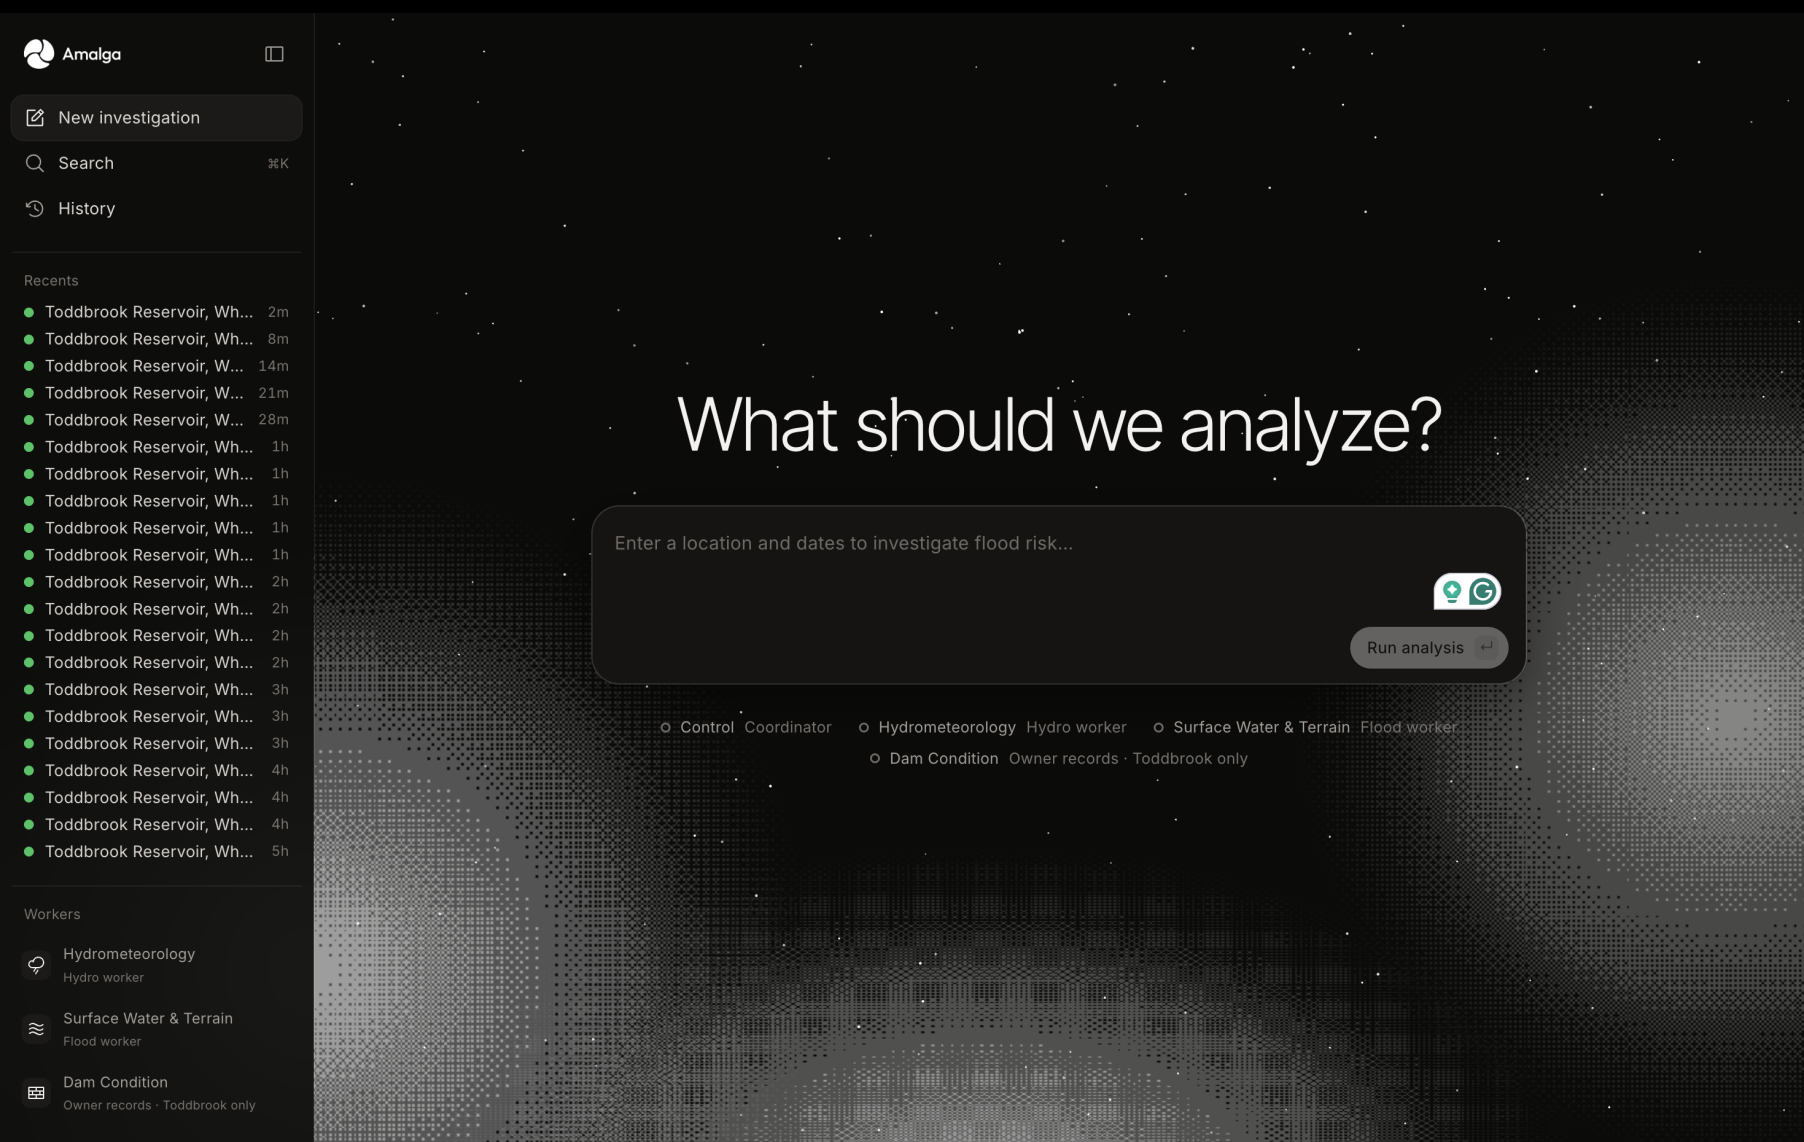
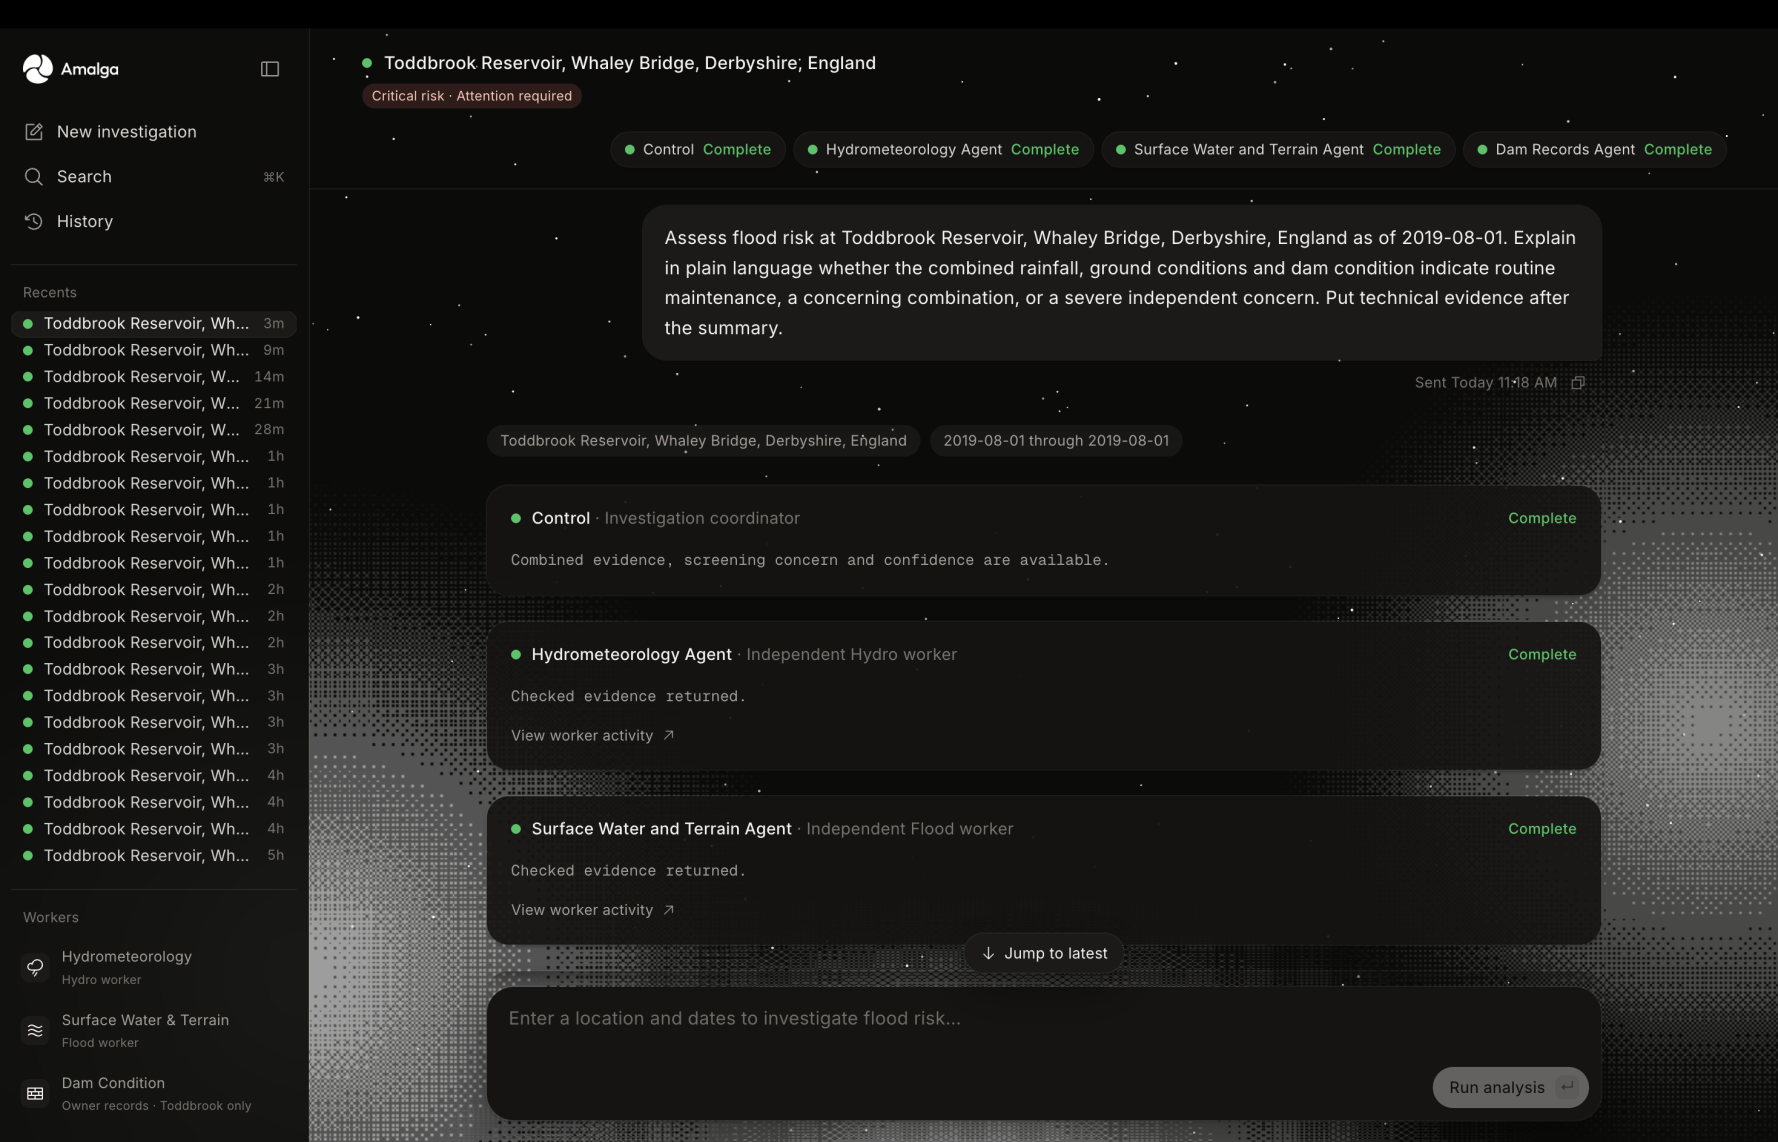
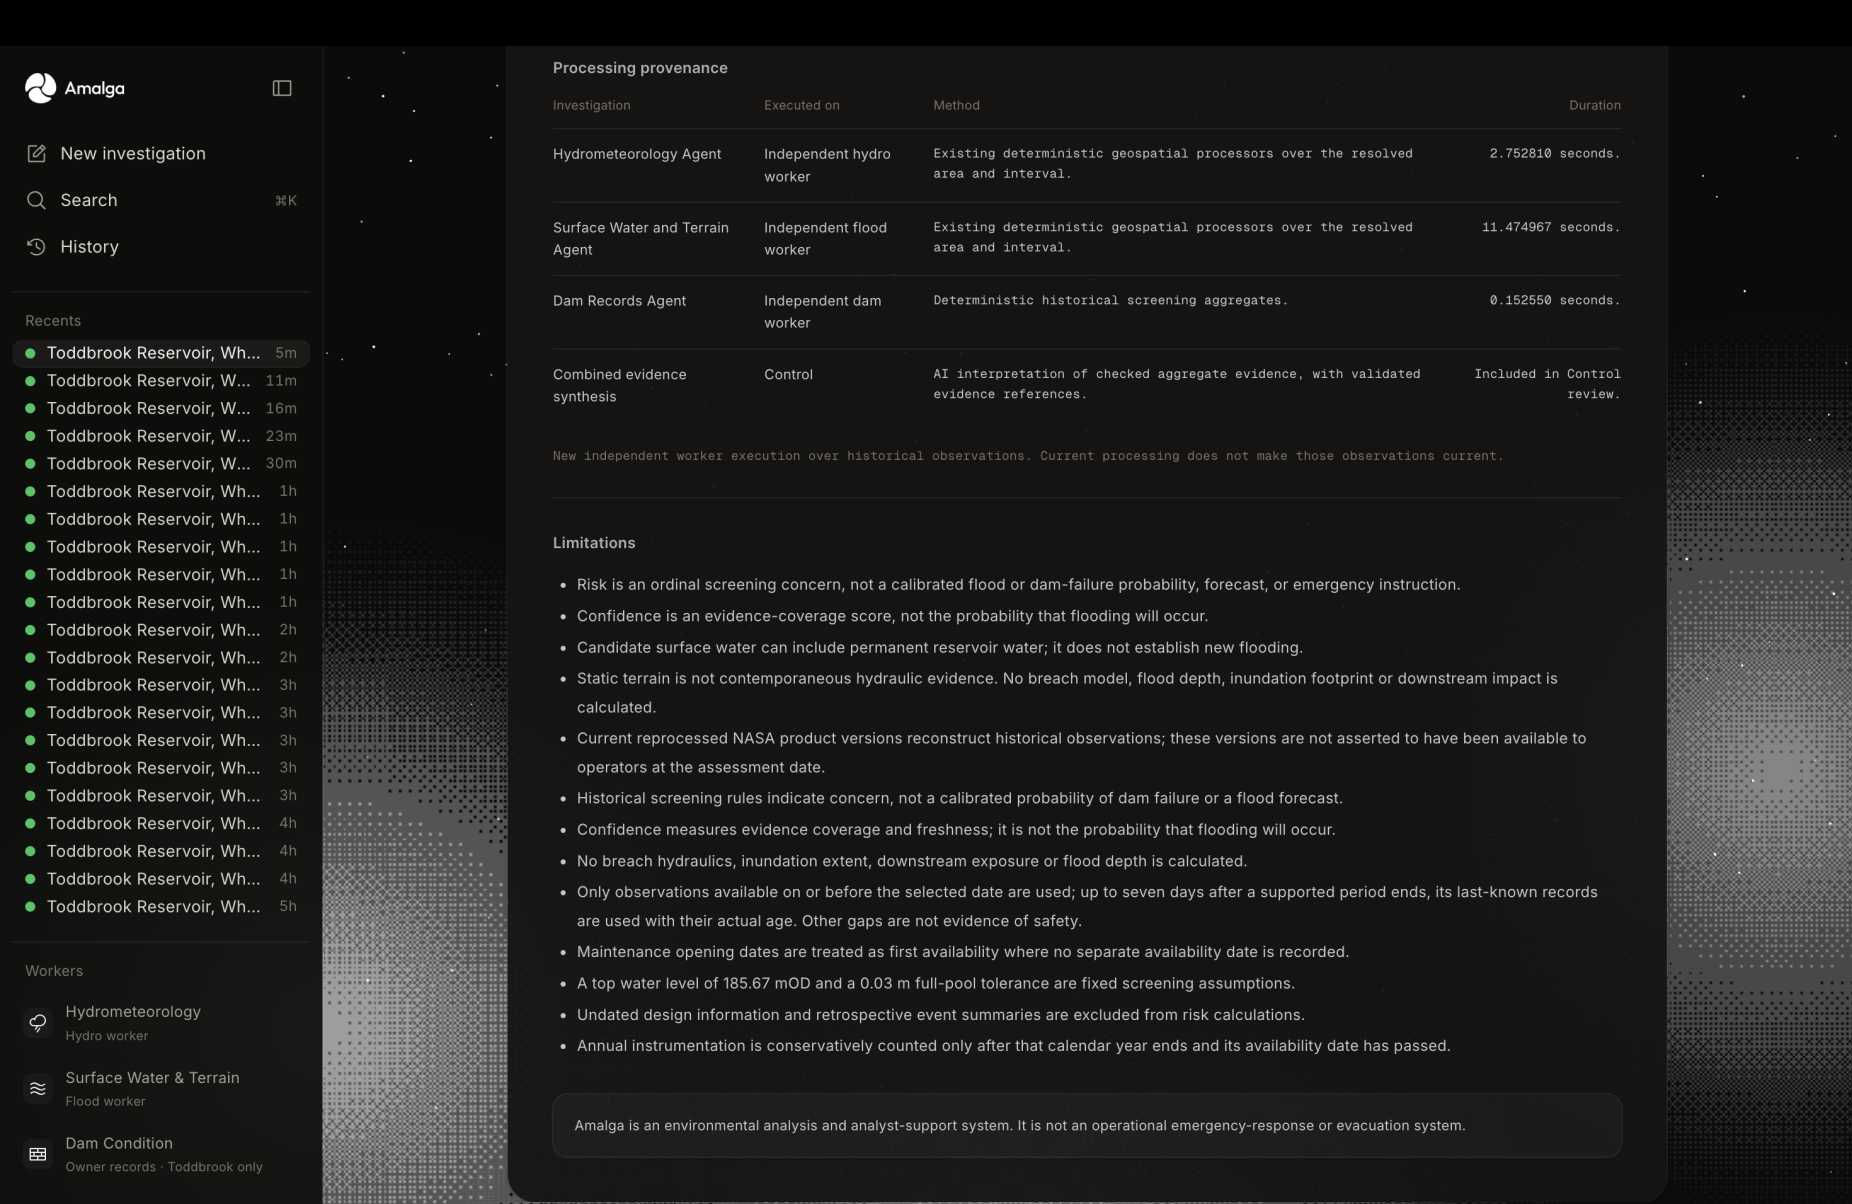
Once you ask Amalga a question in plain language about a place and a date, the lead AI coordinator (agent) sends a team of specialist agents to investigate at the same time:
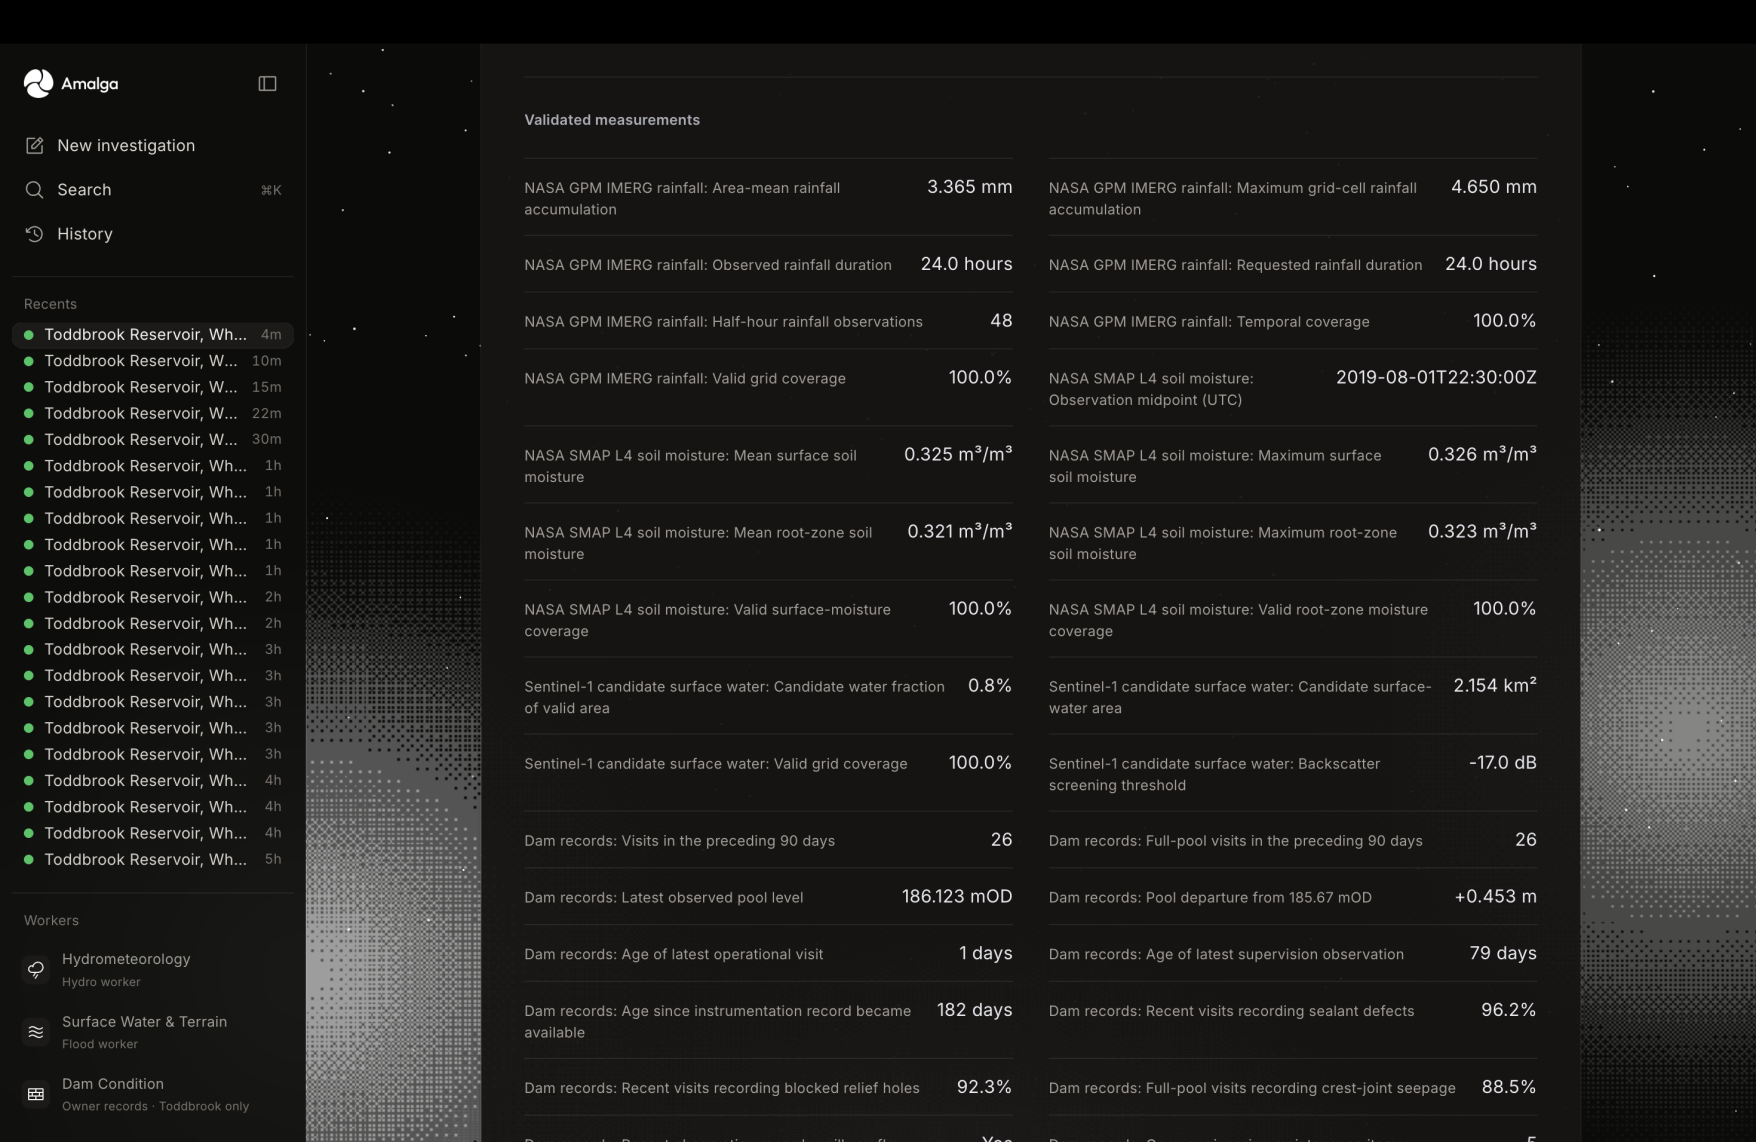
- Hydro checks rainfall and soil moisture/saturation from NASA satellites.
- Flood checks satellite radar and terrain for signs of surface water.
- Dam surveys and private reservoir records within the network they're stored on (a private agent that can consider all their private data to draw conclusions, but limit data sent to the coordinator).
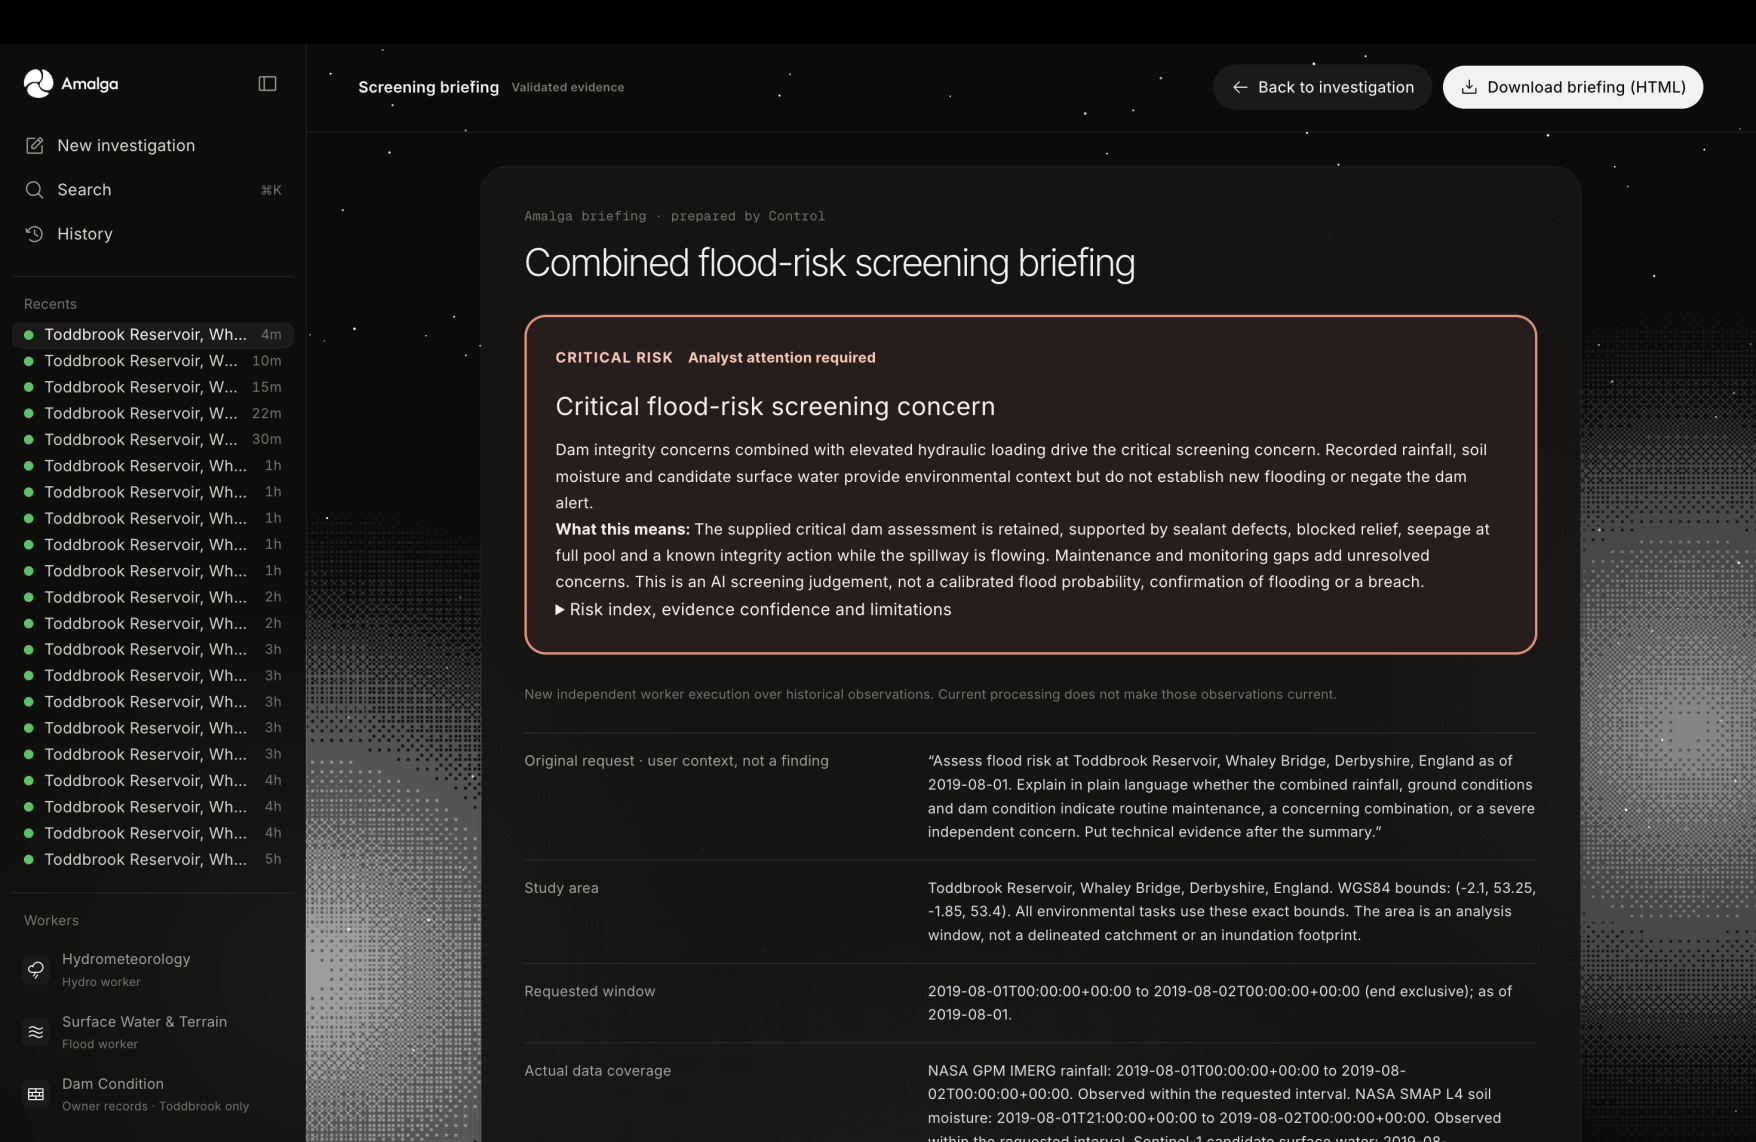
Amalga brings their findings together into a clear risk briefing with informative findings about the aggregated databases, a downloadable report, and urgent notifiers, without needing to share the raw data.
How we built it
- AI Agents: Each specialist is its own Python (FastAPI) service that can run on a separate machine. A coordinator sends them work in parallel and checks every result.
- Data: We process real NASA (GPM IMERG, SMAP) and Copernicus satellite data with NumPy, Rasterio and h5py.
- AI: OpenAI agents understands the question and explains the results, but every number comes from the data, not the AI.
- Interface: Next.js, React and Tailwind CSS with component libraries, so you can watch each agent work live.
Bonus! Full information for Satellite nerds!
Hydrometeorology agent:
- GPM constellation (NASA/JAXA; queried through earthaccess, read with h5py): half-hourly rainfall rate from the IMERG product. We derive accumulated rainfall over the window from those rates.
- SMAP (NASA; queried through earthaccess, read with h5py): surface and root-zone soil moisture from the L4 product. Root-zone is model-derived by NASA from SMAP's surface readings.
Surface water & terrain agent:
- Sentinel-1 (ESA; queried through pystac-client and planetary-computer, read with rasterio): terrain-corrected radar backscatter. We derive candidate water pixels by thresholding at −17 dB.
- TanDEM-X / TerraSAR-X (DLR/Airbus, published as Copernicus DEM GLO-30; queried through pystac-client, read with rasterio): 30 m ground elevation.
- HAND (Alaska Satellite Facility; queried through pystac-client, read with rasterio): height above nearest drainage. This is derived from the Copernicus DEM data.
Challenges we ran into
- Authorizing custom applications like NASA GESDISC DATA ARCHIVE and NSIDC Cumulus Data for the project and making it work seamlessly with our agents.
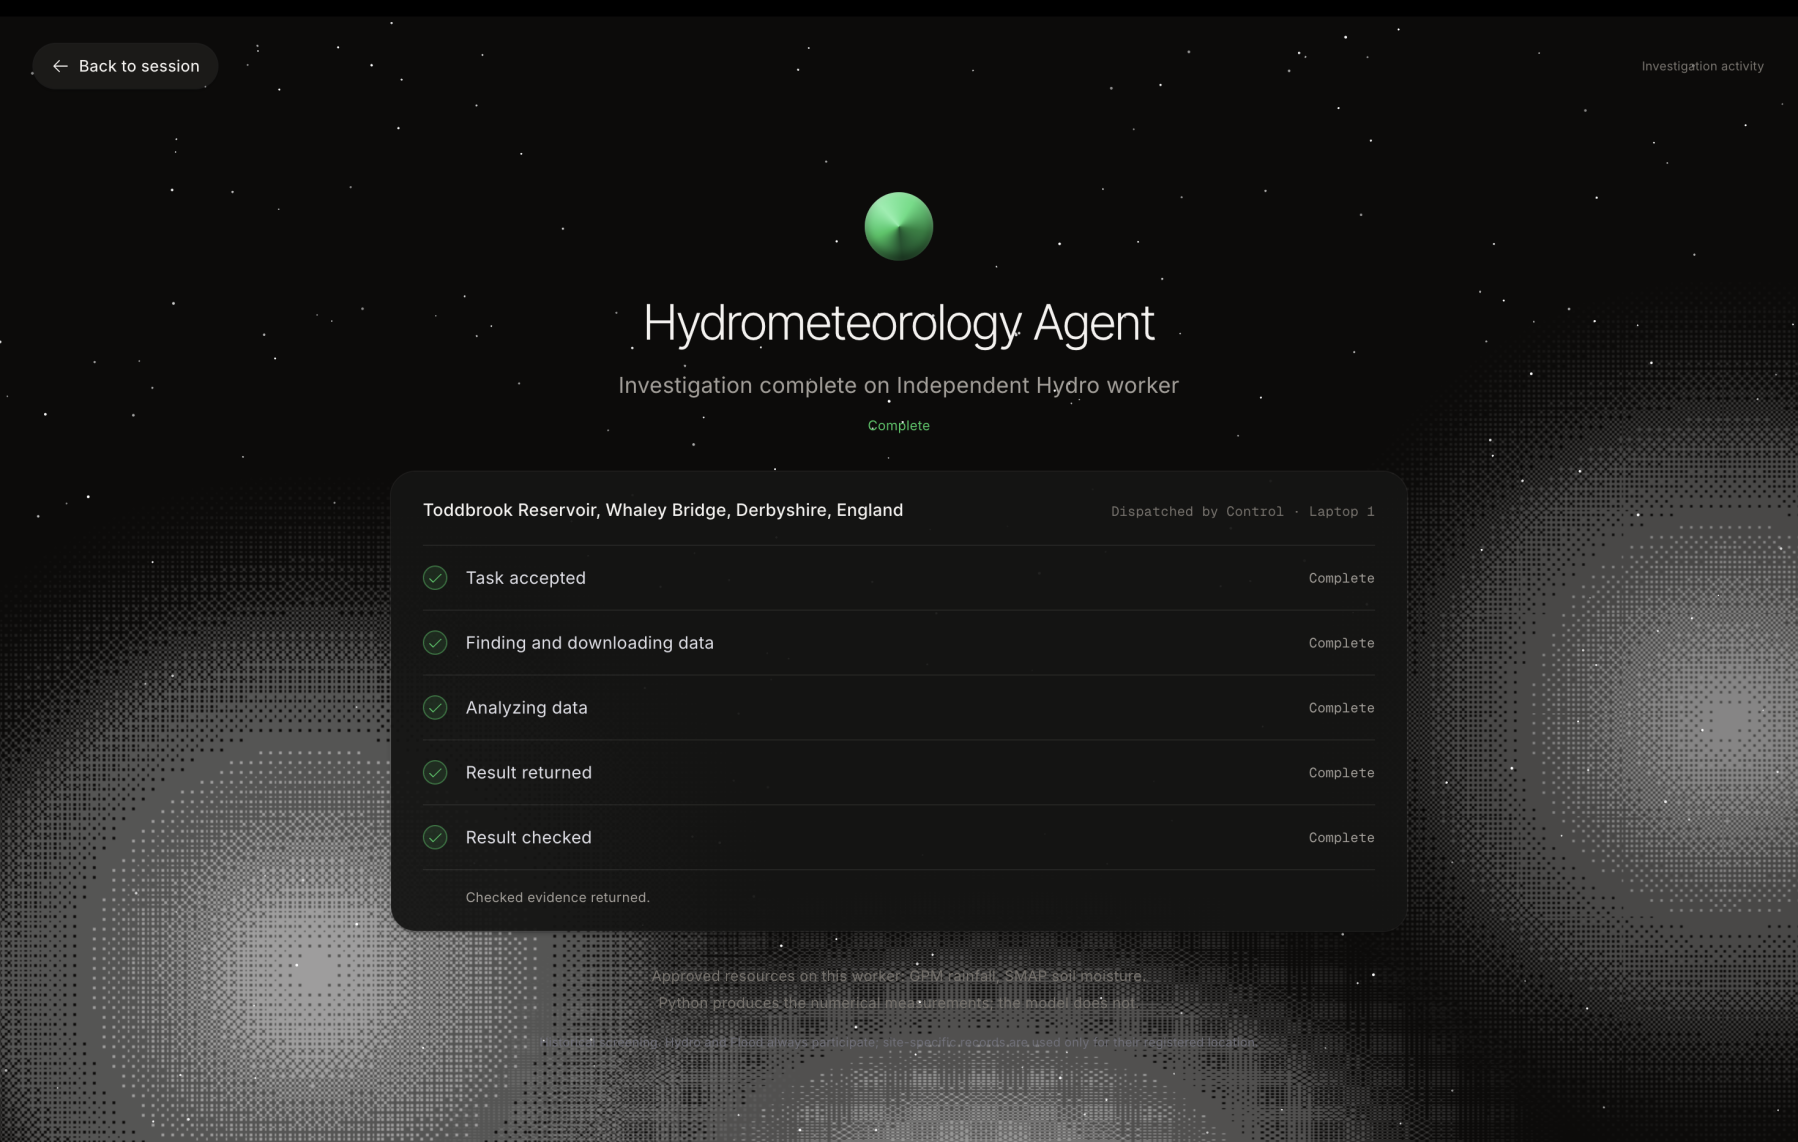
- Making sure each agent accurately tracked progress and communicated with the coordinator.
- Connecting the frontend UI to work correctly with the agents.
Accomplishments that we're proud of
- We created a distributed system where our agents ran on separate servers (laptops), took orders from one coordinator over a live network simultaneously, and each showed its progress live on its own screen.
- Every agent is independent. If one goes down, the others keep working and the briefing reports exactly what's missing.
- The AI explains the evidence but doesn't make up numbers. Figures comes from real data.
What we learned
- Learned how to created a distributed multi-agent system that could still continue processing the task even if an agent falls.
- Learned how to find, download and combine real satellite data. Rainfall, soil moisture, radar and terrain each come in their own format, timing and resolution.
What's next for Amalga
- Better data privacy features and partner with real government and environment organizations.
- Add a feature that sends early alerts to emergency teams before risk becomes critical.
- Make reports more visual with charts and maps, and give the AI richer context like past flood events so its explanations are even more useful.
Built With
- fastapi
- h5py
- httpx
- motion
- next.js
- numpy
- openai-api
- pydantic
- python
- radix-ui
- rasterio
- react
- shadcn/ui
- tailwindcss
- typescript
- uvicorn

Log in or sign up for Devpost to join the conversation.