Inspiration
Financial markets produce more information than most people can meaningfully interpret. Prices, political headlines, interest rates and risk indicators often appear on separate screens, leaving users to connect the story themselves.
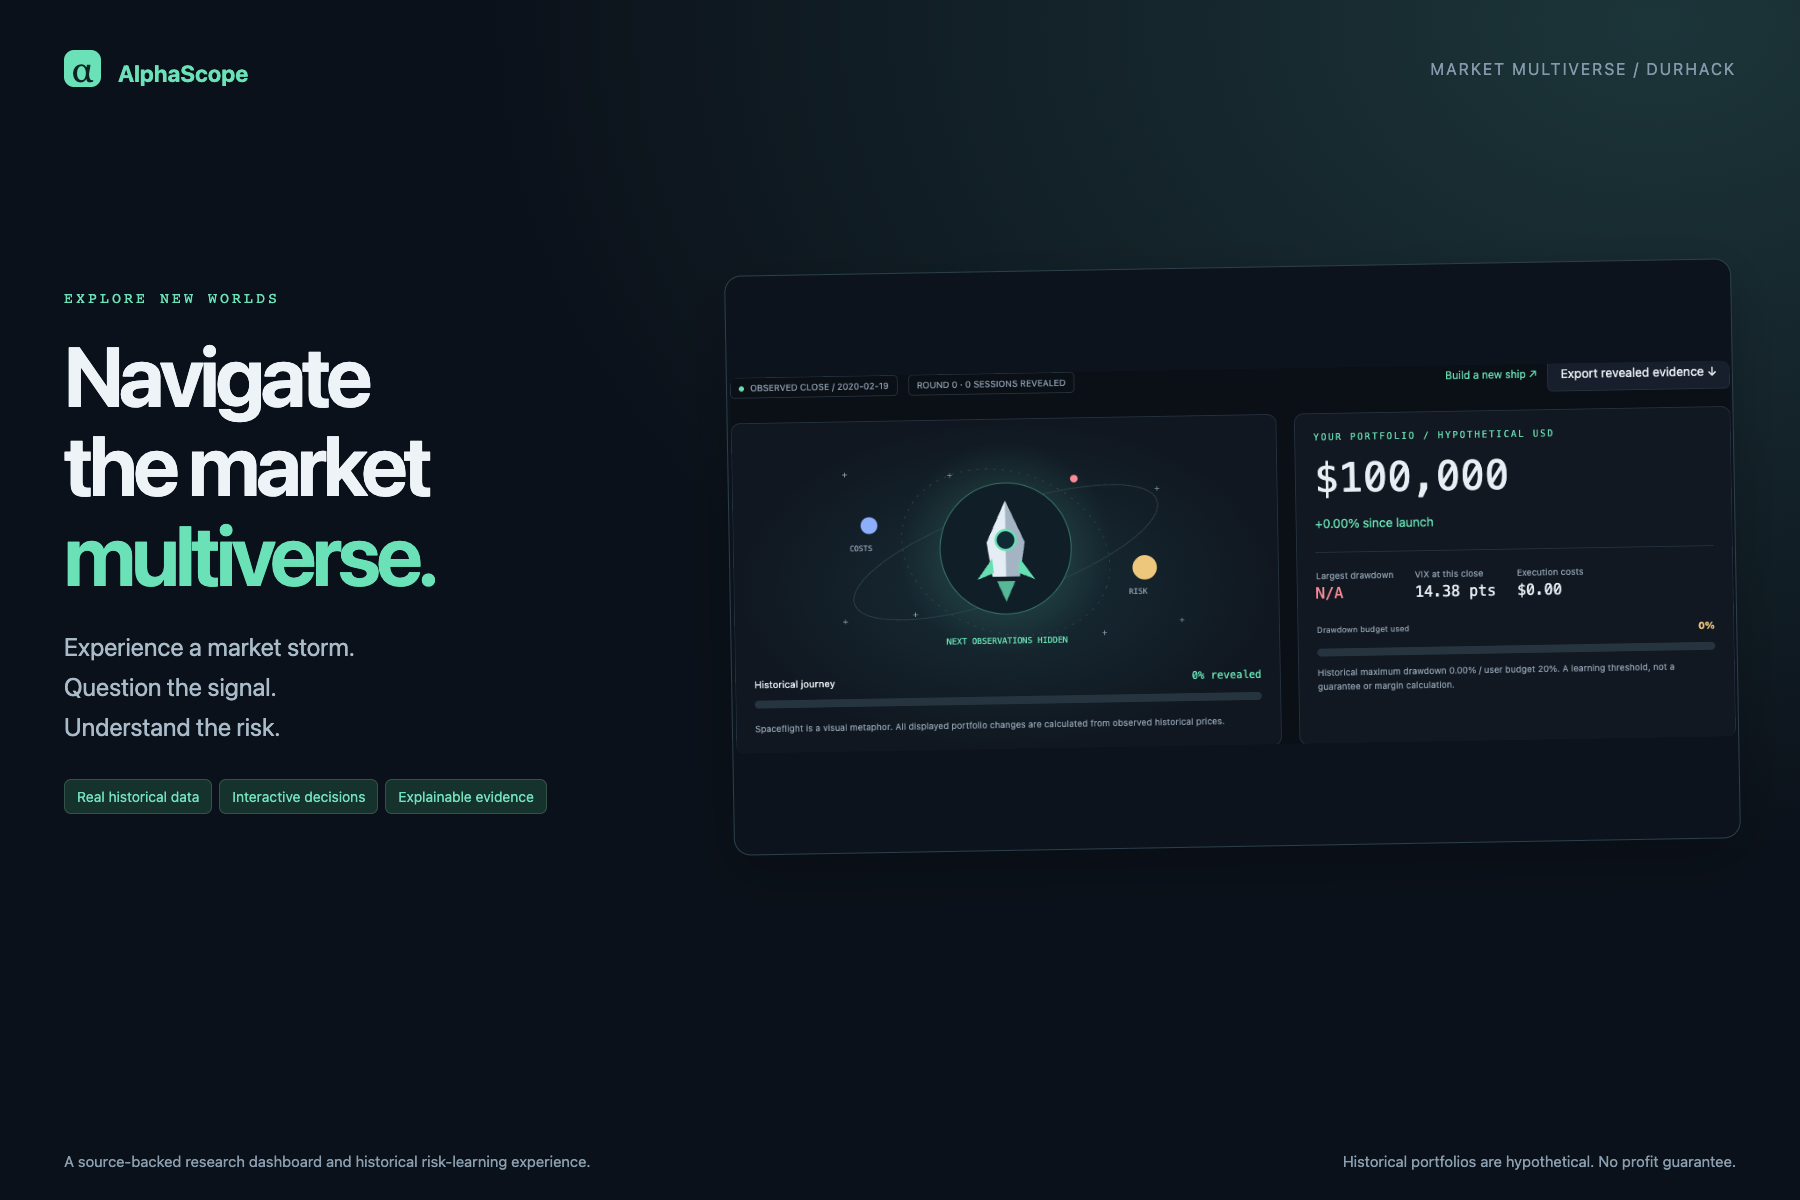
We built AlphaScope to make those connections visible. Inspired by the themes of market storms and New Worlds, we asked users to explore different financial worlds—and experience how their decisions could change their journey through them.
What it does
AlphaScope combines a multi-asset research dashboard with Market Multiverse, an interactive learning experience.
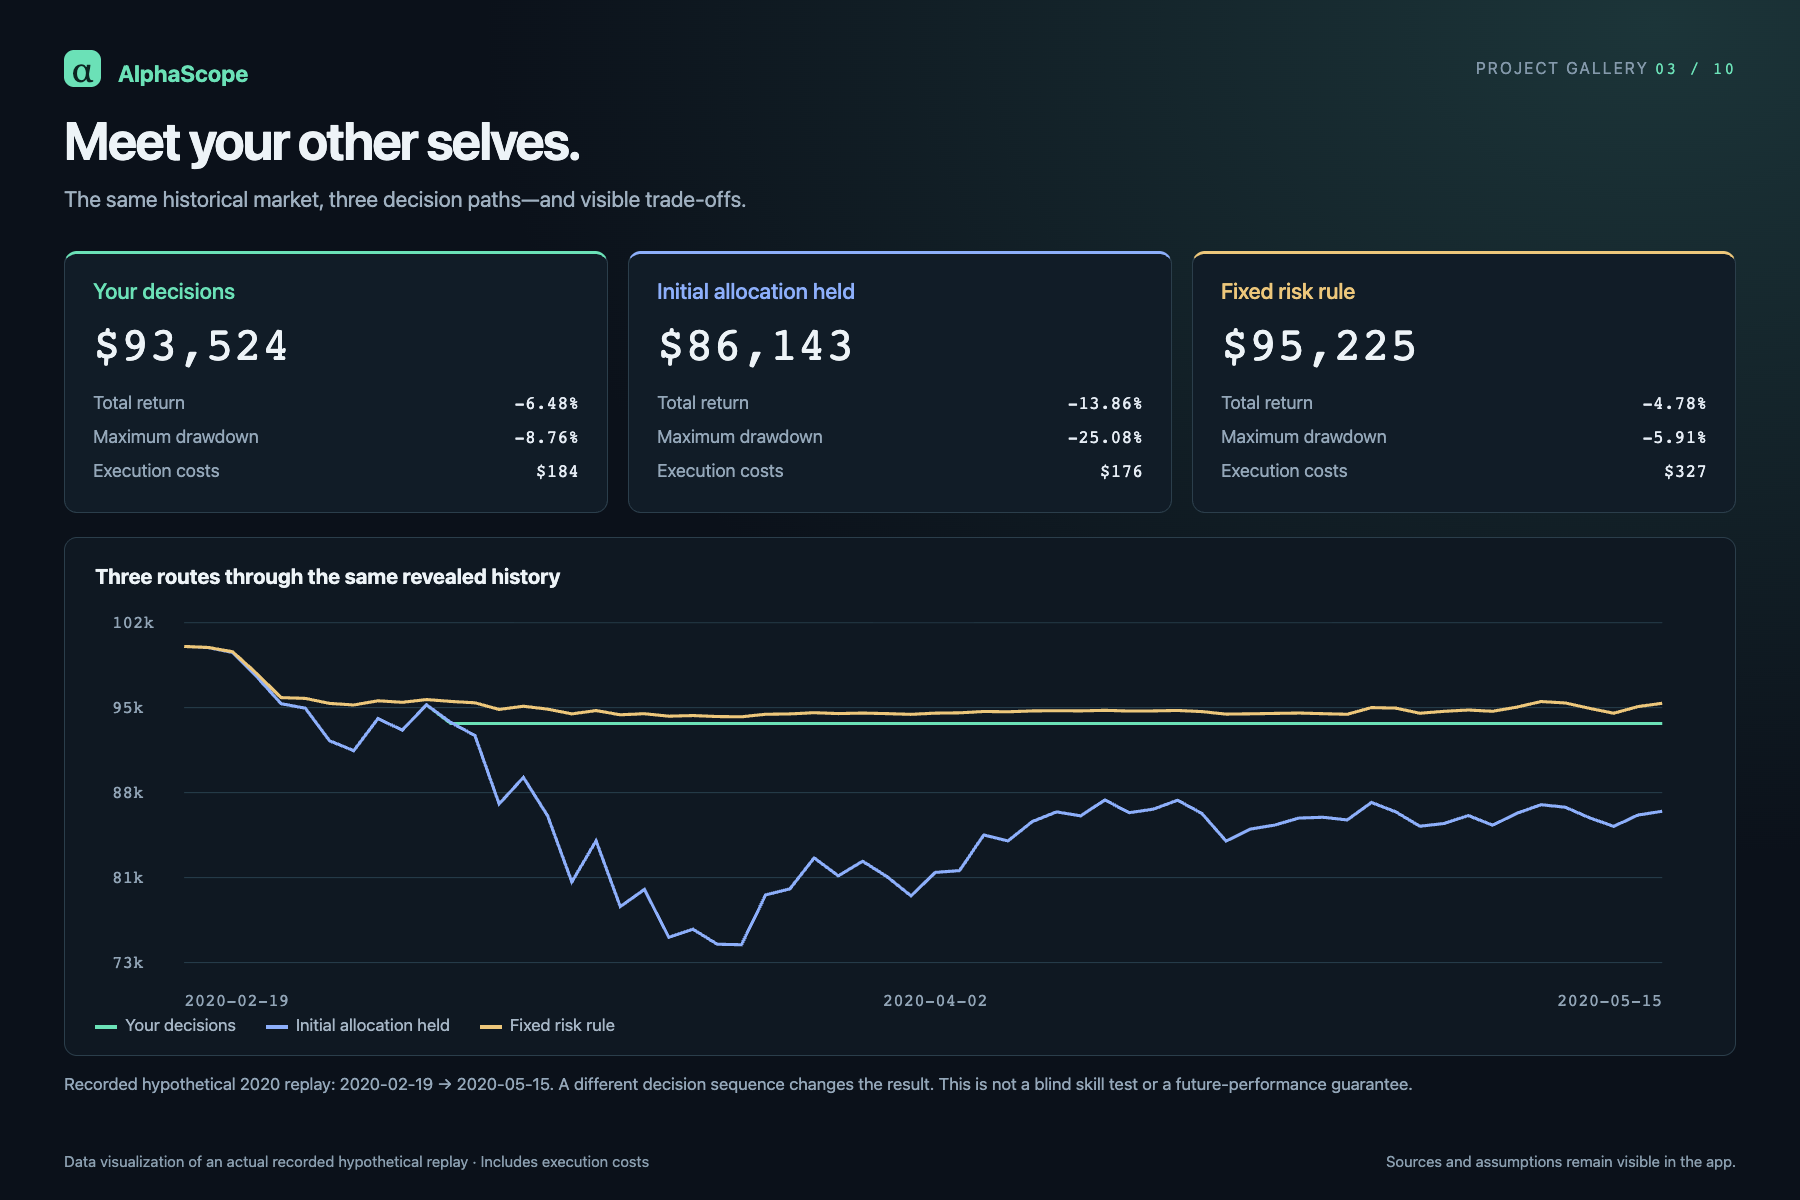
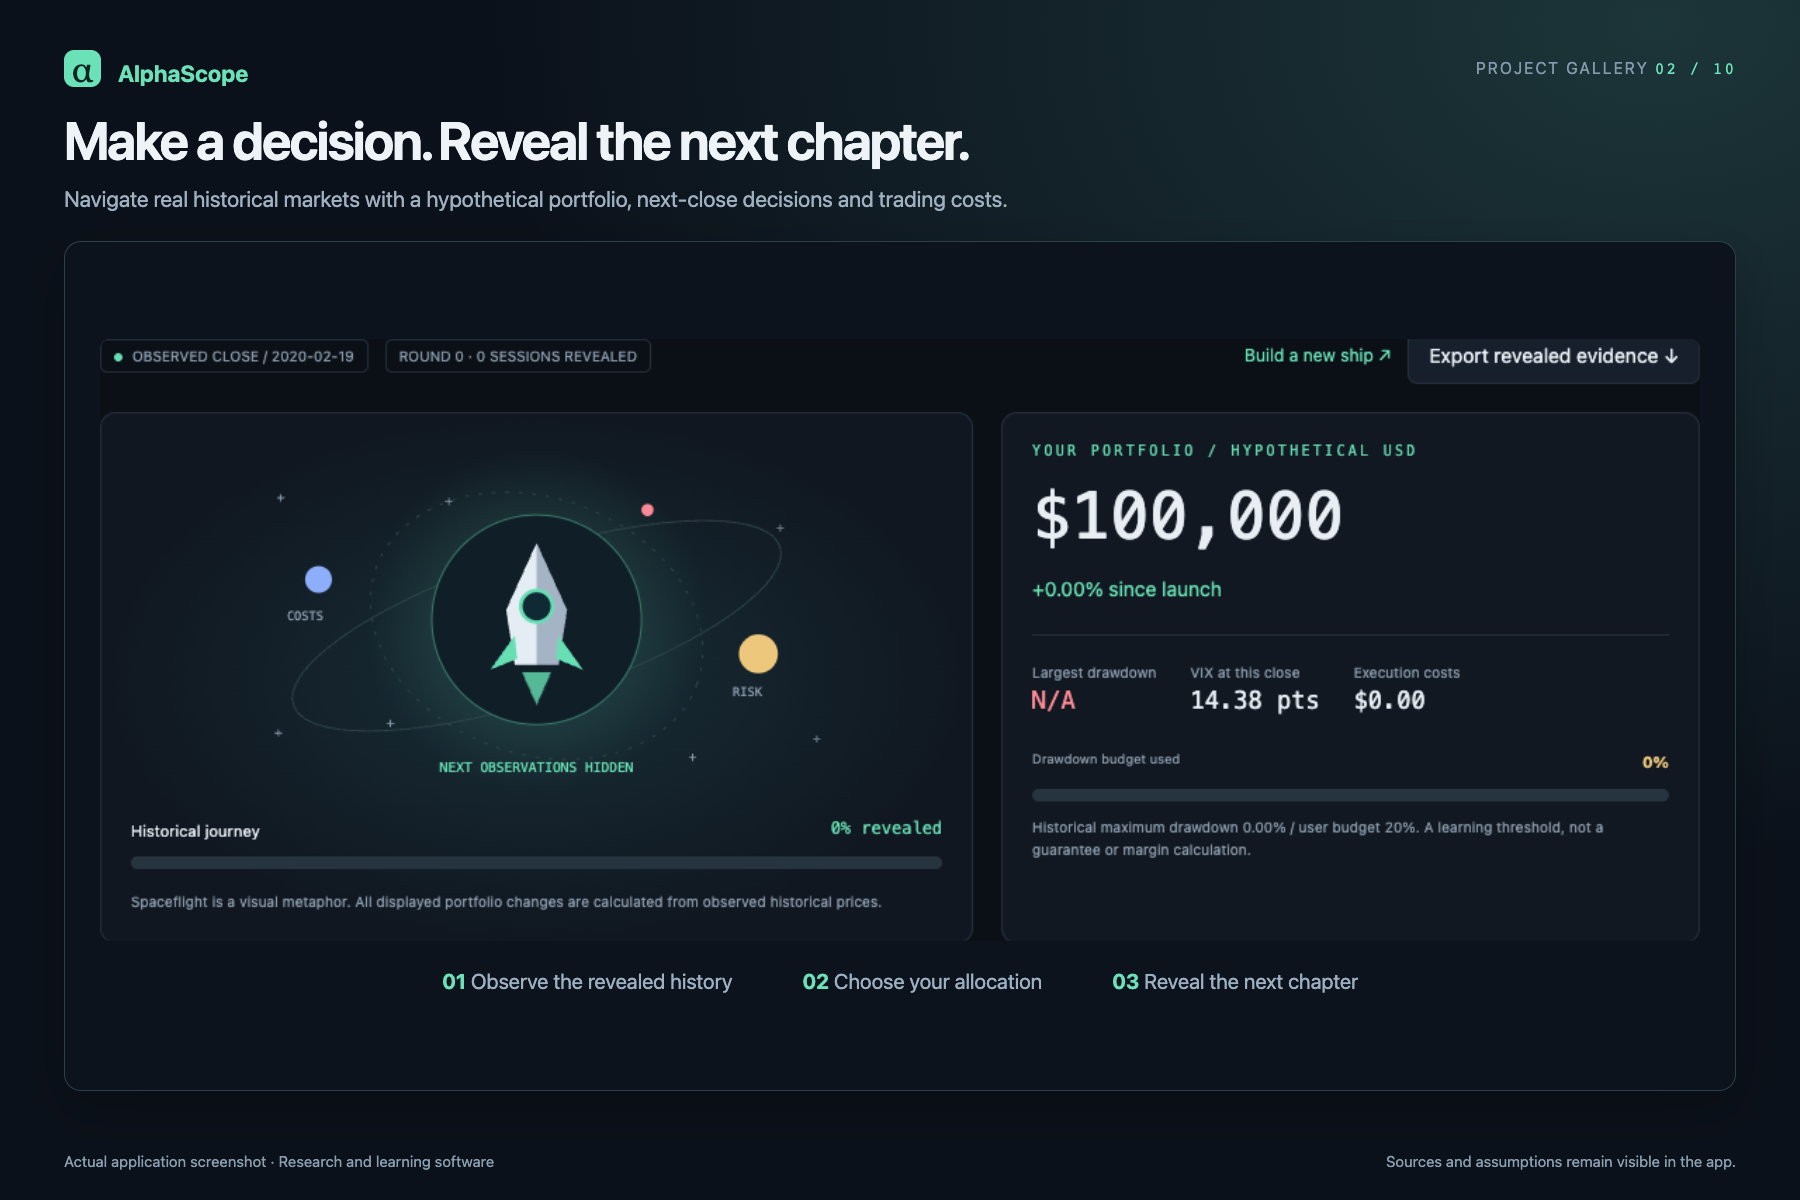
Its flagship feature, Storm Replay, turns a hypothetical $100,000 portfolio into a spacecraft navigating real historical markets. Users choose allocations, reveal the next chapter and compare three routes: their decisions, their initial allocation held unchanged, and a fixed risk-management rule. The final debrief shows returns, drawdowns, costs and missed opportunities.
Supporting features include:
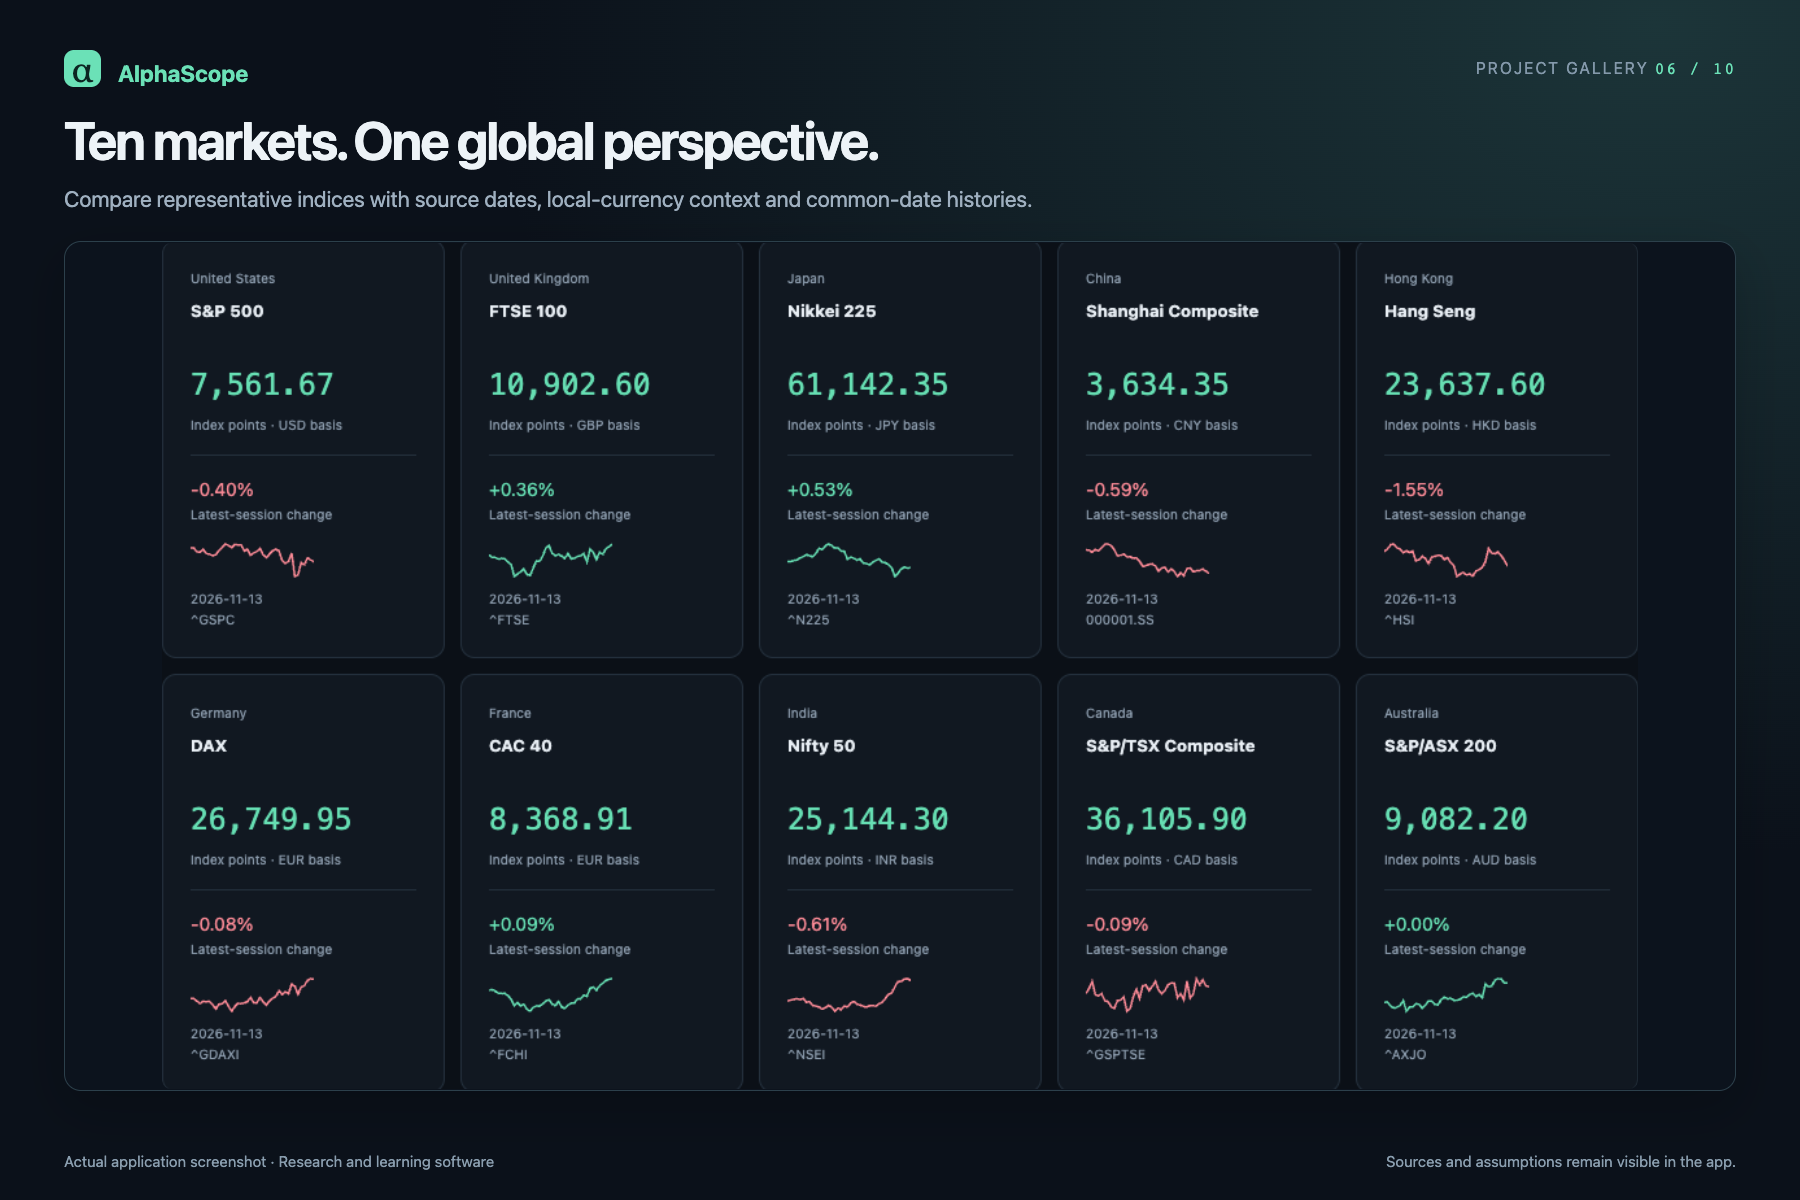
- Global Markets: ten representative indices across major international markets.
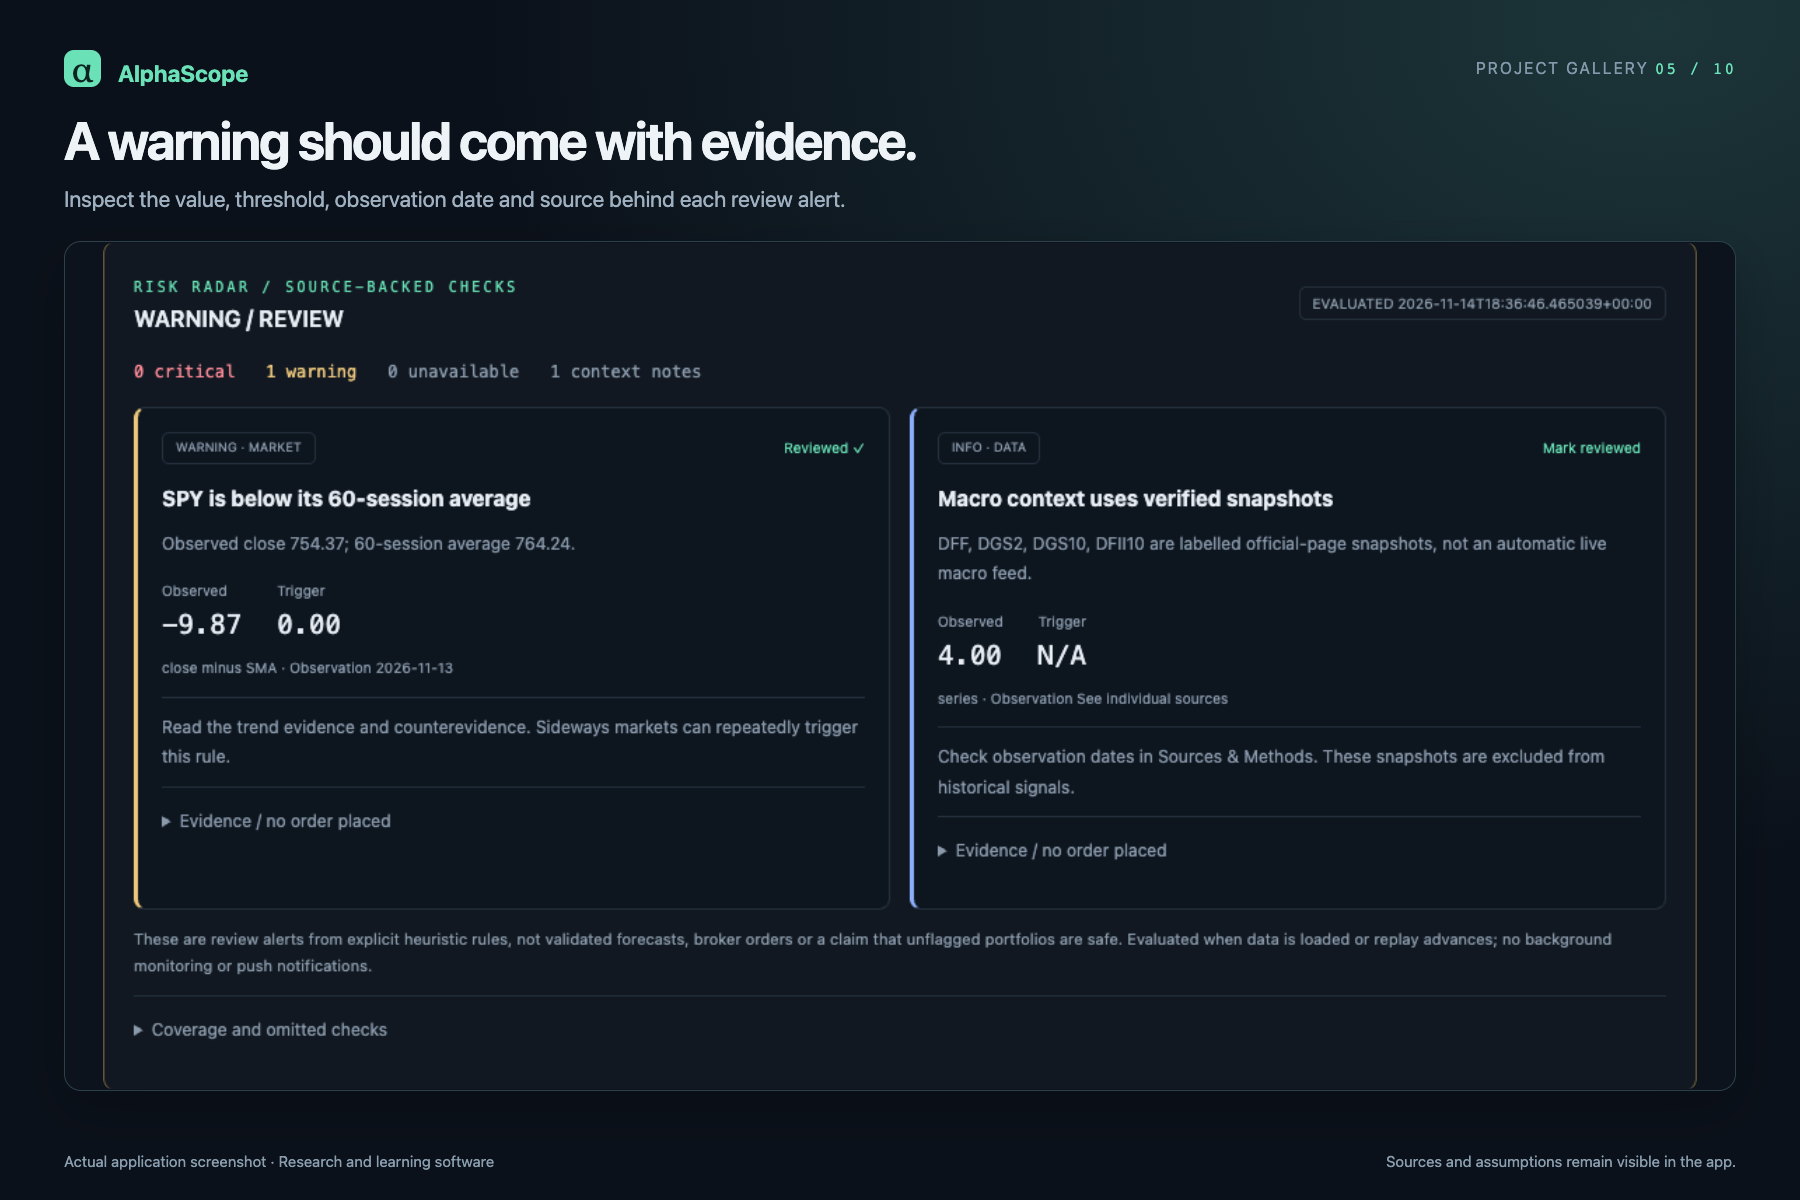
- Risk Radar: explainable warnings for volatility, concentration, drawdown budgets and missing or stale data.
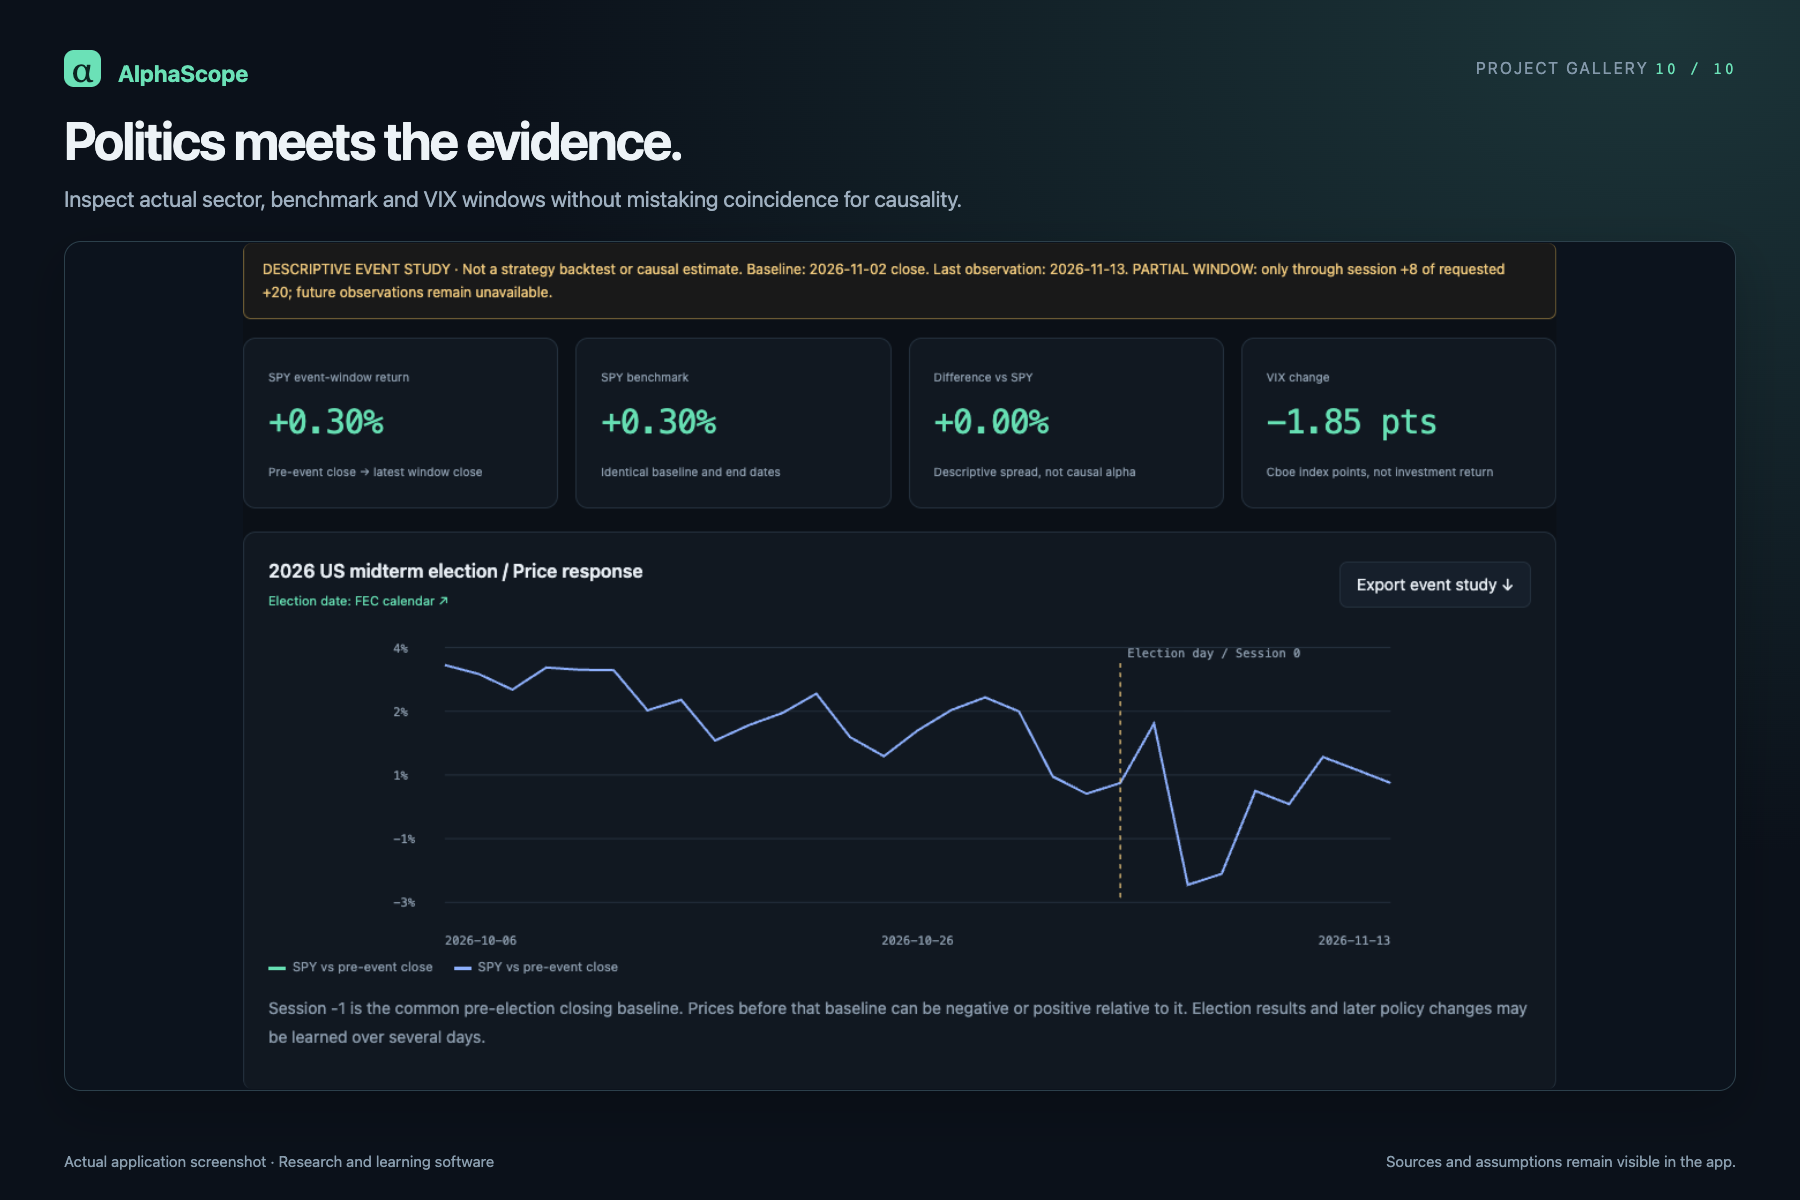
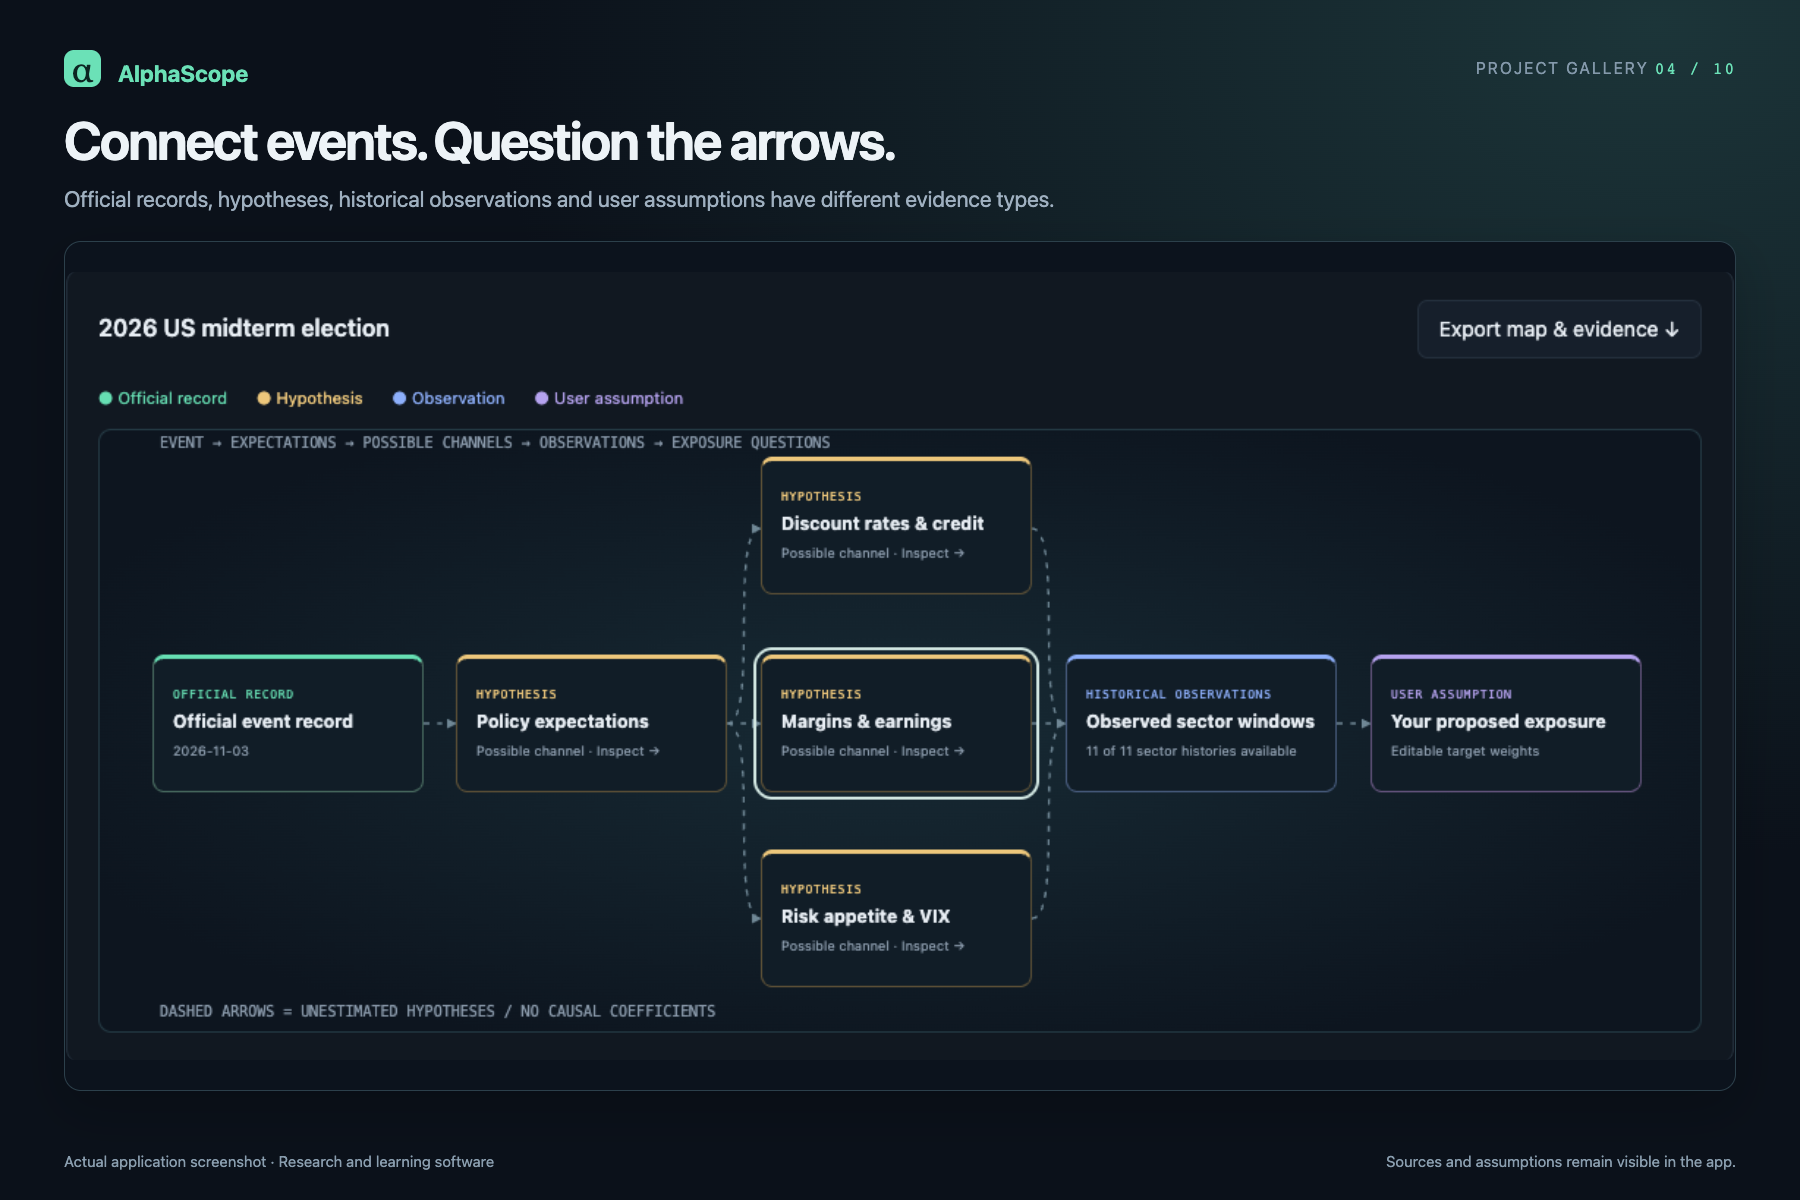
- Transmission Map: an interactive path from political or monetary events through possible economic mechanisms to historical sector observations and proposed portfolio exposures.
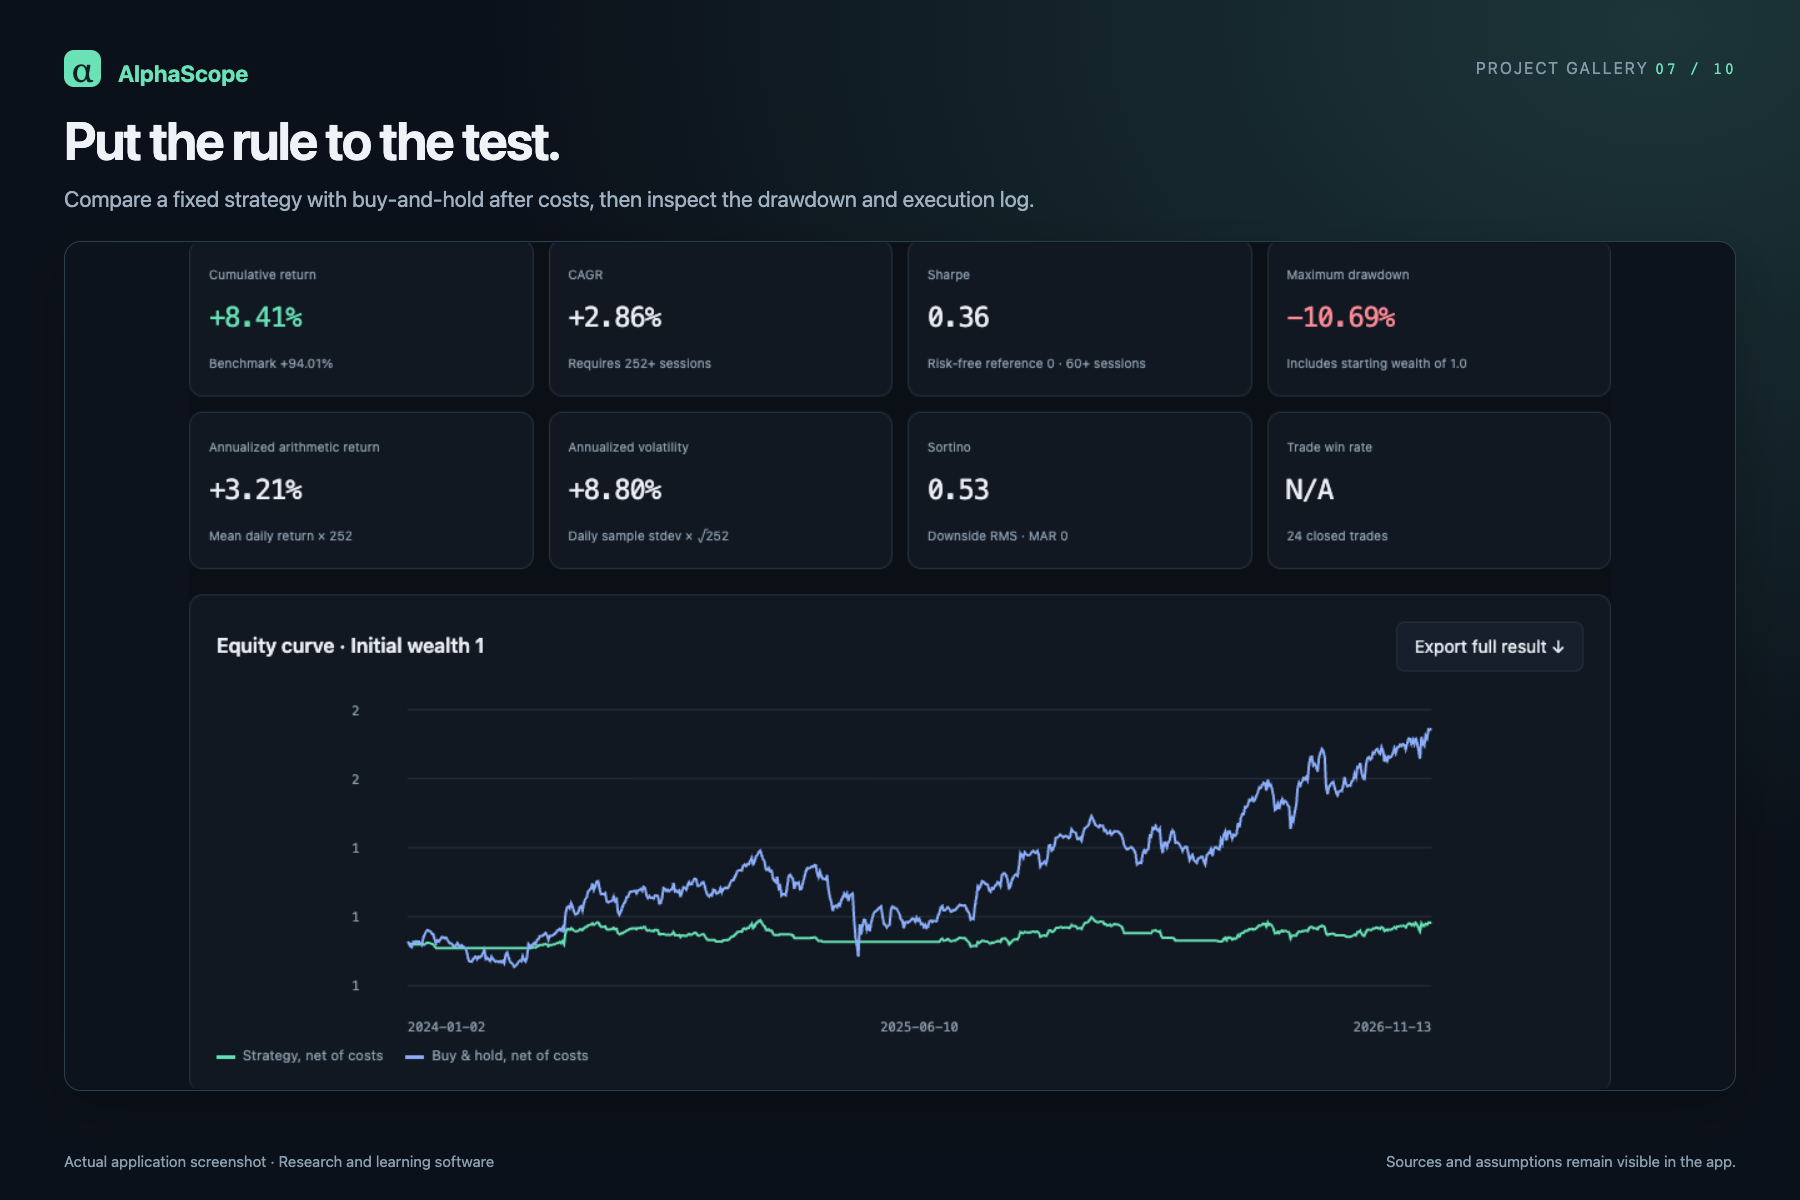
- Strategy Lab: reproducible, cost-aware backtests for five deterministic strategies.
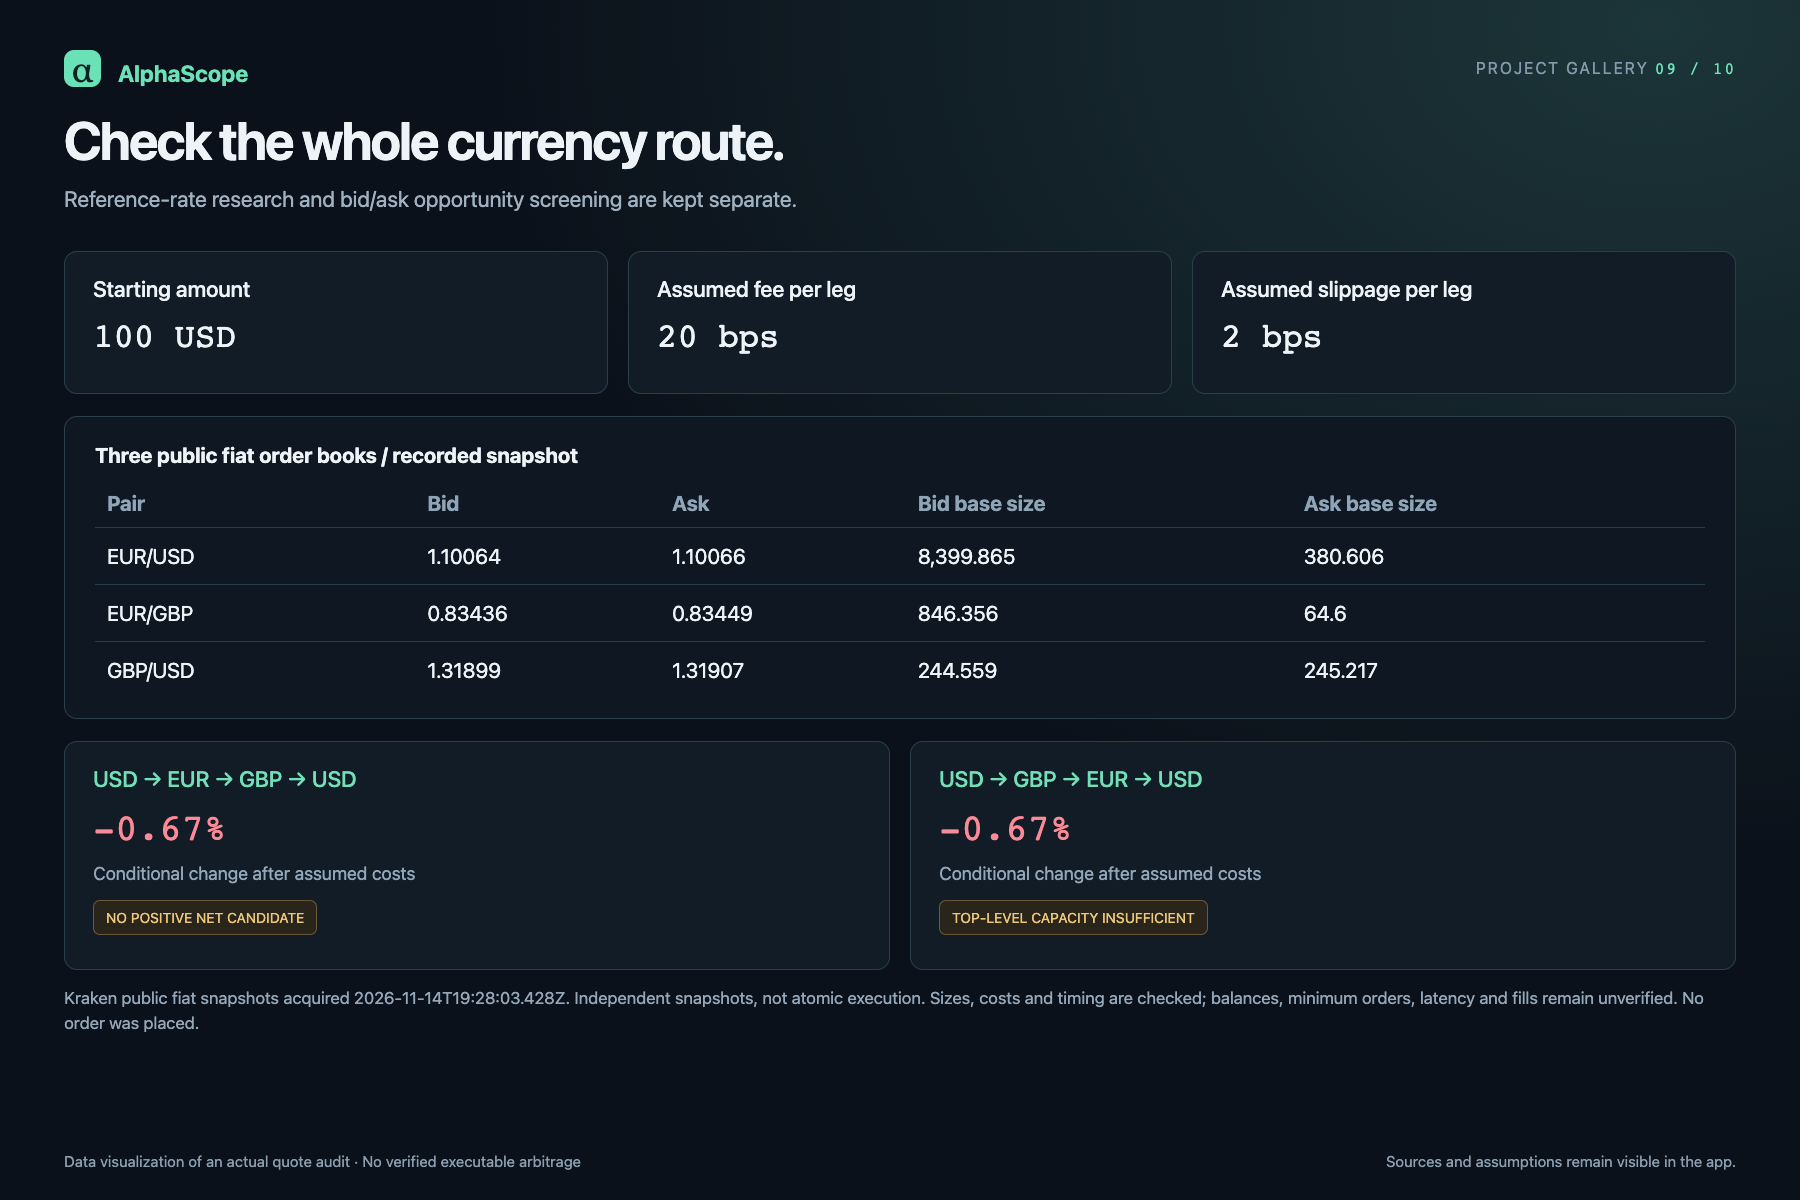
- FX & Arbitrage: sourced currency references and conditional triangular-arbitrage checks using public fiat order books.
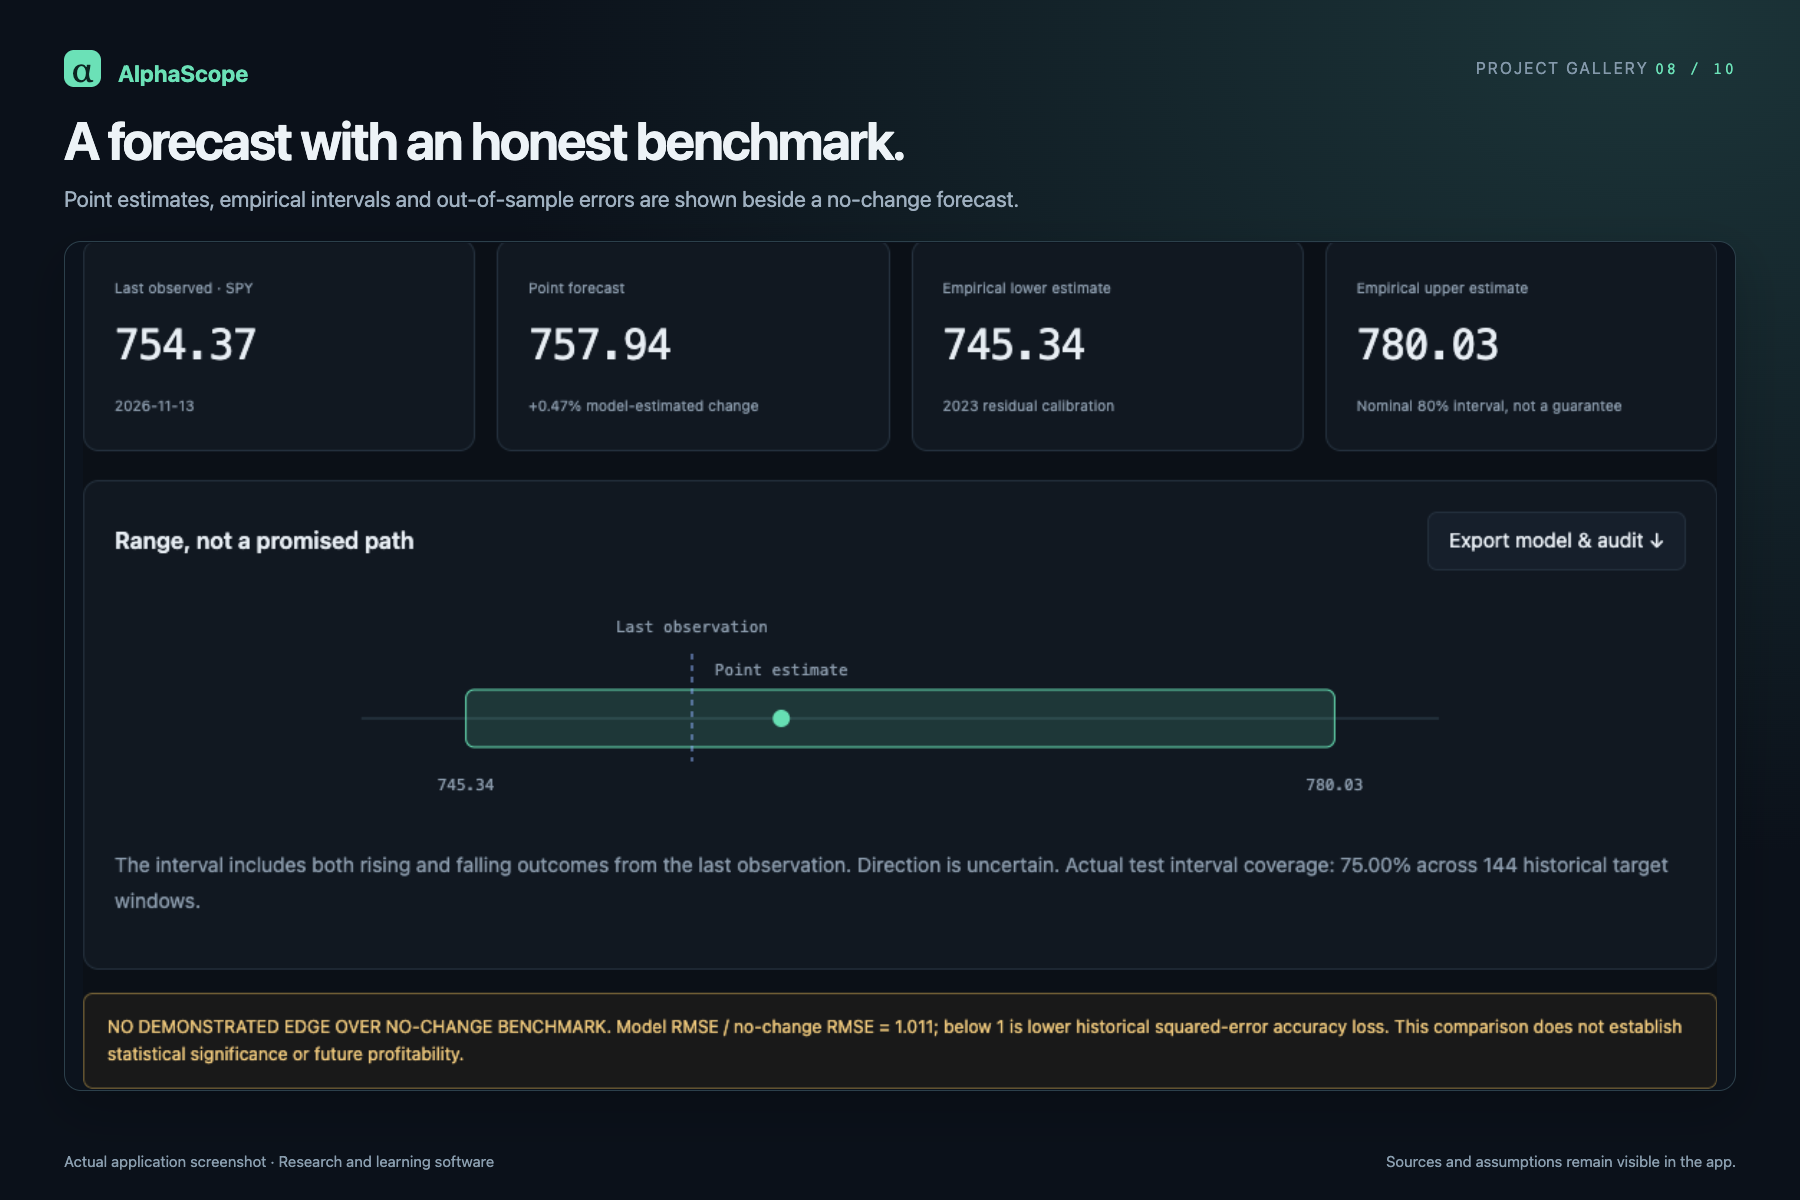
- Forecast Lab: statistical forecasts with uncertainty intervals and historical evaluation against a no-change benchmark. Every observation remains connected to its source, date and limitations. ## How we built it We used Python, NumPy and pandas for data processing, portfolio accounting, backtesting and forecasting. A lightweight Python HTTP server connects these calculations to an English frontend built with HTML, CSS, JavaScript and SVG.
Market histories come from Yahoo Finance, currency references from the European Central Bank, VIX history from Cboe, and policy releases from the Federal Reserve. Political coverage includes linked BBC News headlines and FEC-sourced election dates.
Our forecasting model uses ridge regression with rolling training windows. Historical market inputs are lagged, and training labels must already be observable at each forecast origin. We evaluate predictions against a no-change baseline and report actual uncertainty-interval coverage.
Challenges we ran into
The hardest challenge was making the product engaging while preserving scientific honesty.
Historical replays must not reveal future prices prematurely. Backtests must account for execution delays and costs. Political events can coincide with market moves without causing them. Public order-book snapshots can suggest an arithmetic opportunity without proving that all trades could execute.
Data access also presented practical problems. When direct FRED downloads timed out, we retained clearly labelled, verified snapshots for context and excluded them from historical trading signals.
Accomplishments that we're proud of
We’re proud of turning a broad financial research concept into a working, interactive product that makes risk easier to understand.
- Making historical risk tangible: Storm Replay lets users navigate real market history and compare their decisions with alternative routes, including trading costs and drawdowns.
- Connecting the evidence: Transmission Map brings official events, possible economic mechanisms, historical observations and portfolio assumptions into one explorable view.
- Building for transparency: Data sources, observation dates, model assumptions and limitations remain visible throughout the experience.
- Testing the foundations: We completed 125 strategy backtests and 32 forecast evaluations, with 87 core tests and 137 browser checks passing.
- Reporting honest results: We show when forecasts fail to beat a simple benchmark or when an apparent arbitrage opportunity does not survive the checks. We’re proud that the product supports scrutiny rather than hiding uncertainty. ## What we learned We learned that an explainable limitation can be more useful than an impressive-looking prediction.
Most of our tested forecast configurations did not outperform the no-change benchmark. We display that result openly. Likewise, an arbitrage scanner should report no qualifying opportunity when costs, timing or depth invalidate it.
We also learned that interactive storytelling makes quantitative concepts easier to understand. Drawdown becomes tangible when users experience the decisions that produced it.
What's next for AlphaScope
We want to add stronger point-in-time datasets, broader historical scenarios, portfolio correlation analysis and appropriately licensed synchronized market feeds.
Our goal is to help users build a clearer decision process: observe, question, test and understand the risk before acting.
