alphaResearch
Inspiration
Earnings season is one of the most information-dense periods in finance. A typical S&P 500 company produces a 10,000-word earnings call transcript every quarter. An analyst covering 8–15 companies must read, cross-reference, and compare all of them under tight deadlines — often with multiple companies reporting on the same day. The tools that exist today solve fragments of this problem. Summarizers condense a single transcript. Sentiment models score tone. Chatbots answer one-off questions. But none of them produce the output that matches how a fundamental analyst actually thinks: What drove results? What is management guiding toward? What themes cut across the peer set? How does this company compare to its competitors segment by segment?
We were also struck by a structural gap in existing AI tooling for finance: systems that produce confident-looking structured output — signal cards, comparison tables, financial figures — with no way for the analyst to verify where any of it came from. In a field where a single wrong number can drive a bad decision, an ungrounded AI summary is worse than no summary at all. We wanted to build something an analyst could actually trust, not just read.
What It Does
alphaResearch is a multi-agent equity research terminal that automates the first-pass analysis workflow end to end. You enter a ticker, click Analyze, and within 60–90 seconds the system returns a structured four-section research report:
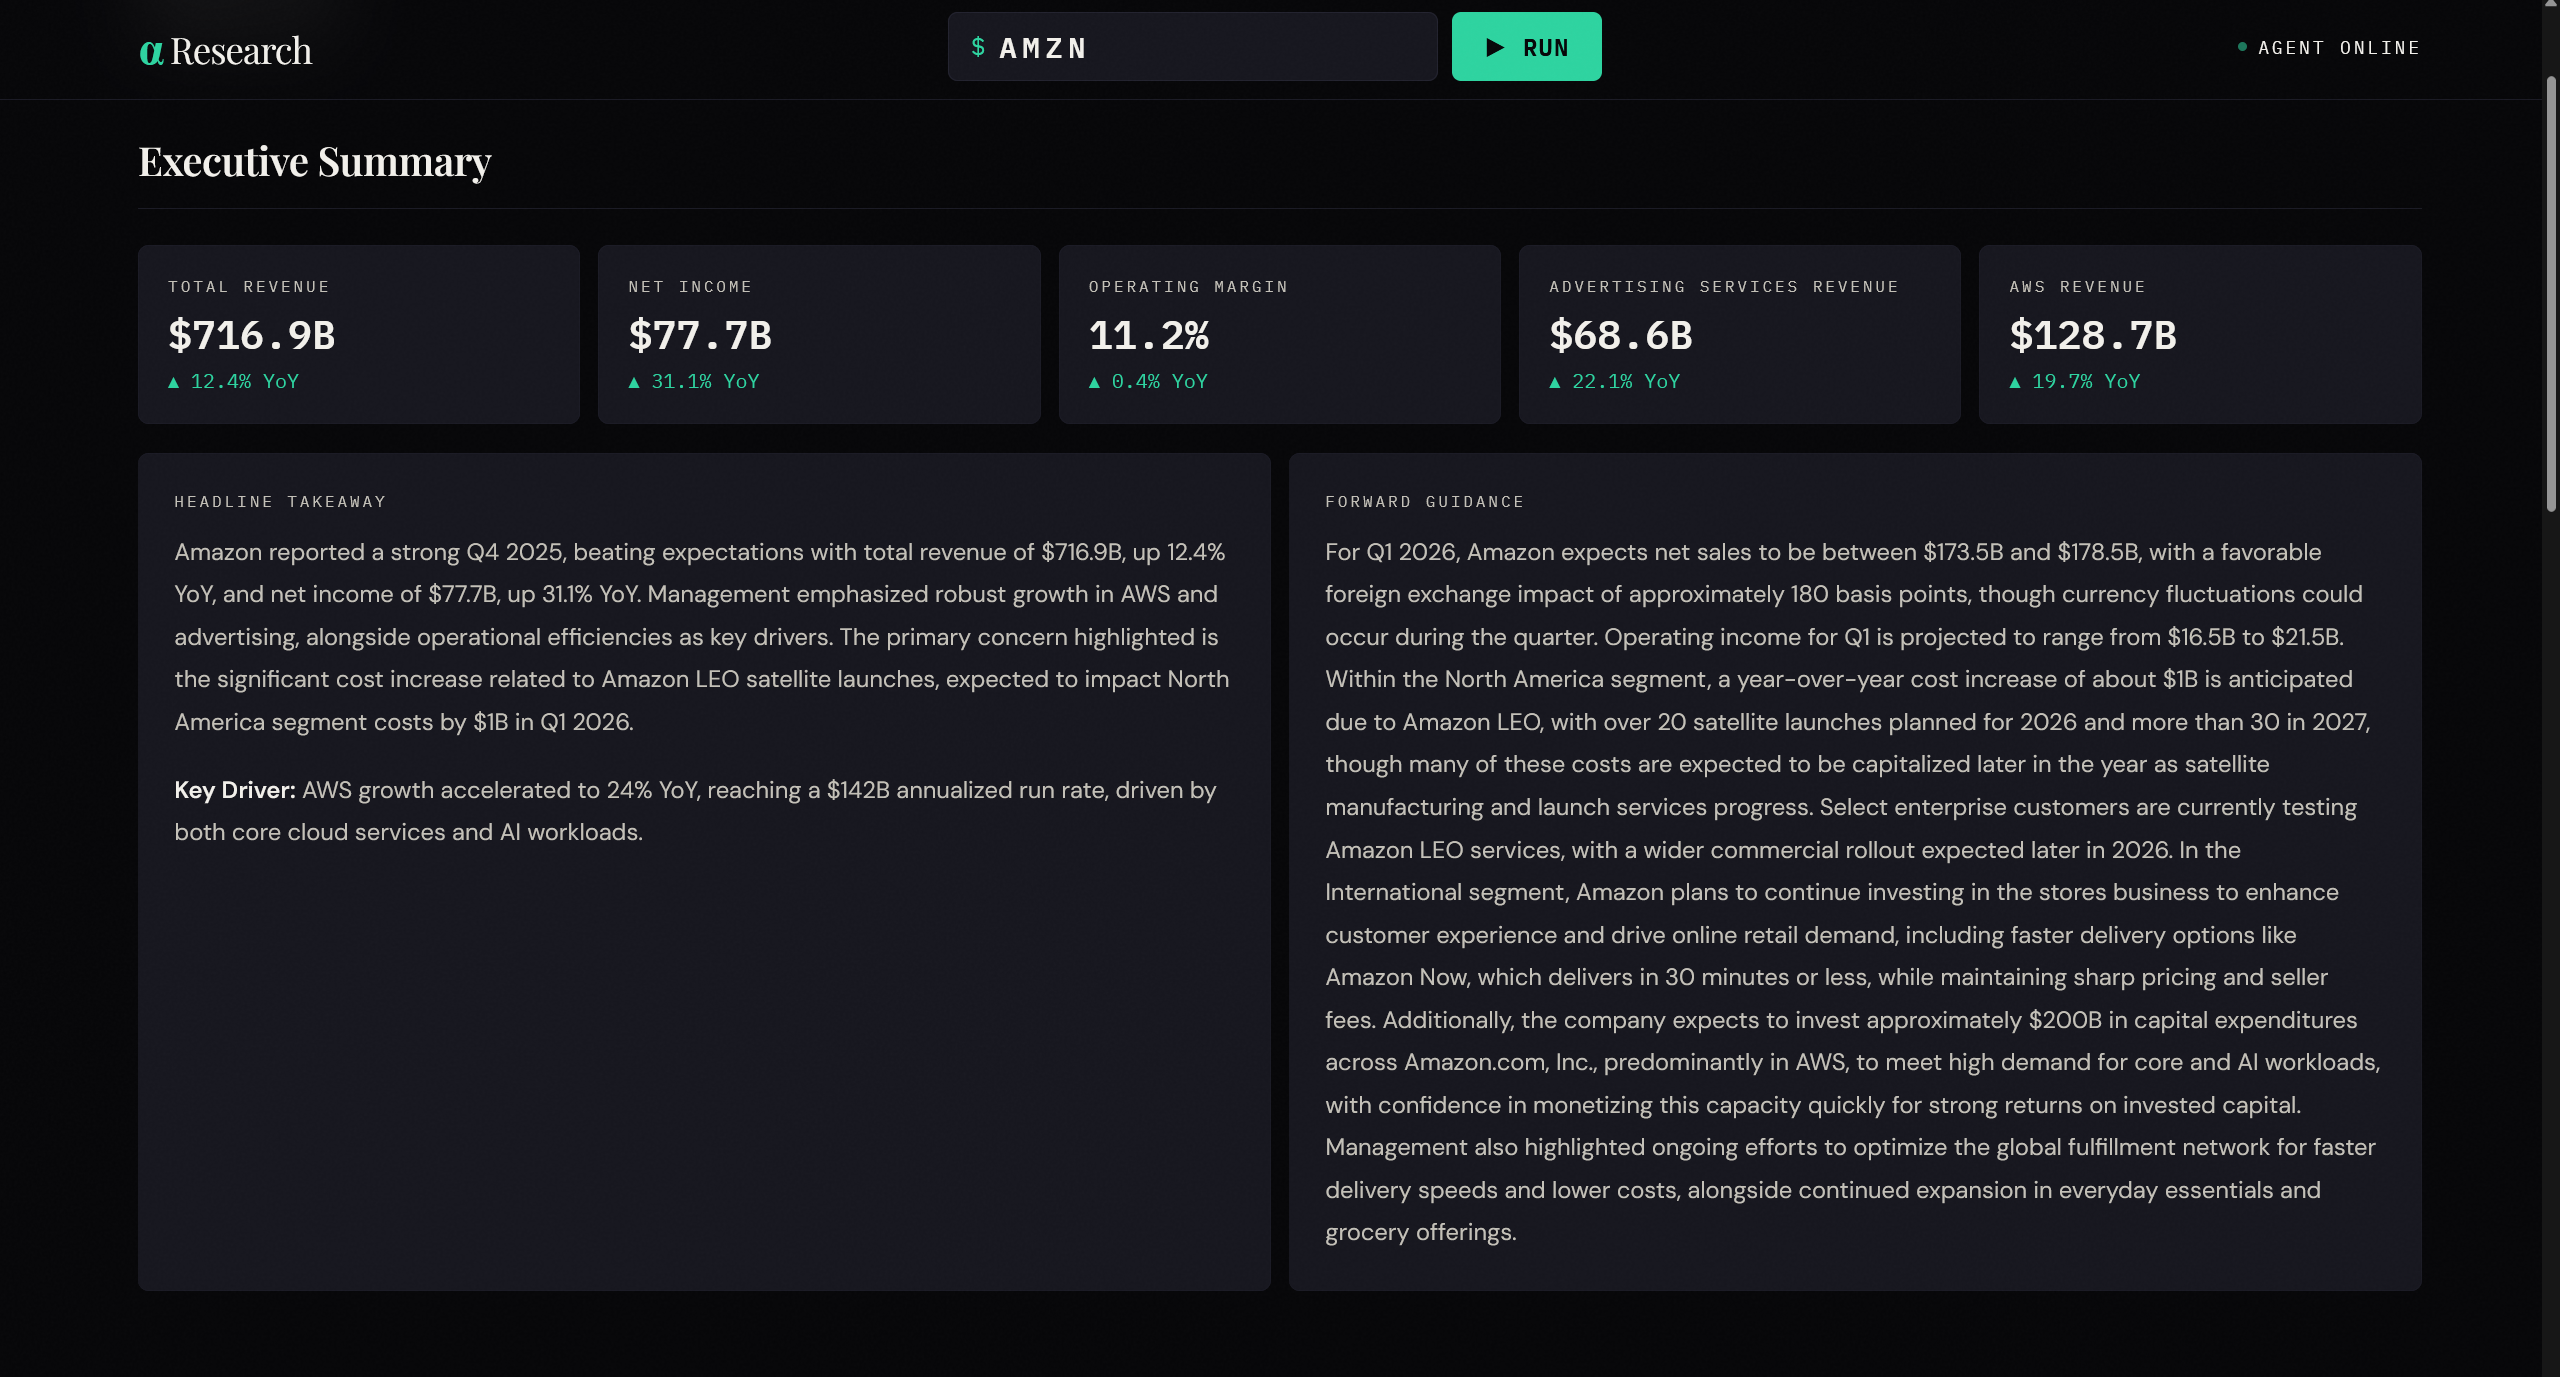
Executive Summary — four key financial metrics (Total Revenue, Net Income, Operating Margin, top two growth segments) each with a quarter-over-quarter delta showing the direction of change, a headline takeaway with bolded drivers, and a forward guidance paragraph covering next-quarter targets, CapEx commitments, and segment outlook.
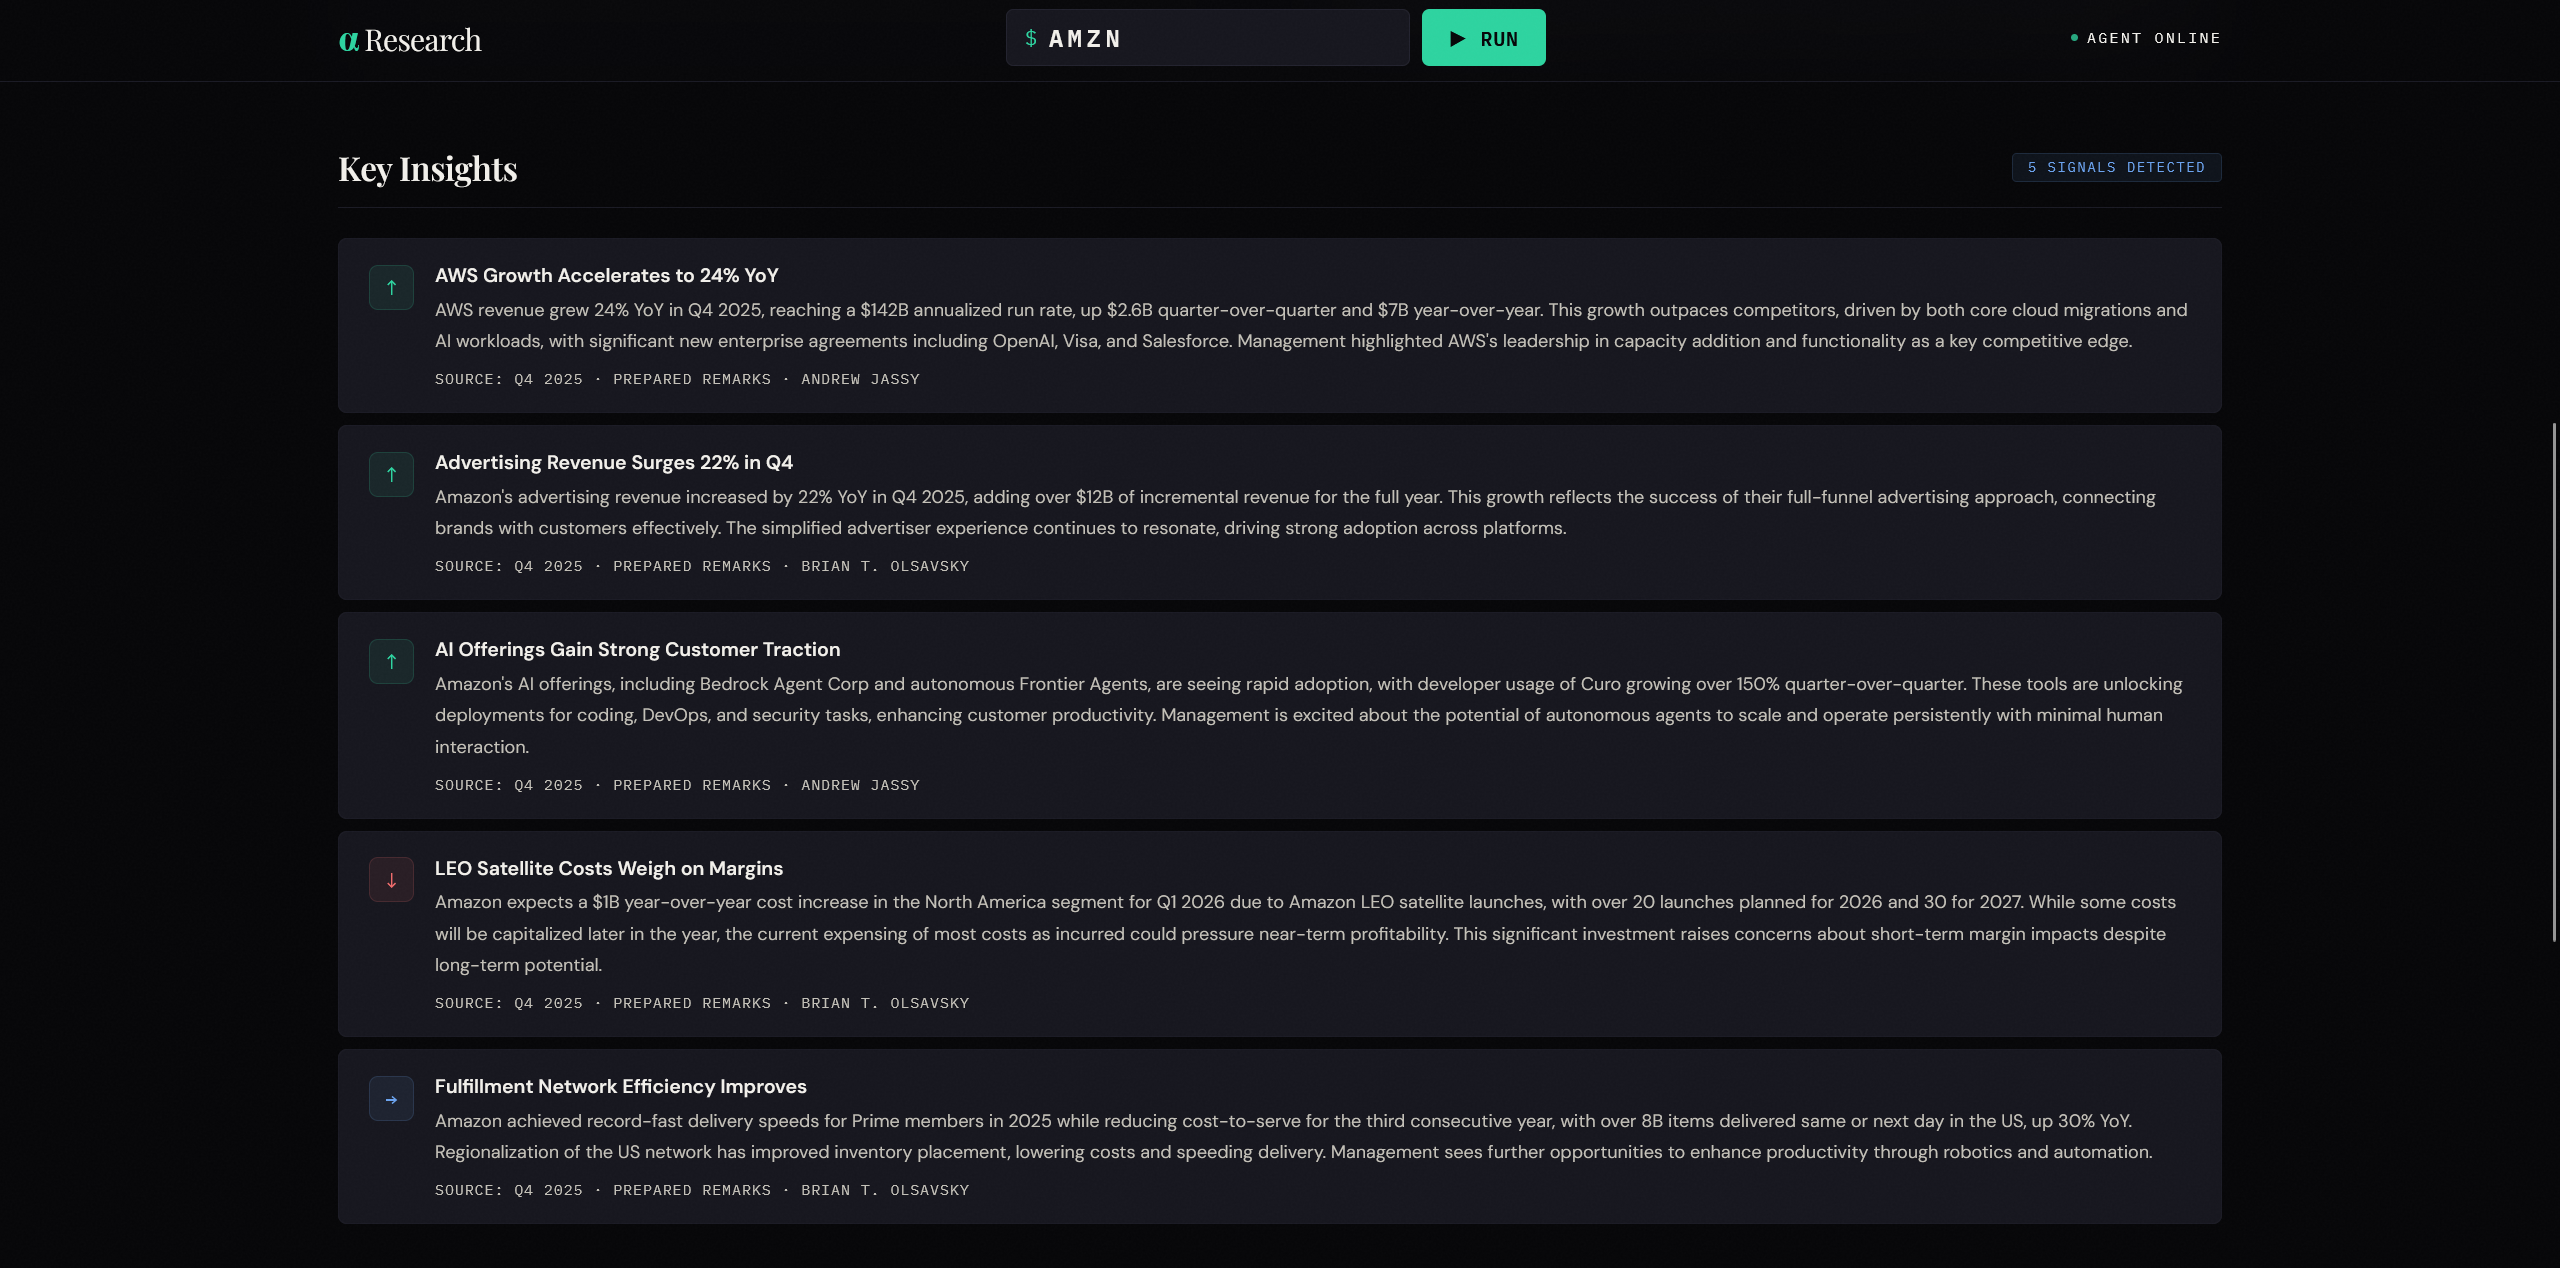
Key Insights — 4–6 signal cards classified as bullish, bearish, or neutral, each with a grounded citation showing exactly which transcript chunk, speaker, section (prepared remarks vs. Q&A), and quarter produced the signal. No signal can be emitted without a traceable source.
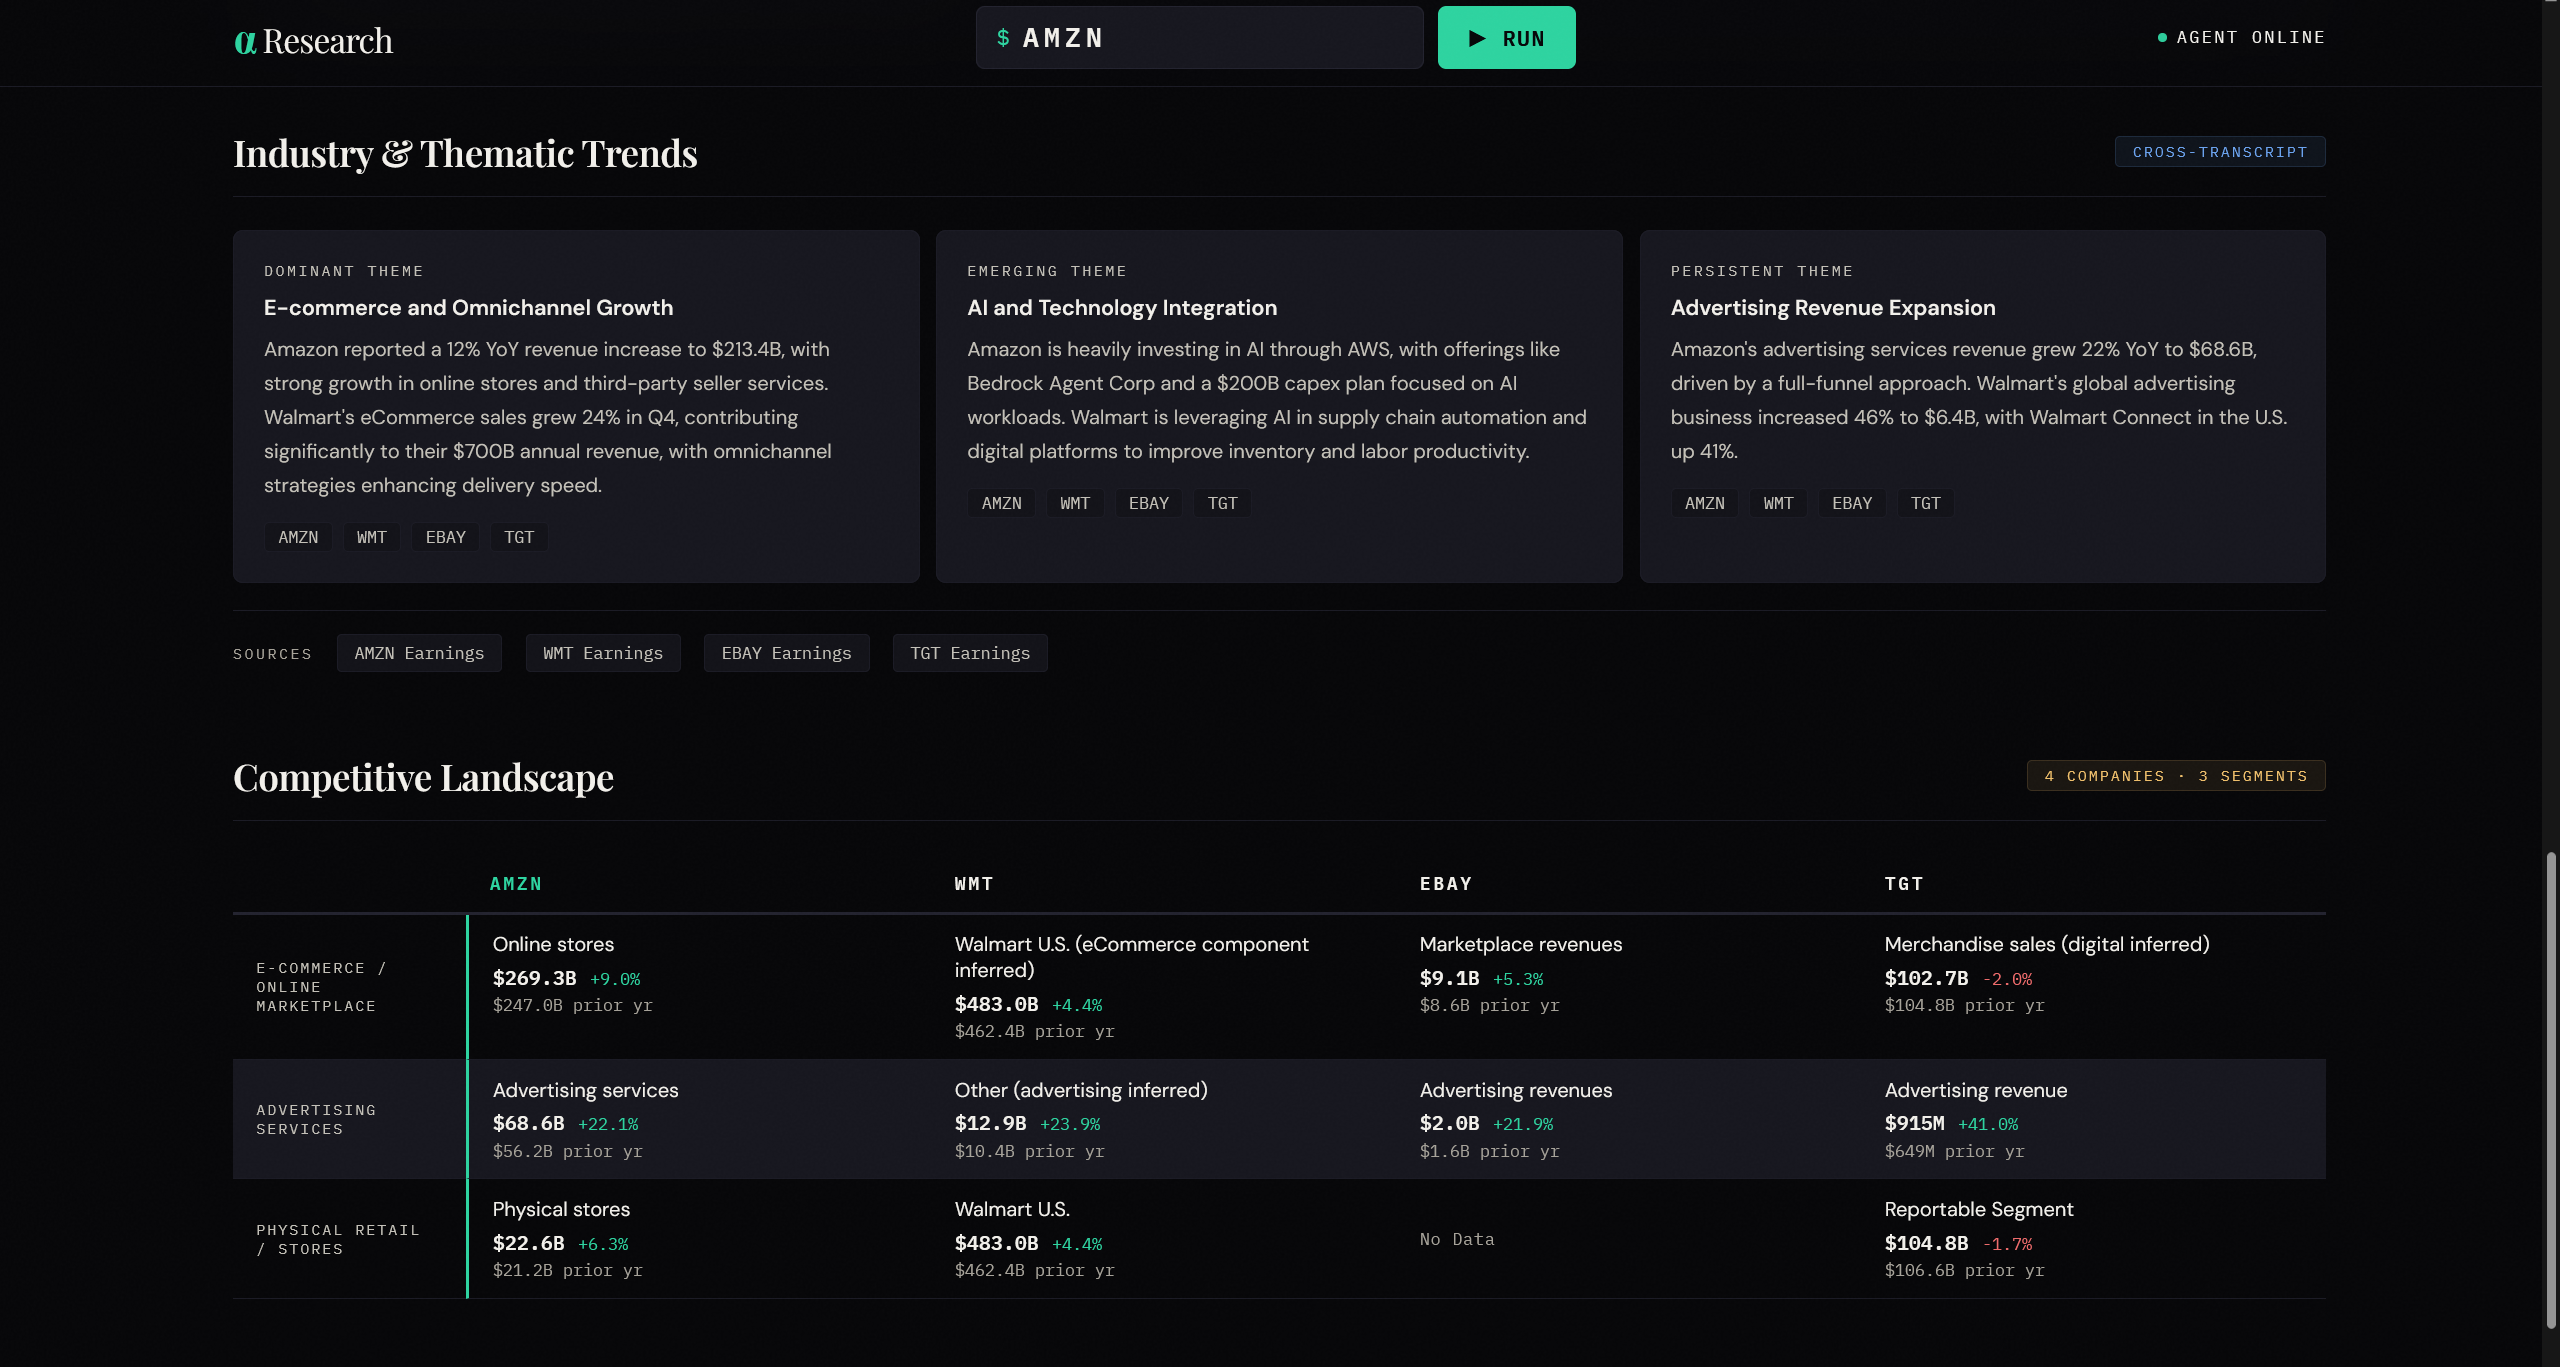
Industry Trends — three cross-company themes drawn from peer transcripts simultaneously, categorized as dominant, emerging, or persistent, with ticker attribution showing which companies discussed each theme.
Competitive Landscape — a comparison table with the target company and its three closest peers as columns, and shared revenue segments as rows. Each cell shows the company's own segment label, current and prior-year revenue, and YoY growth. Cells are tagged with a confidence level — exact match, inferred mapping, or suppressed — so analysts know which comparisons are reliable and which require verification.
How We Built It
The core of the system is a LangGraph multi-agent graph with two parallel branches running simultaneously after peer selection:
The transcript branch runs an agentic RAG loop against a Pinecone vector store of earnings call transcripts (chunked at 400–600 tokens, split at the prepared remarks / Q&A boundary, indexed with OpenAI embeddings). A Gemini-powered grader evaluates chunk relevance and rewrites the query if the first retrieval pass fails — up to two attempts. Accepted chunks are passed to the transcript agent alongside live financial data pulled from SEC EDGAR via the EdgarTools MCP server. The agent produces the executive summary, signal cards with citations, and quarter-over-quarter temporal deltas.
The peer branch runs the same agentic RAG loop across all three peer transcripts simultaneously, then pulls financial statements for the full company set via parallel MCP tool calls. The peer analysis agent produces three cross-company industry trends and the competitive landscape table with per-cell confidence scoring.
Both branches run concurrently via LangGraph's native fan-out topology — no polling loops, no webhook callbacks. A deterministic merge node combines the outputs into a FinalReport and aggregates all temporal deltas into a flat list for the frontend. The graph then pauses at a human_review_node using LangGraph's interrupt() mechanism, persisting full state to the checkpointer while the analyst reviews the report. Feedback is injected via graph.update_state() and the graph resumes, routing to approval, rejection, or a refinement loop.
The backend is a FastAPI server exposing three endpoints: start a run, stream progress events via SSE, and submit feedback. The data pipeline is a DuckDB-based ingestion script that pulls transcripts from a public HuggingFace dataset and upserts them to Pinecone. Financial statements come directly from SEC EDGAR via the EdgarTools MCP server — no GitHub JSON intermediary, no rate limits, always current.
Stack: LangGraph · Gemini 2.5 Flash · EdgarTools MCP (stdio transport) · Pinecone · OpenAI embeddings · FastAPI · SSE · PostgresSaver · React frontend
Challenges We Ran Into
Segment mapping across companies is genuinely hard. AWS, Intelligent Cloud, and Google Cloud are economically comparable but named differently, scoped differently, and have different revenue recognition conventions. A naive language-similarity mapping produces a table that looks authoritative but contains non-comparable numbers. We ended up building a three-level confidence system — exact, inferred, missing — and suppressing rows where fewer than two companies share a segment, rather than fabricating mappings.
Citations as a structural requirement, not a feature. Making every signal card grounded to a specific chunk ID, speaker, and section required rearchitecting the agentic RAG loop so citation metadata was a first-class output of the retrieval-grading-generation pipeline, not something added afterward. The hallucination checker verifies that every signal references a chunk ID before the output leaves the agent.
The parallel fan-in coordination problem. We initially built the parallel execution pattern with webhook callbacks and polling loops (mirroring the original n8n architecture). Migrating to LangGraph's native graph topology eliminated that complexity entirely — the framework handles fan-out and fan-in, and the merge node simply doesn't execute until both branches have written to shared state.
Temporal comparison without schema enforcement is dead code. We defined TemporalDelta as a schema early on but it wasn't wired into MetricItem, SignalCard, or FinalReport — so nothing ever produced it or consumed it. Making it a required field on MetricItem (not optional) and a first-class aggregated list on FinalReport forced the agent to actually produce QoQ deltas rather than treating temporal comparison as a nice-to-have.
MCP session lifecycle in an async graph. The EdgarTools MCP server runs as a stdio subprocess. Opening a fresh ClientSession per tool call keeps each agent invocation independent and compatible with LangGraph's async execution model — but it adds latency. We structured parallel tool calls within each agent using asyncio.gather() to fan out Pinecone and EDGAR fetches simultaneously, recovering most of that cost.
Accomplishments That We're Proud Of
The grounded citation system works end to end. Every bullish, bearish, and neutral signal card in the output carries a chunk_id that maps directly to a Pinecone vector, with speaker name, section, quarter, and year attached. An analyst can click a citation chip and see exactly which CFO statement during Q&A produced the signal. This was the highest-trust-to-effort improvement we made and it changes the system from a black box into a verifiable draft.
The quarter-over-quarter temporal comparison is structurally enforced, not aspirational. MetricItem.temporal_delta is a required field — not optional — which means an agent that fails to produce a delta fails schema validation rather than silently dropping the comparison. Every metric in the executive summary renders with a direction arrow and a one-sentence explanation from the transcript of why the number moved.
The human-in-the-loop pause works correctly under realistic conditions. The graph pauses indefinitely at the review node, survives the analyst being in a meeting for an hour, and resumes cleanly when feedback arrives. Feedback is logged as a structured FeedbackEntry with the full report snapshot, the analyst's overrides, and a quality rating — an append-only audit trail that makes systematic errors visible over time.
The architecture went from four n8n workflows with webhook callbacks to approximately 50 lines of LangGraph graph definition. The parallel execution pattern that required a custom wait loop, retry logic for race conditions, and HTTP callback URLs is now expressed as two add_edge calls and a fan-in that the framework resolves natively.
What We Learned
Multi-agent systems fail silently in ways that single-agent systems don't. When one branch of a parallel graph produces structurally valid but analytically wrong output — an inferred segment mapping that looks confident, a signal card that isn't grounded to a specific chunk — nothing raises an error. The only defense is schema enforcement at output boundaries and explicit confidence signaling rather than suppressing uncertainty.
Temporal comparison is the highest-value improvement to a single-quarter analysis system and it costs almost nothing architecturally. The data is already in Pinecone with quarter and year metadata. The incremental cost of fetching two quarters instead of one is one extra metadata filter. The output improvement — "AWS guidance revised up from 17% to 19% vs. last quarter" instead of "AWS is bullish" — is the difference between a signal and an insight.
The MCP pattern for financial data access is genuinely better than maintaining a static data pipeline. EdgarTools gives us structured access to every SEC filing, financial statement, and company disclosure with no API key, no rate limits, and always-current data. The disclosure_search(diff_only=True) tool surfaces material changes in risk factor language across years — temporal comparison applied to filing text, not just numbers — which we hadn't anticipated using when we started.
Grounding is not a post-processing step. Making citations a structural output of the retrieval-grading-generation loop — not something the agent is asked to add at the end — is the only approach that works reliably. When citation is optional, the agent produces it inconsistently. When the schema requires a chunk_id on every signal card, the hallucination checker can enforce it before the output leaves the node.
What's Next for alphaResearch
Coverage expansion. The system currently supports AMZN, GOOG, and META for FY2025. The ingestion pipeline handles any ticker in the HuggingFace dataset, and the EdgarTools MCP server covers all SEC filers. Expanding to a full sector — all 15–20 names in cloud infrastructure or consumer discretionary — is a data pipeline task, not an architecture change.
Multi-quarter trend analysis. The current system compares the current quarter to the prior quarter. A full trend view — tracking guidance revision patterns, margin trajectory, and management tone changes across six to eight quarters — requires storing embeddings with multi-year metadata and prompting the transcript agent to reason across a time series rather than a point comparison.
Institutional-grade peer selection. The current peer selector chooses peers based on shared revenue segments and sector classification from SEC filings. A more rigorous implementation would incorporate revenue correlation, customer overlap, and supply chain relationships — sourced from 13F institutional holdings disclosures and proxy statements, both available via EdgarTools.
Feedback-driven prompt improvement. The FeedbackEntry audit log accumulates structured records of what analysts approved, overrode, and rejected — with specific field-level diffs. Analyzing patterns in this log (e.g., the competitive table confidence is consistently wrong for a specific segment type, or bullish signals about CapEx are consistently overridden) gives concrete signal for manual prompt iteration without requiring model fine-tuning.
Real-time filing alerts. The EdgarTools MCP server exposes an edgar_monitor tool that watches the SEC's live filing feed. Integrating this as a background agent that flags new 8-K material events, Form 4 insider purchases, and 13F portfolio disclosures for tracked companies would turn alphaResearch from a batch analysis tool into a continuous monitoring system.
Built With
- 2.5
- asyncio
- datasets
- duckdb
- edgar
- edgartools
- fastapi
- flash
- gemini
- huggingface
- langgraph
- mcp
- openai
- pinecone
- postgresql
- pydantic
- pydantic-settings
- python
- react
- sec
- sse-starlette
- text-embedding-3-small
- uvicorn

Log in or sign up for Devpost to join the conversation.