-
-
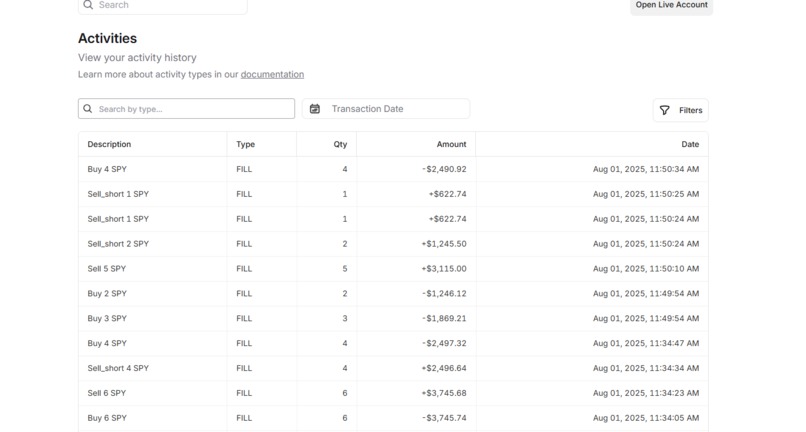
Image of fulfilled orders
-
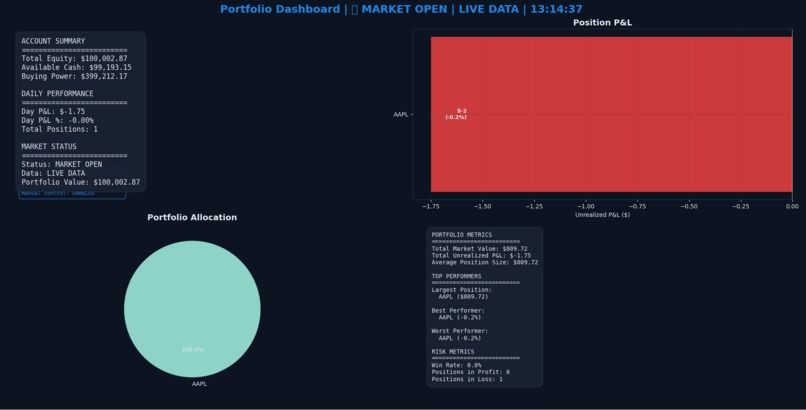
Image of portfolio holdings
-
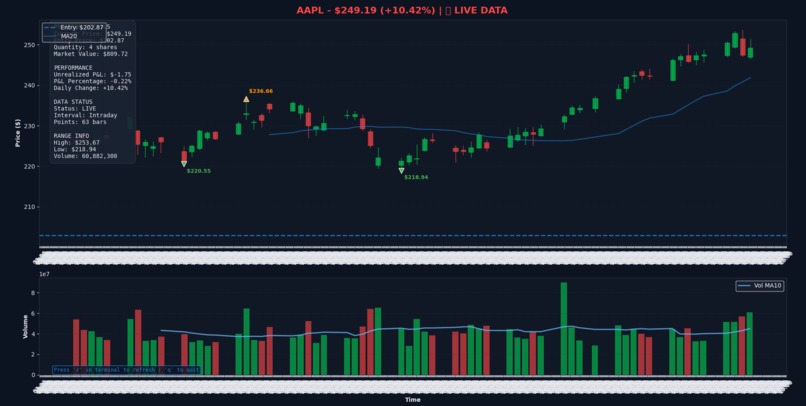
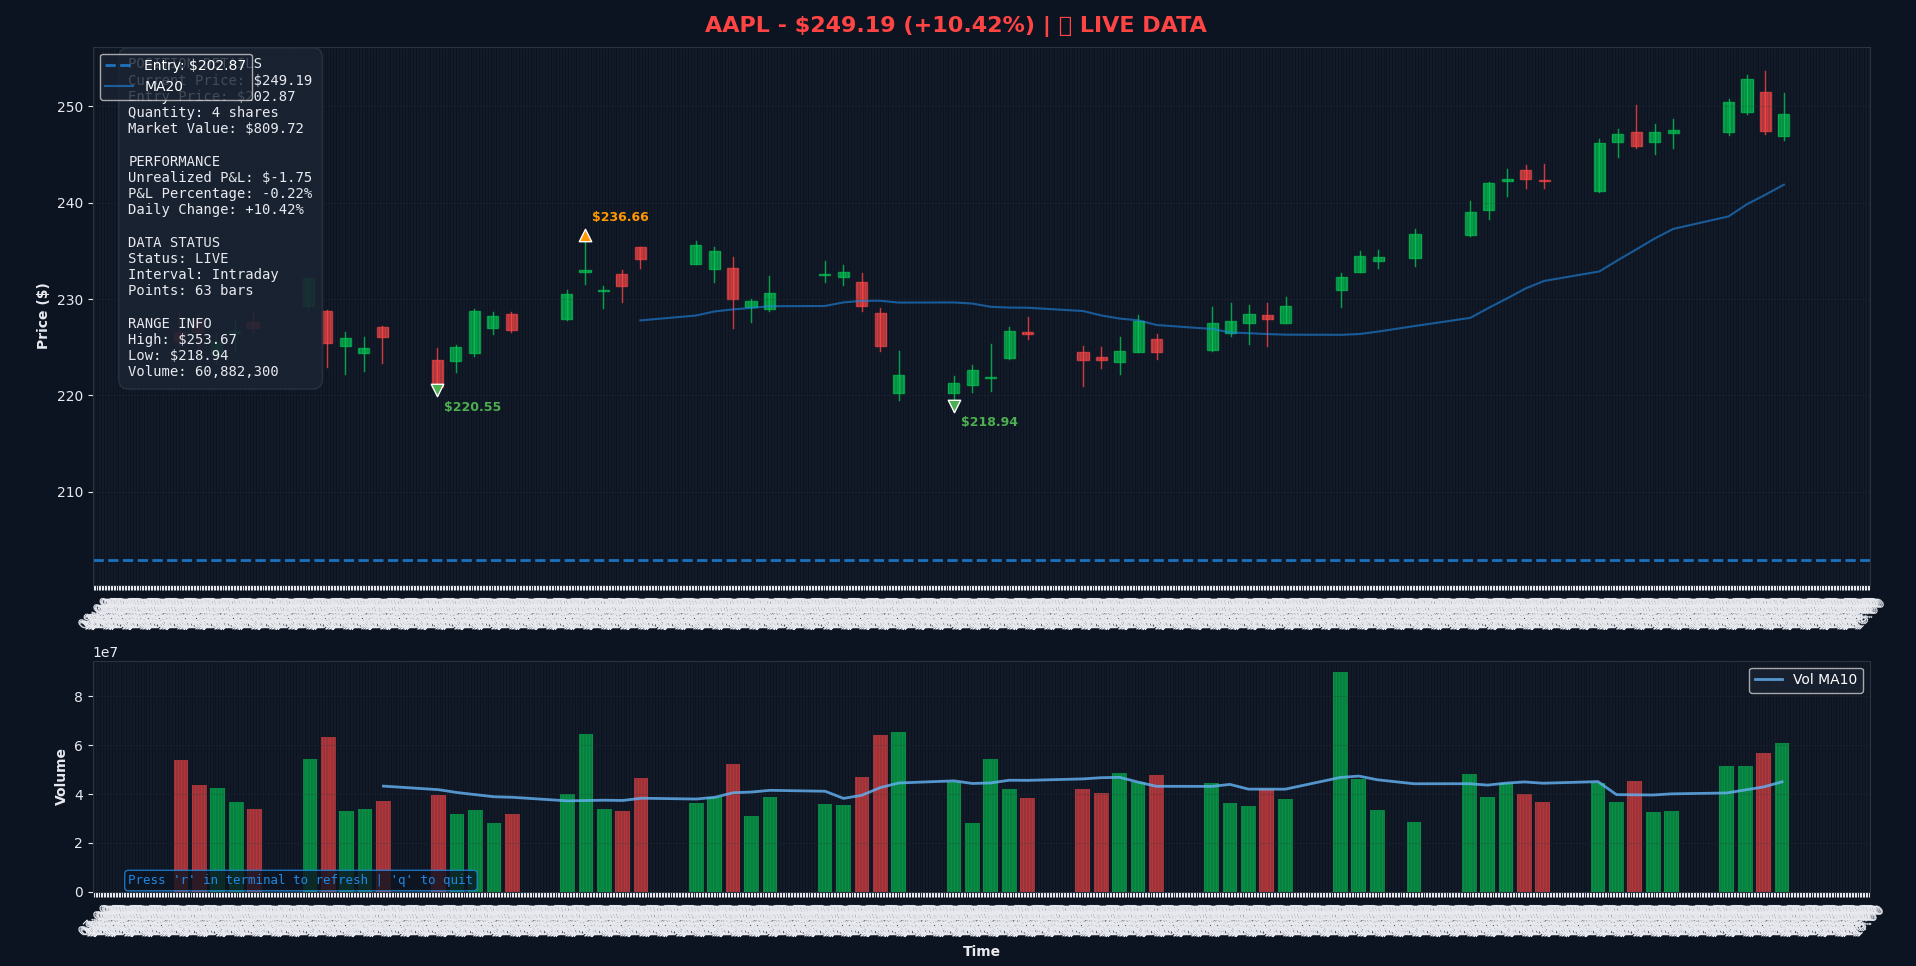
Live stock tracking (AAPL in this example)


Inspiration
We were passionate about algorithmic trading and aimed to create a practical tool using real market data and quantitative strategies. After exploring statistical arbitrage and observing how quant firms leverage math-based models to exploit market inefficiencies, we decided to develop our own trading script with API integration and a functional backtester.
What It Does
The script identifies pairs of stocks with strong historical correlation and simulates trades when their price ratio deviates significantly from the mean—a classic statistical arbitrage strategy.
Key Functionalities:
- Fetches historical and live price data
- Identifies co-integrated stock pairs
- Simulates trade entry/exit based on z-score thresholds
- Visualizes trading signals, executed trades, and performance metrics
- Tracks simulated portfolio value over time
How We Built It
We began by analyzing public GitHub repositories and existing trading models to understand their structure. Initially, we built on these models, then designed our own modular framework using:
- Alpaca API for brokerage account access and real-time trade data
- yfinance for historical stock price data
- pandas and NumPy for time series data manipulation
- matplotlib and Plotly for visualization and interactive dashboards
Our early backtester produced unreliable results, prompting us to pause and study statistical arbitrage concepts like cointegration, mean reversion, and z-score triggers. We then rewrote the core logic from scratch to ensure accuracy.
Challenges We Ran Into
- The initial backtester gave misleading results due to flawed market execution assumptions
- API rate limits required efficient caching and request throttling
- Grasping statistical concepts like spread stability and stationarity was time-consuming
- Implementing real-time visualization and strategy monitoring posed technical challenges
Accomplishments That We're Proud Of
- Developed a working statistical arbitrage model that simulates realistic trades
- Successfully integrated multiple APIs for historical and live data
- Built a reliable backtester from scratch
- Created clear visualizations to monitor strategy performance
- Gained a deep understanding of quantitative trading mechanics
What We Learned
- How to integrate financial APIs (Alpaca, yfinance) for real-time and historical market data
- Fundamentals of statistical arbitrage, including mean reversion and cointegration
- How to structure, test, and debug a trading strategy
- The importance of effective visualizations for strategy analysis and iteration
- Techniques for building and refining a backtester to mimic real-world trading
What's Next for Alpaca Quantitative Finance Script
- Support additional strategies (e.g., momentum, volatility-based trading)
- Enable automated trade execution via Alpaca’s paper trading or live accounts
- Enhance performance metrics (e.g., Sharpe ratio, max drawdown)
- Deploy as a web-based dashboard using Flask or Streamlit
- Implement robust error handling and risk management features


Log in or sign up for Devpost to join the conversation.