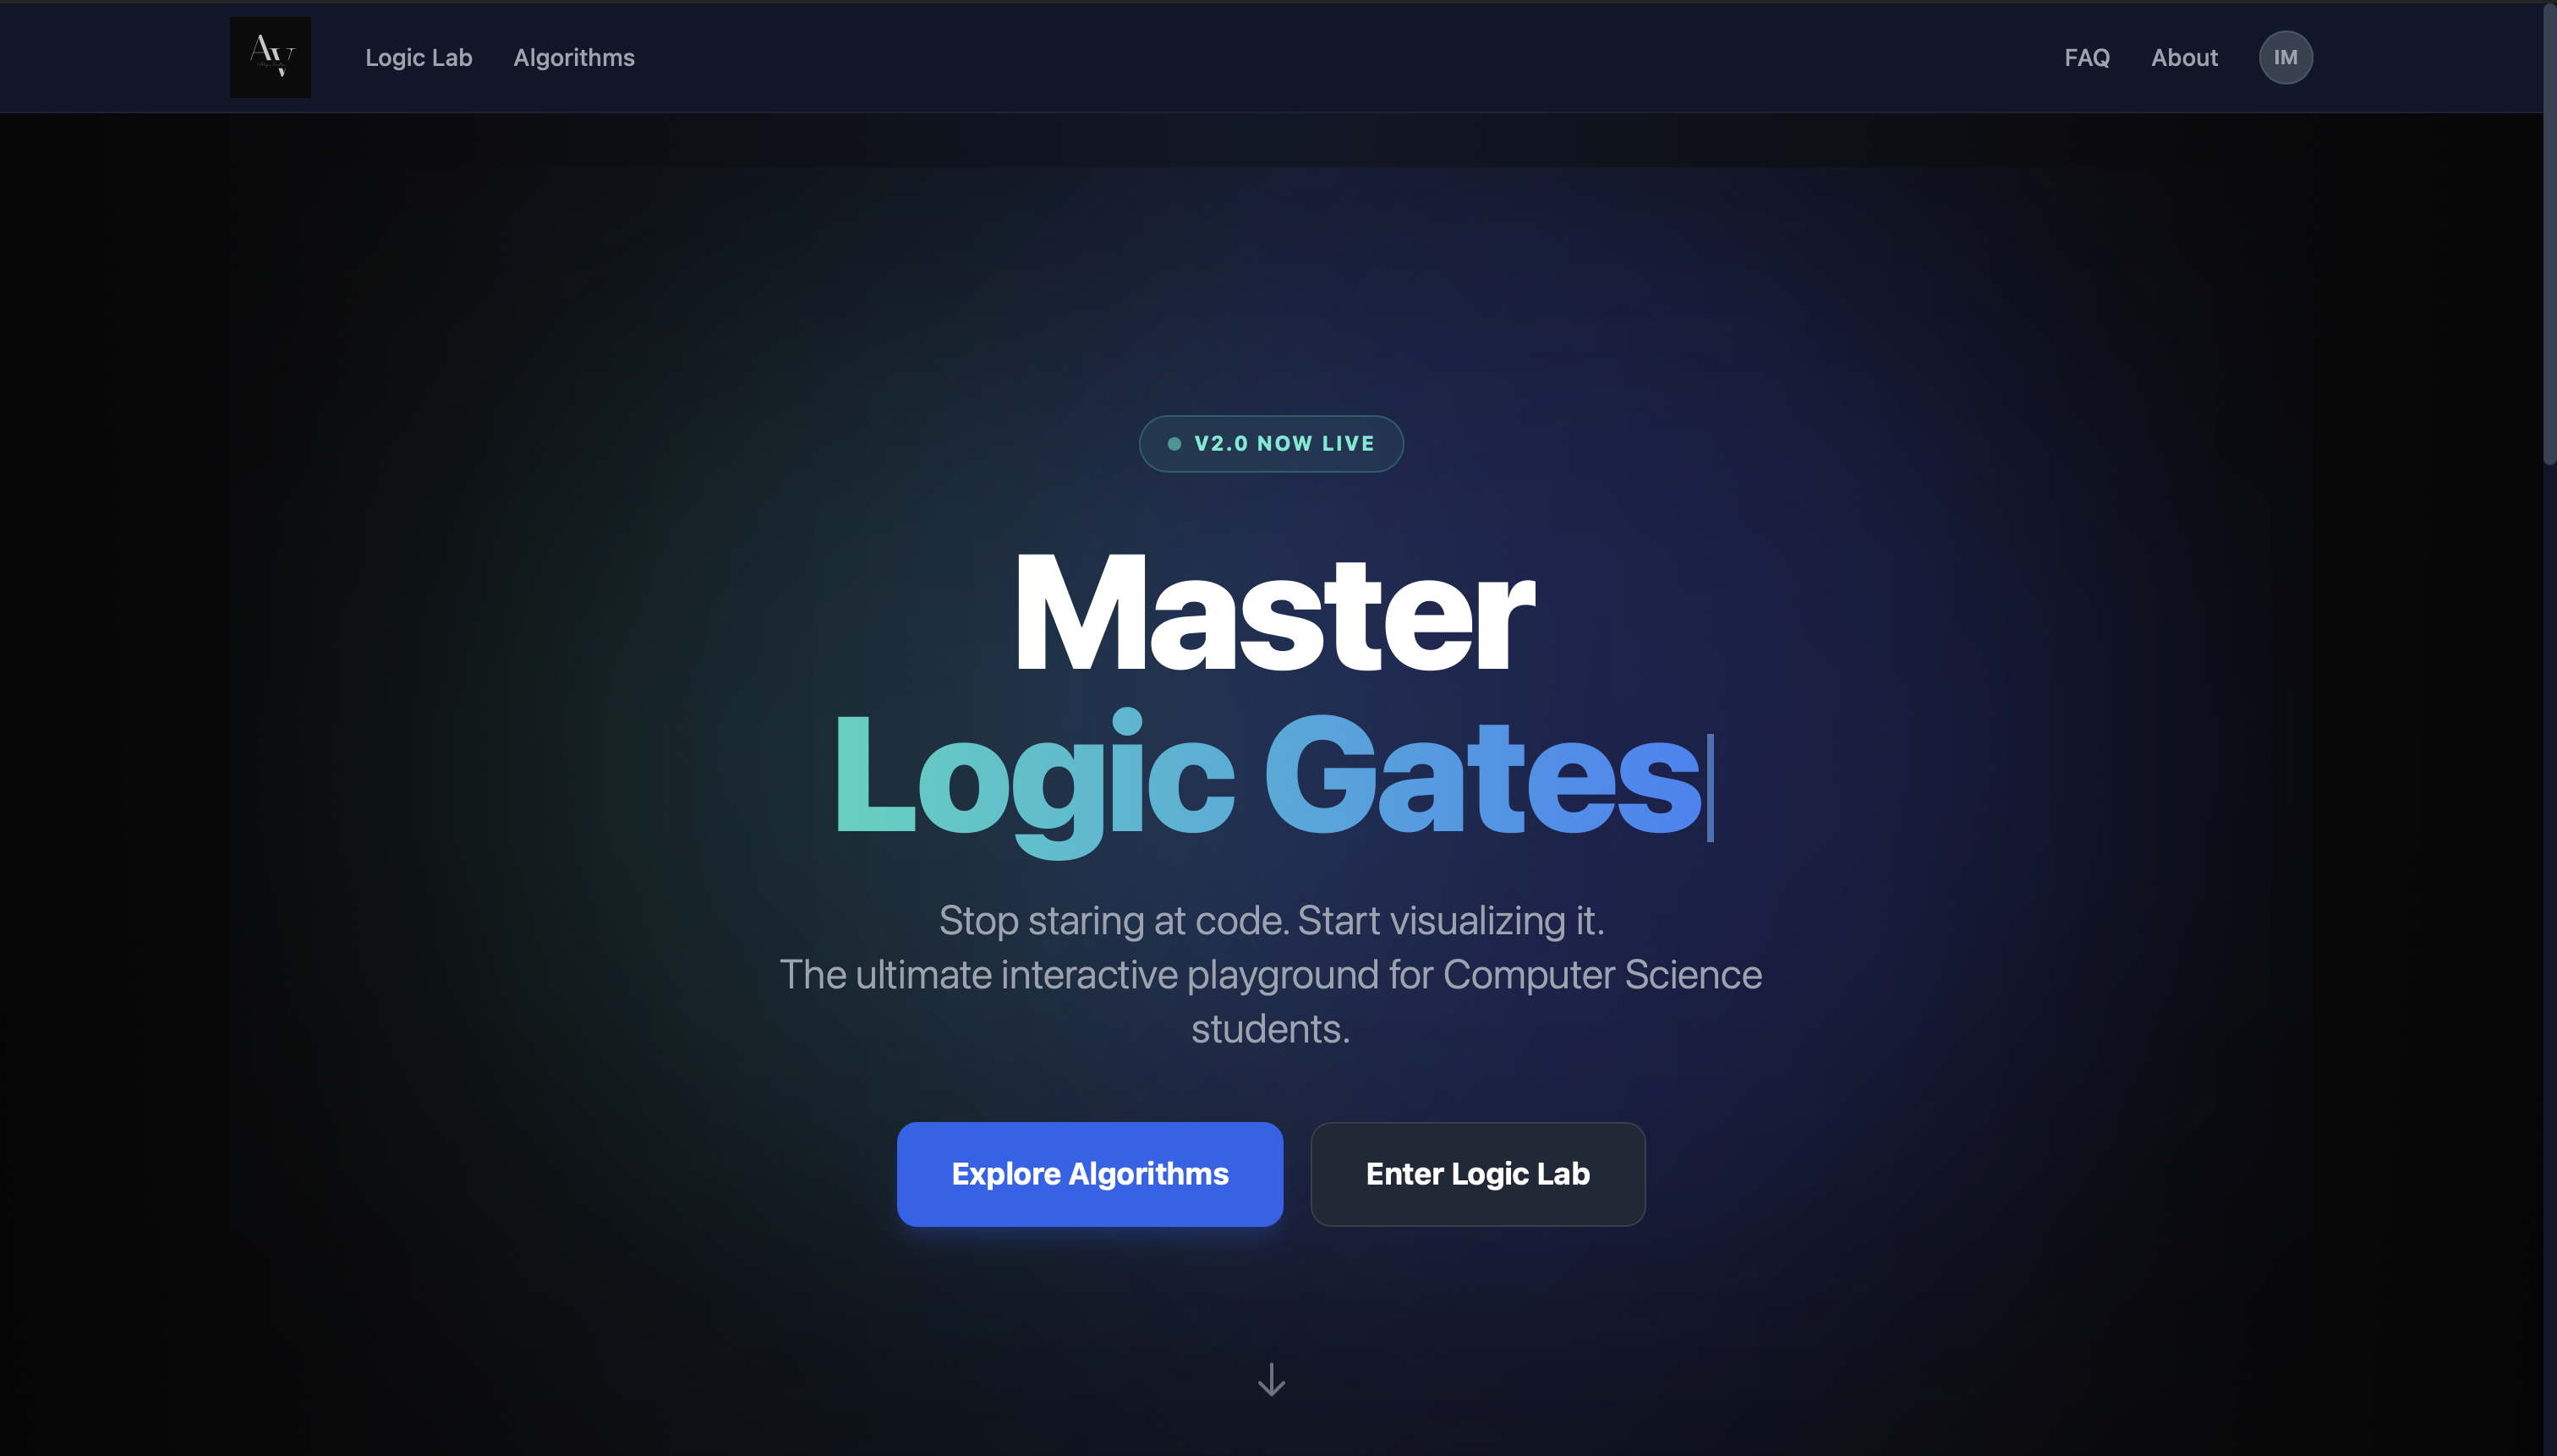
Inspiration
As a Computer Science student, I realized that abstraction is the enemy of intuition. We spend hours staring at static textbook diagrams of logic gates or tracing recursive sorting algorithms on paper, but we rarely get to see the data move. I wanted to build a bridge between the math and the metal. I was inspired to create a tool where I could type a raw Boolean expression like ( (A + B) \cdot C' ) and instantly see the electricity flow through the wires, or watch a Binary Search discard half an array in real-time.
What it does
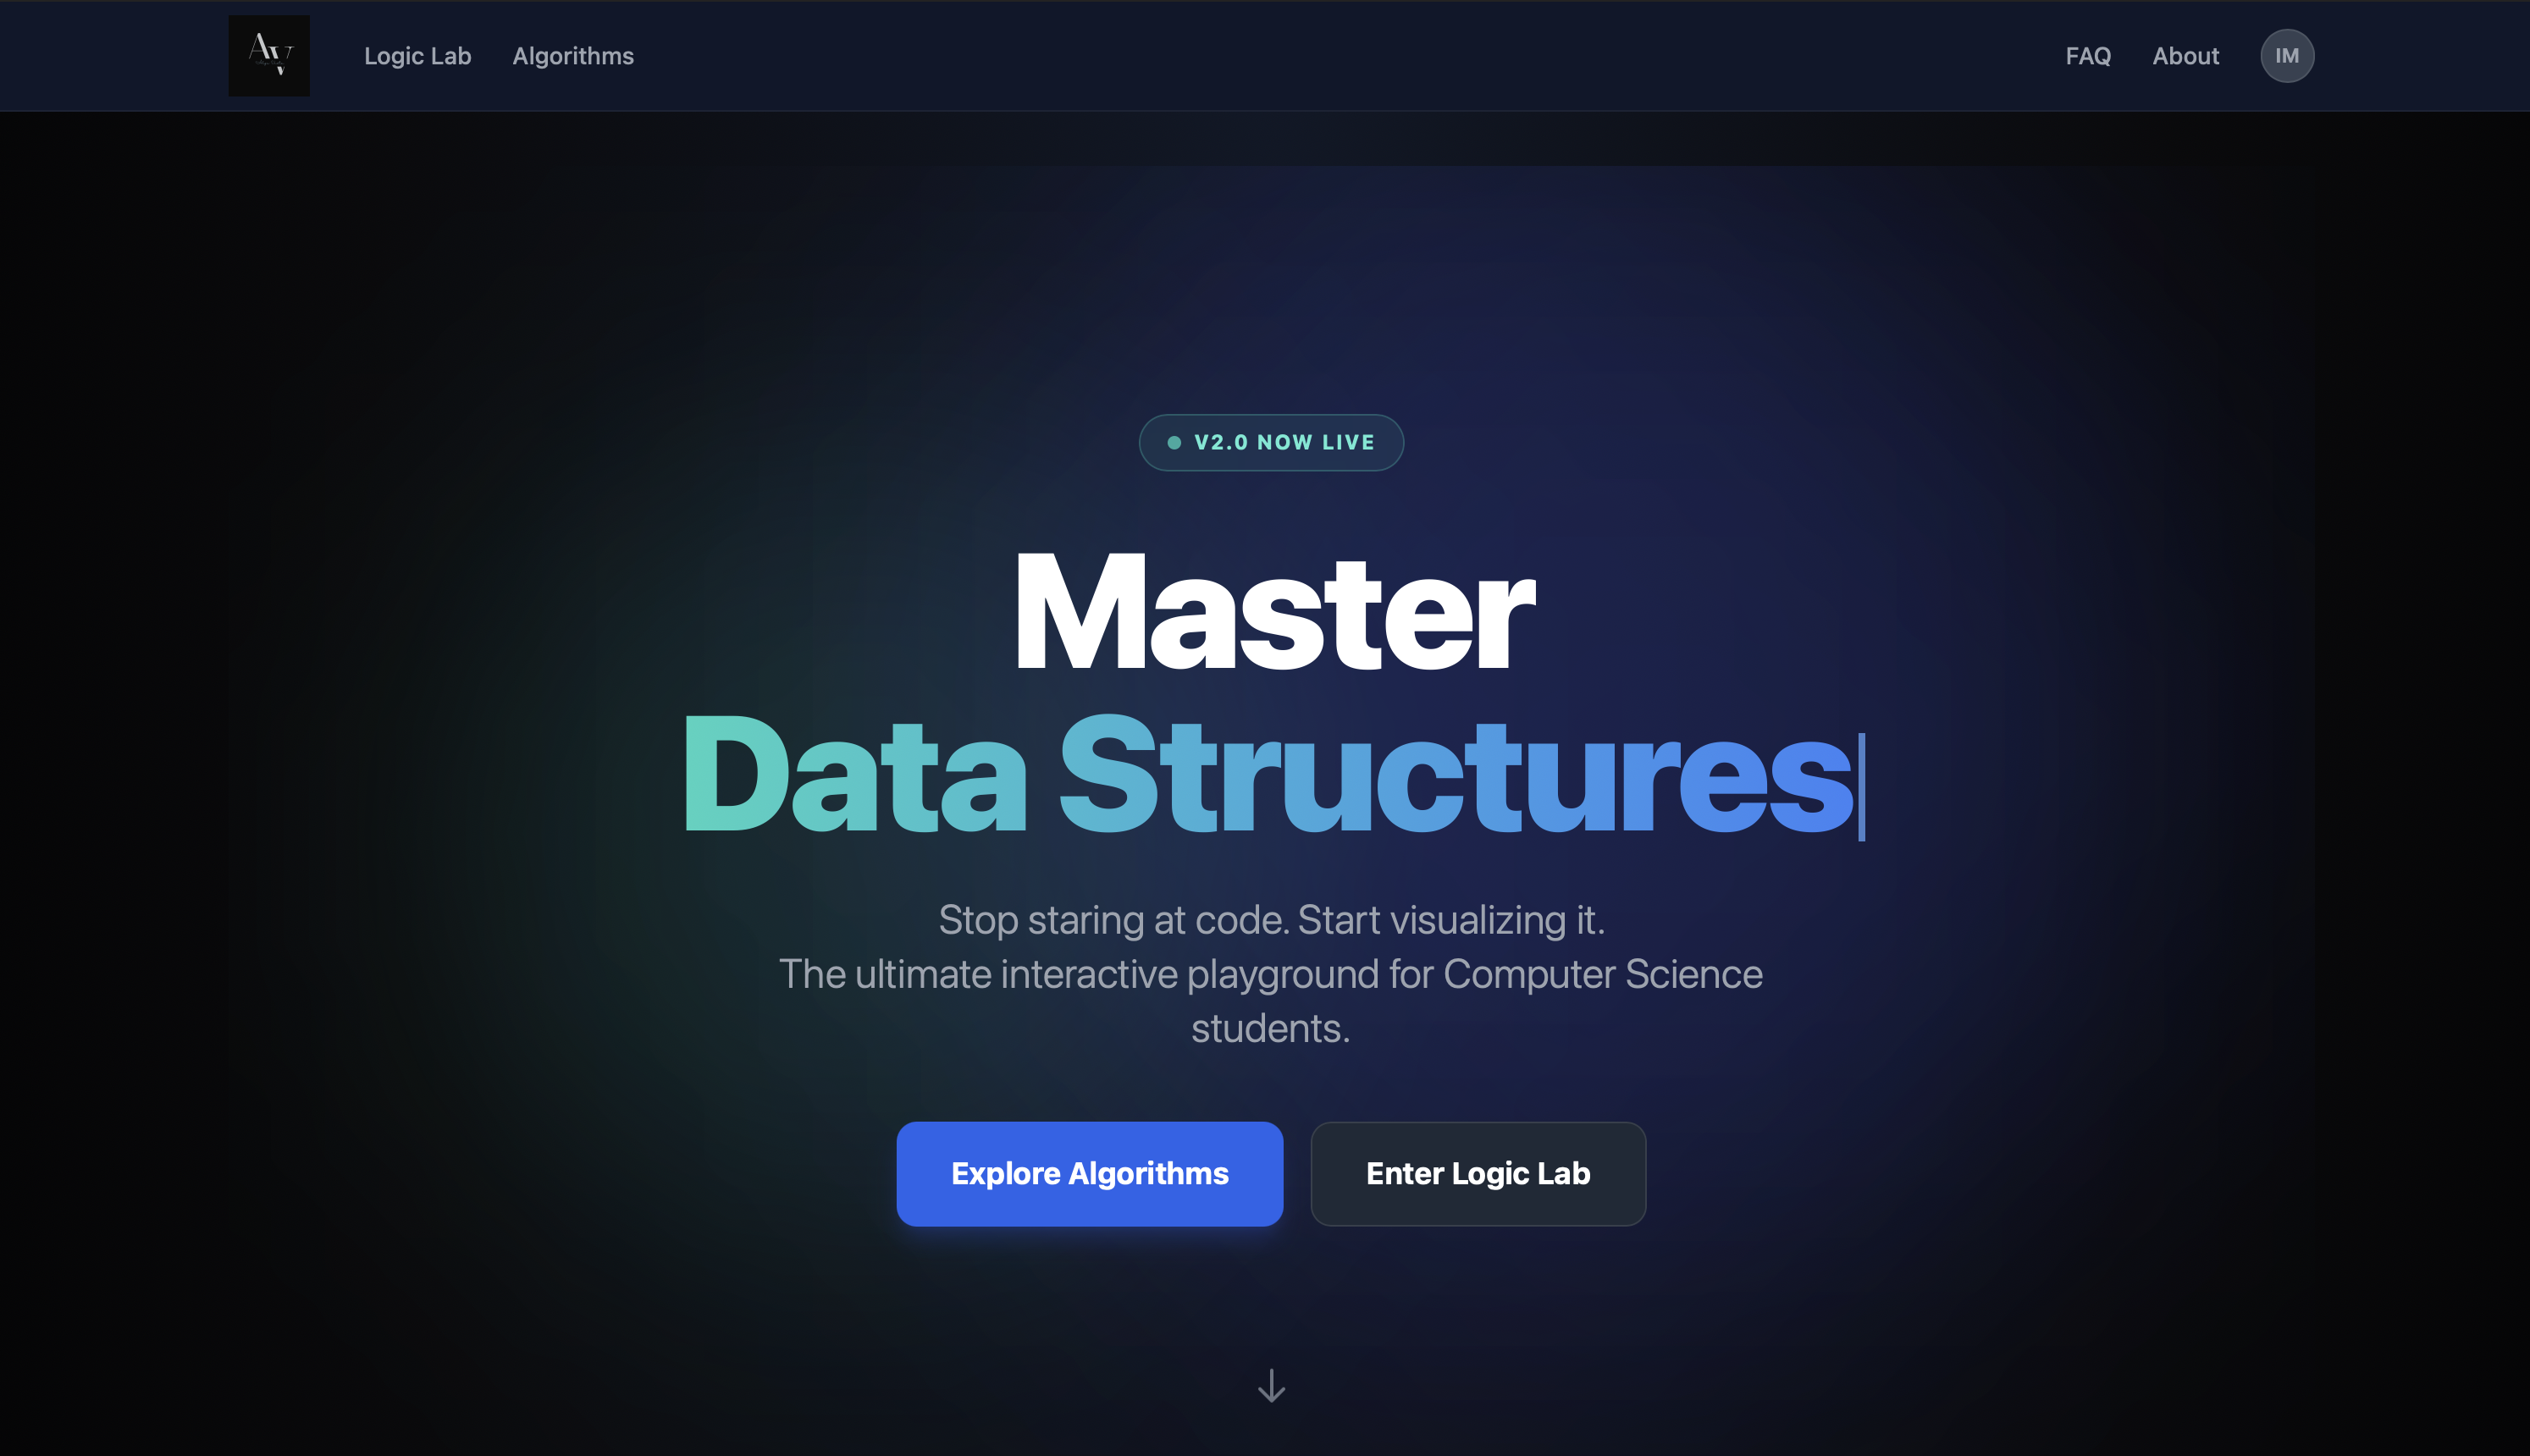
AlgoVista is an interactive visualization suite divided into two core engines:
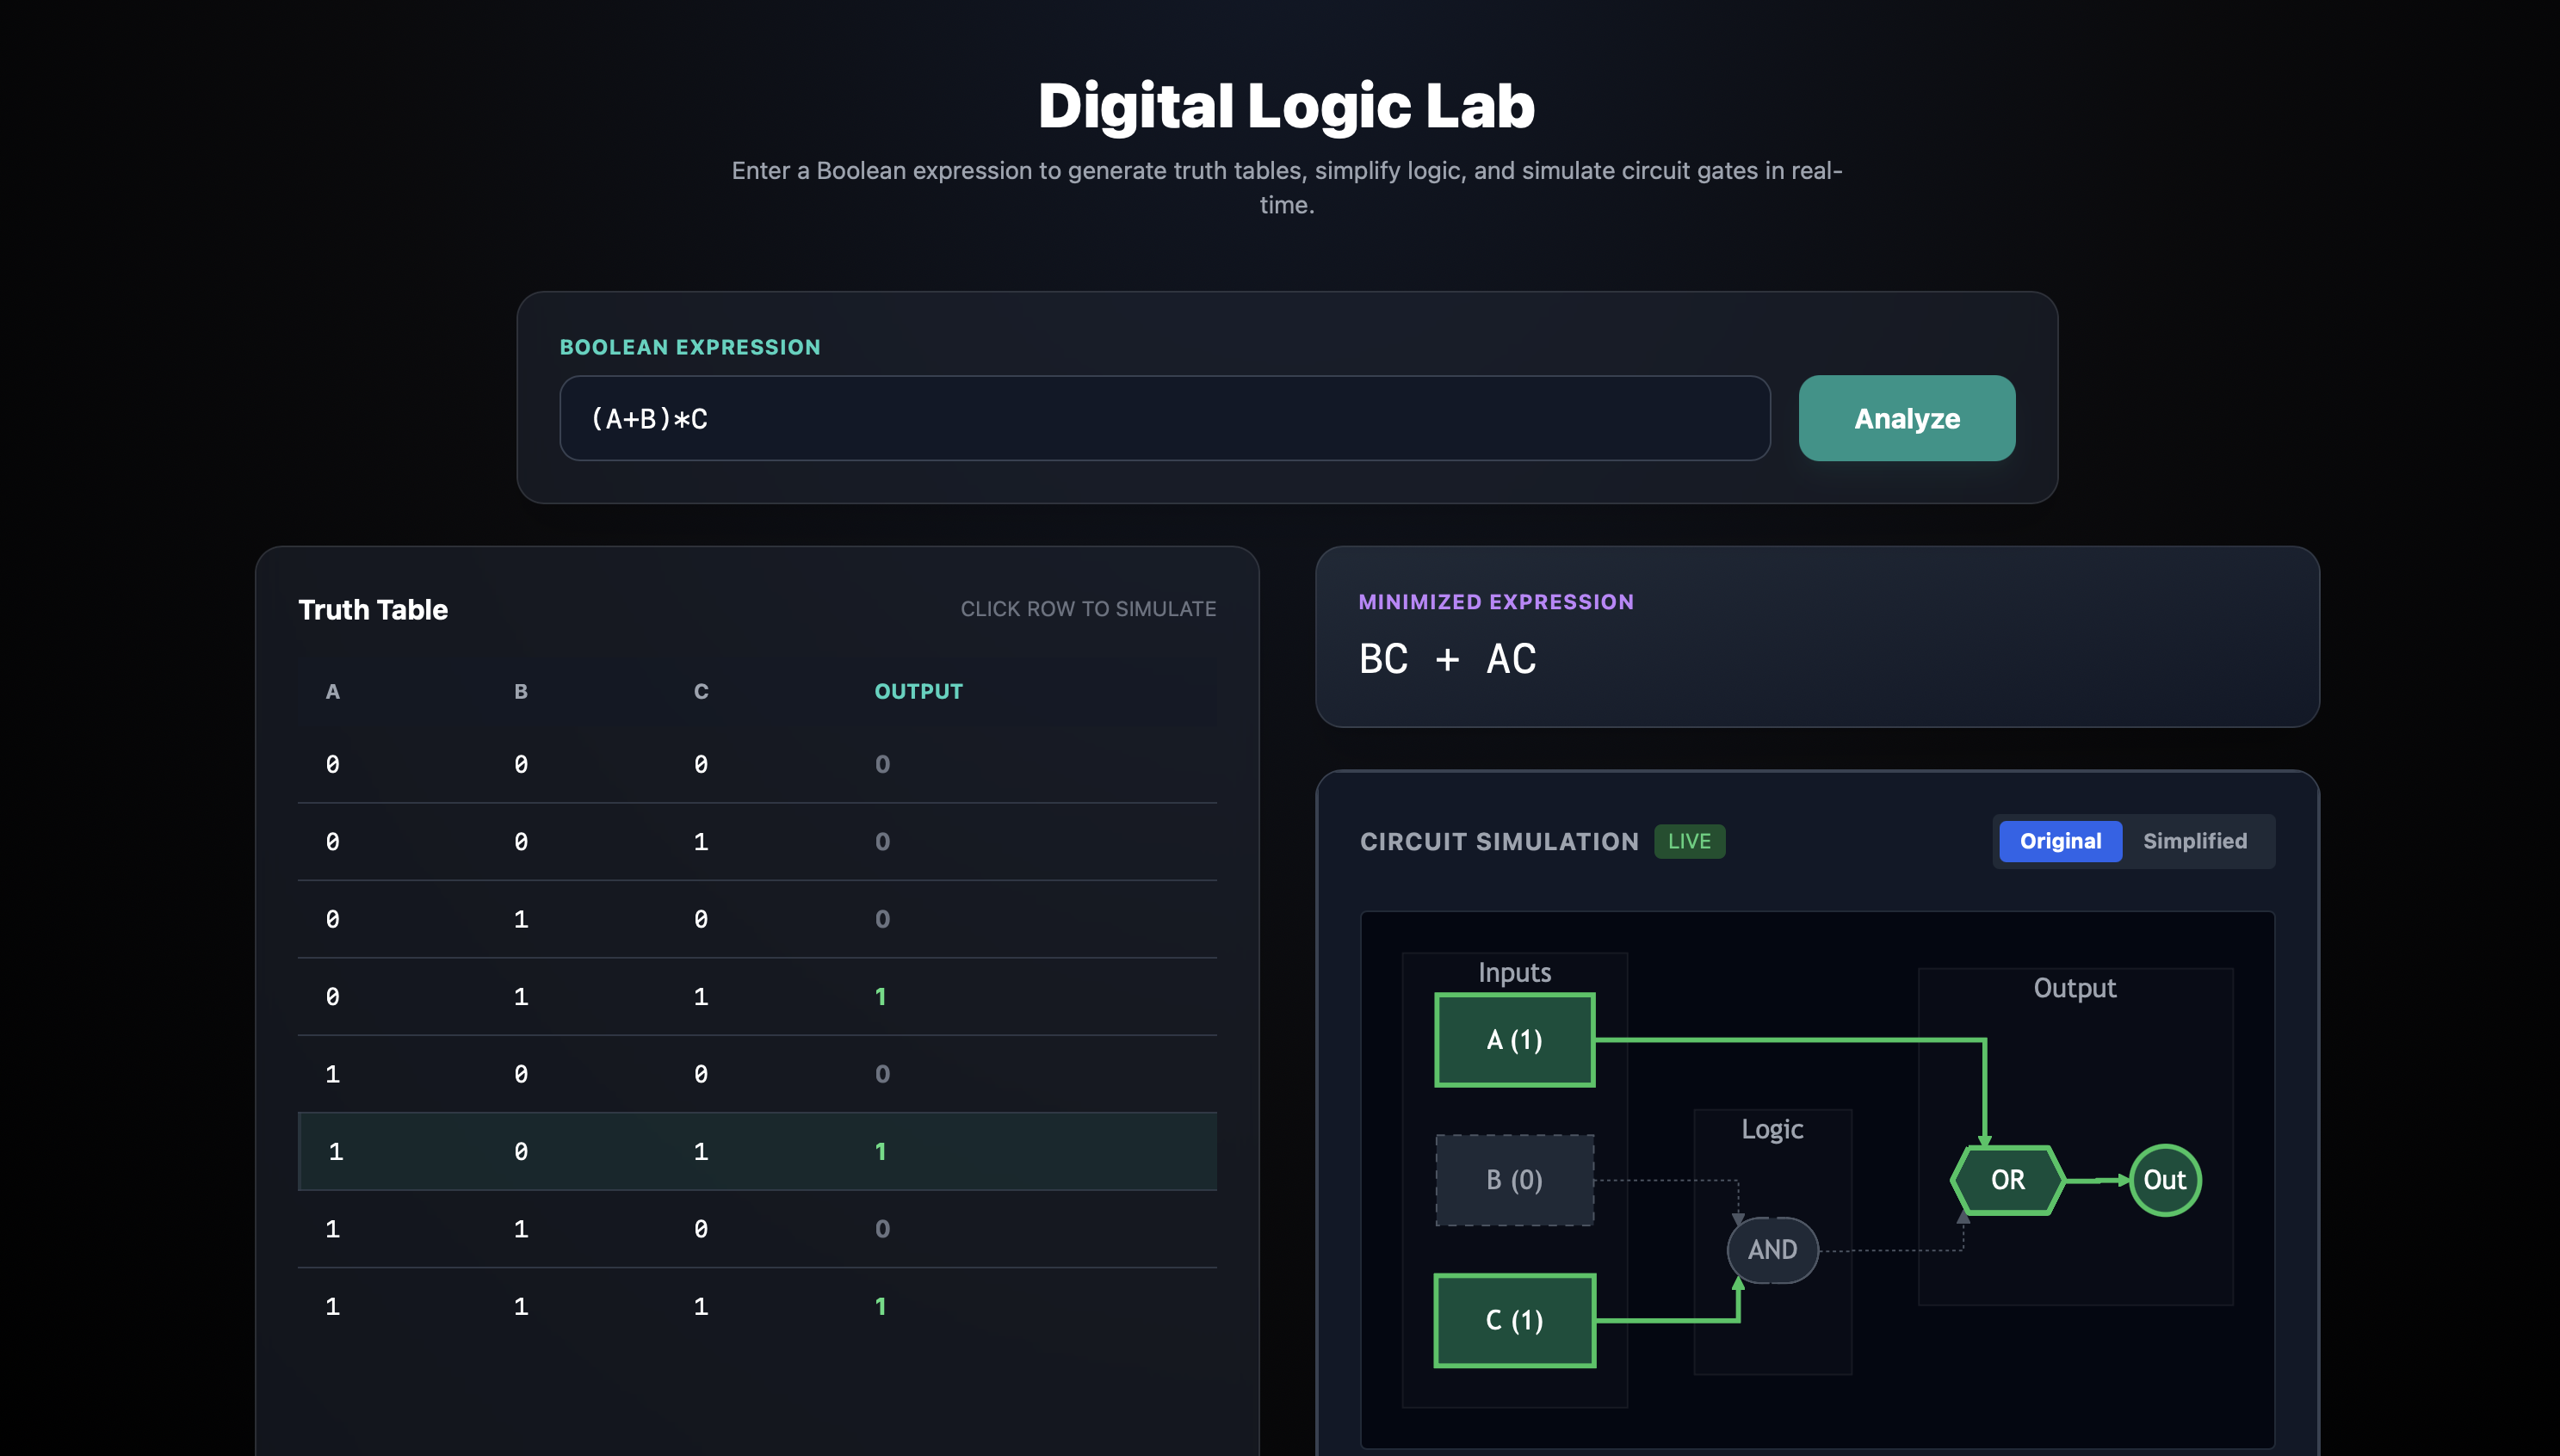
- Digital Logic Lab:
- Expression Parsing: Users type raw boolean formulas (e.g., A + B).
- Truth Table Generator: Instantly calculates all possible input/output scenarios for (2^n ) rows.
- Circuit Simulation: Renders a dynamic circuit diagram where gates and wires light up (Green/Gray) based on real-time user inputs.
- Logic Simplification: Uses algorithmic logic to minimize complex expressions into their most efficient forms.
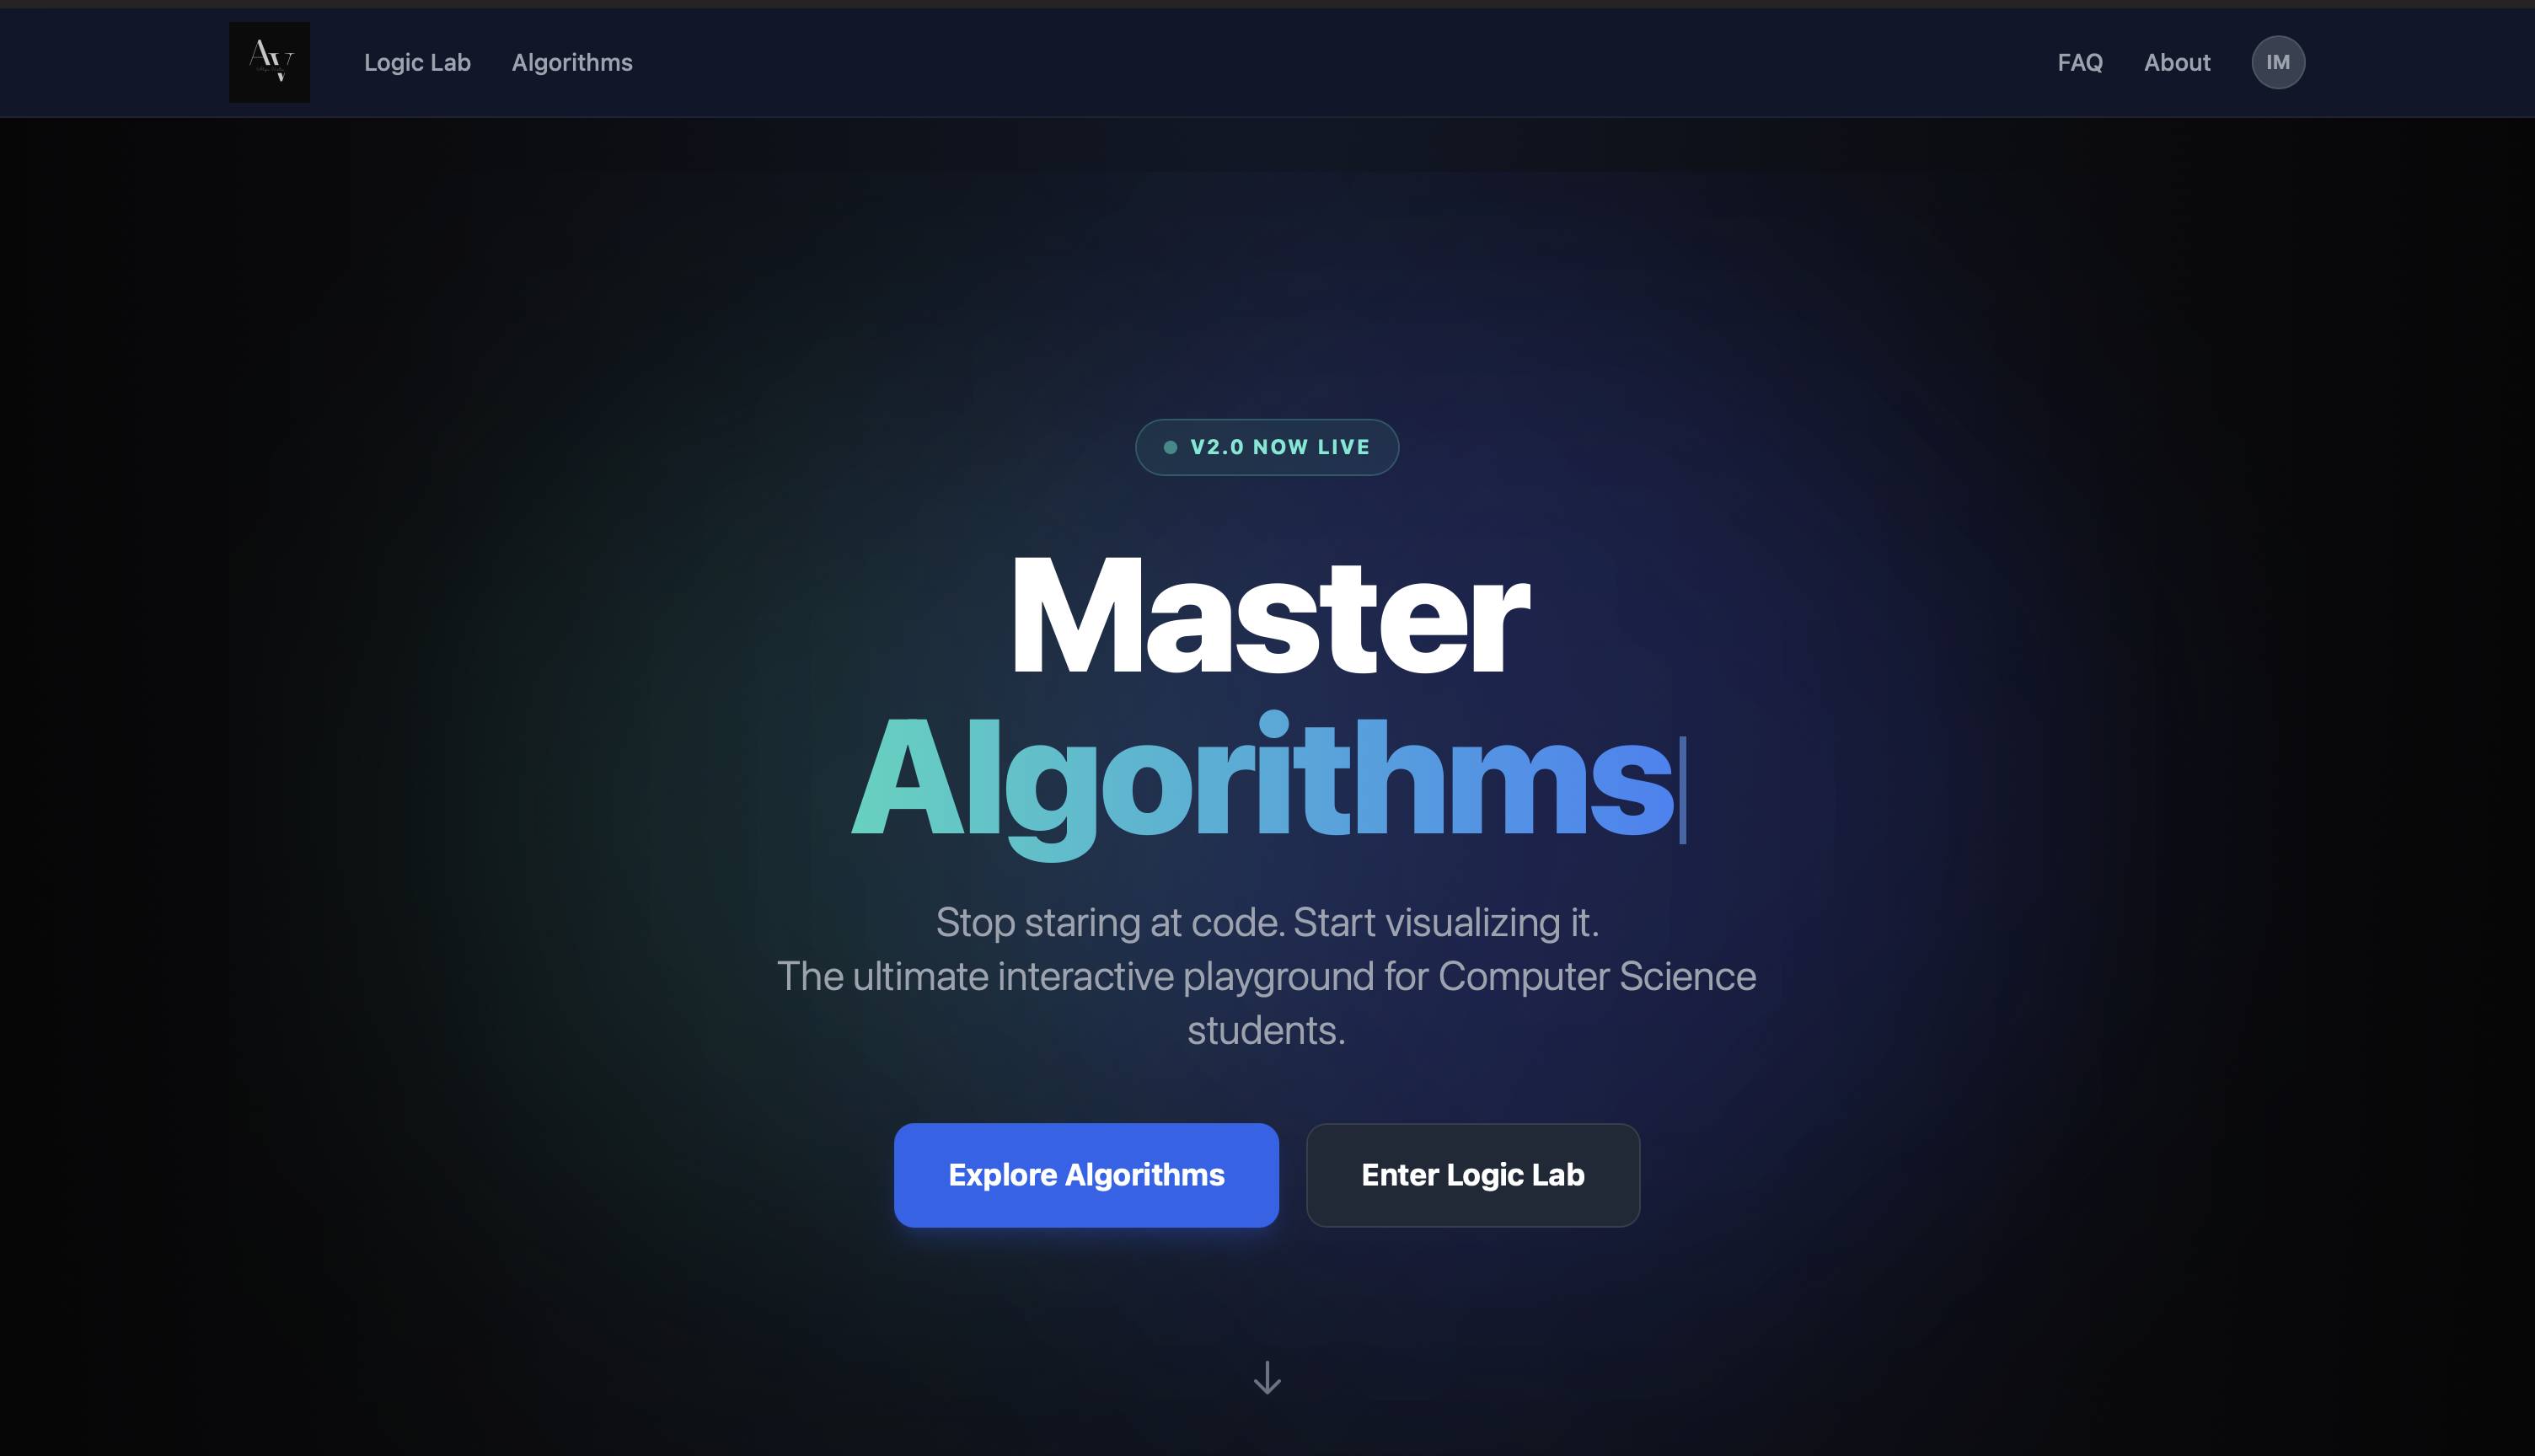
2.Algorithm Arena:
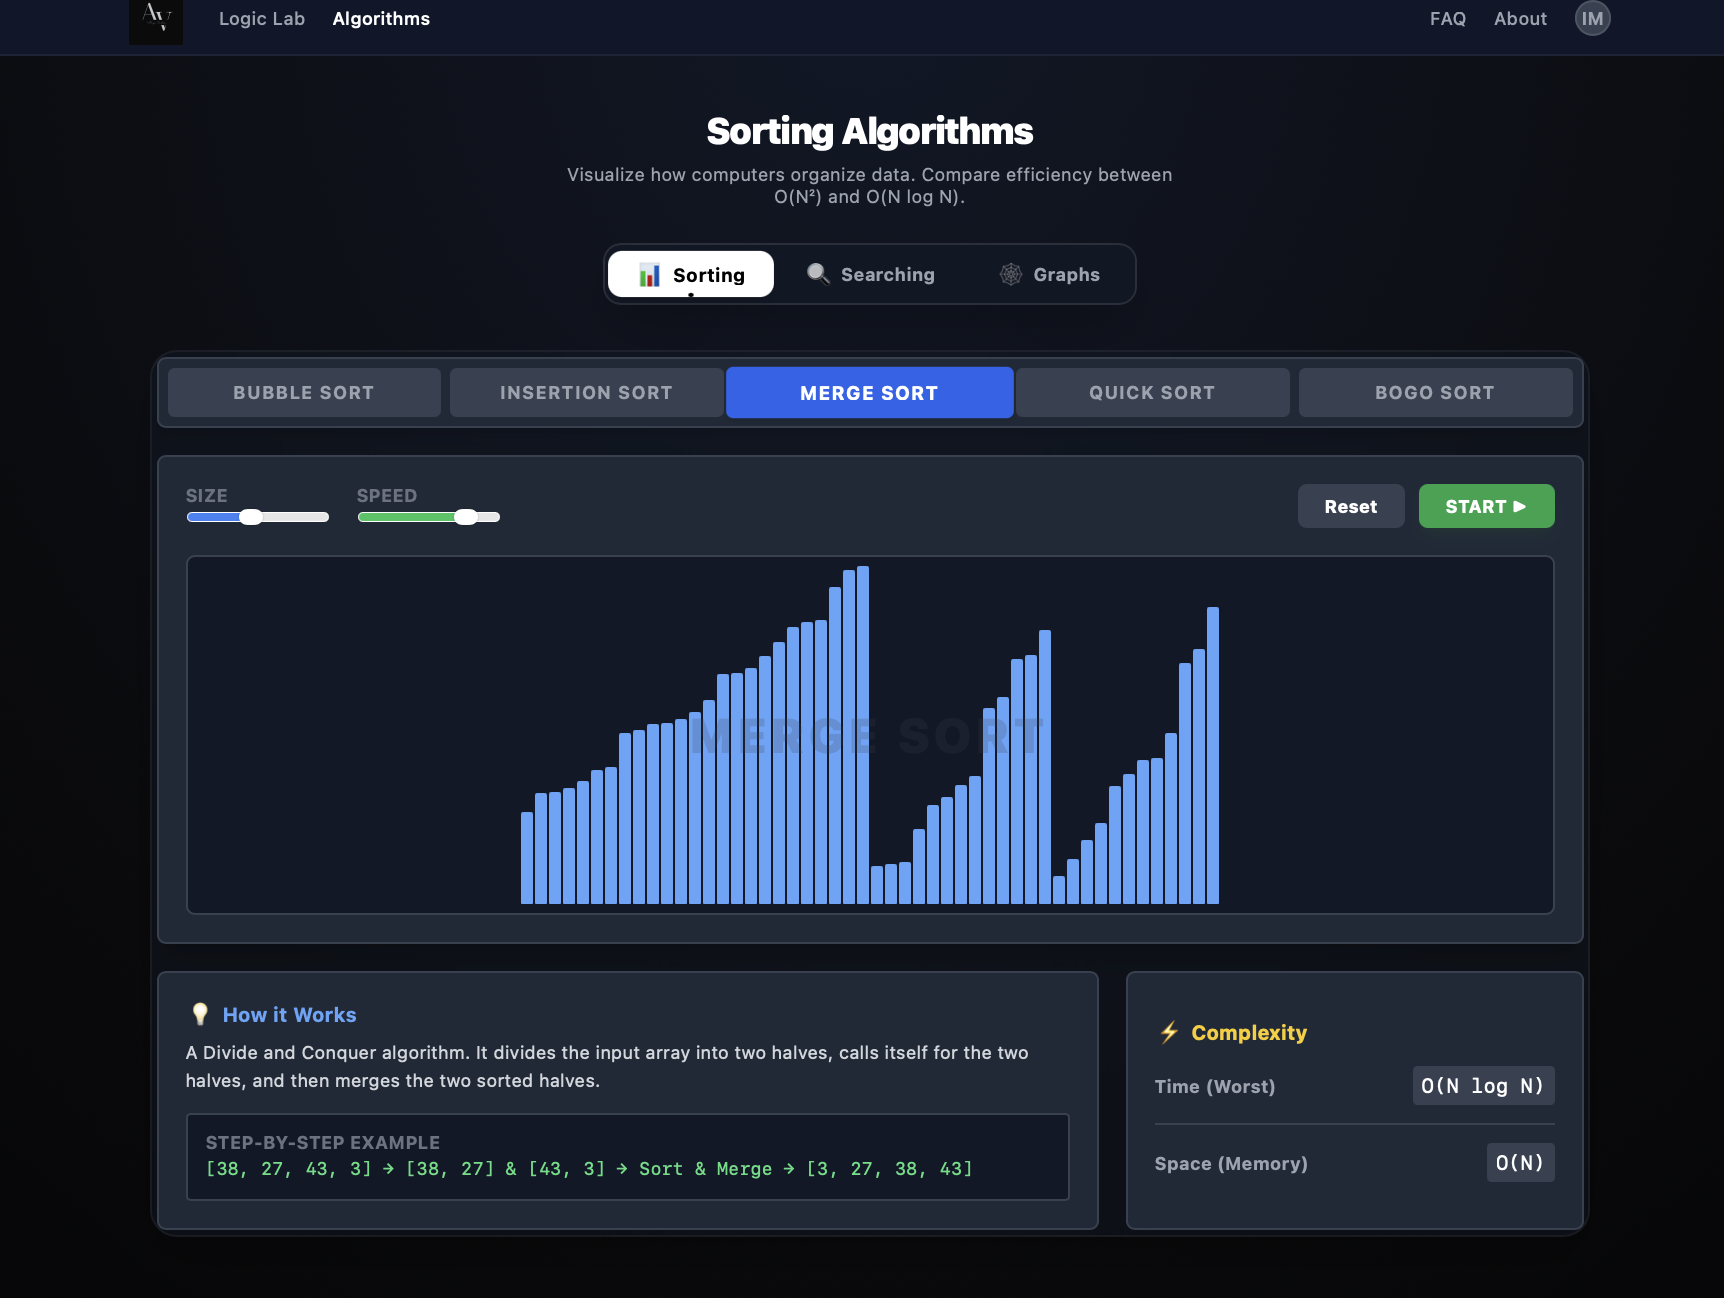
- Sorting Visualizer: Experience the mechanics of efficiency with a suite of sorting algorithms, ranging from the classic Bubble Sort and Insertion Sort to the highly efficient Merge Sort (O(nlogn)) and Quick Sort. Includes a demonstration of Bogo Sort (O(n⋅n!)) to highlight the importance of algorithmic design.
- Searching Visualizer: Linear Search and Binary Search.
- Custom Controls: Users can set specific target numbers and dynamically adjust the dataset size via a slider to see how input size affects performance.
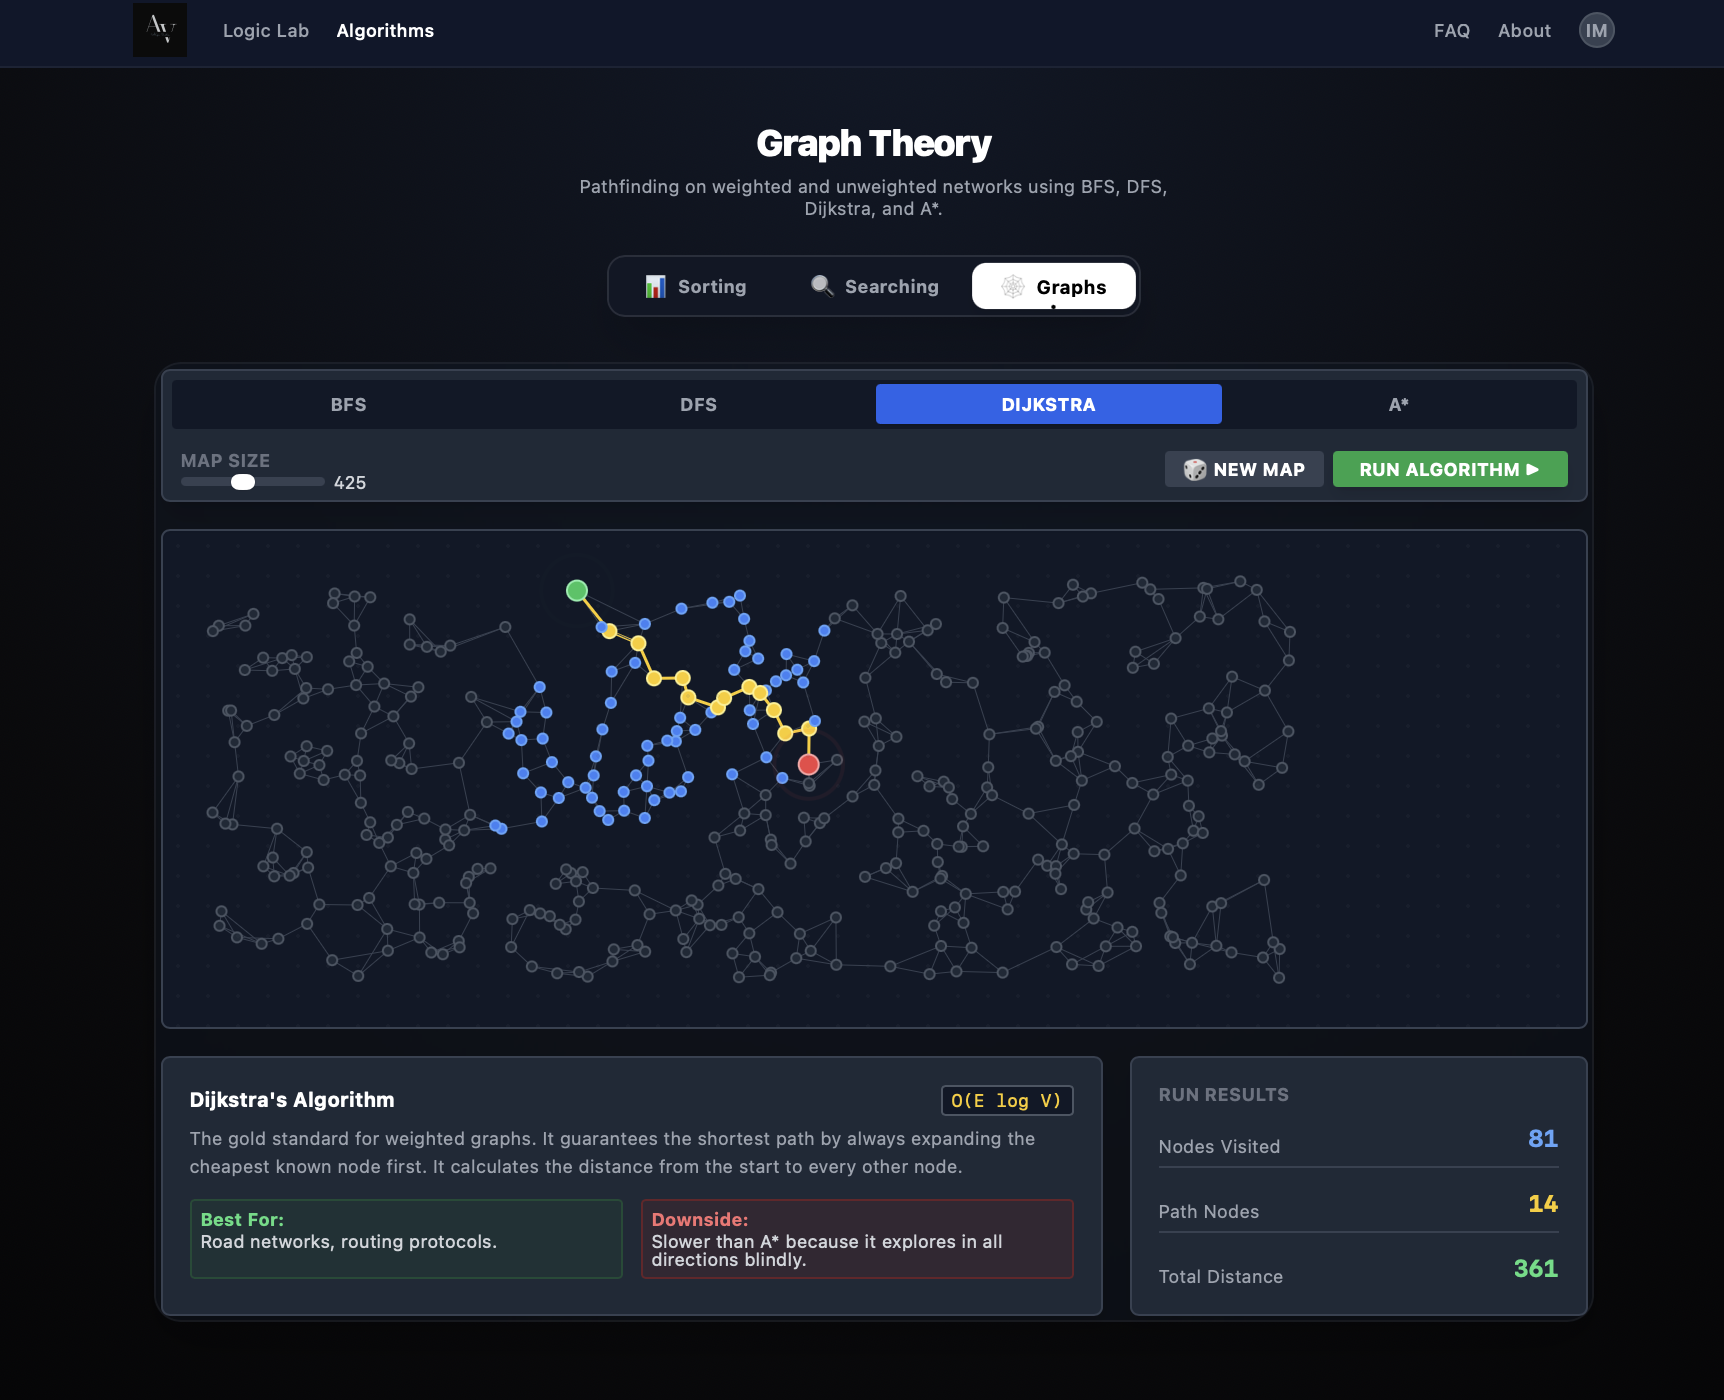
- Graph Algorithms (Pathfinding): Breadth-First Search (BFS), Depth-First Search (DFS), Dijkstra's Algorithm, and A* Algorithm
- Step-by-Step Execution: Every visualizer features a playback engine that breaks down execution into atomic steps. Color-coded animations (Yellow for comparison, Red for discard/visited, Green for found/sorted) provide immediate visual feedback on the algorithm's internal state.
How we built it
This project was built as a responsive Single Page Application (SPA) using React (Vite) for performance and Tailwind CSS for the glassmorphic design system.
Logic Engine: I wrote a custom parser in JavaScript to tokenize boolean strings and evaluate operator precedence for the Truth Table generation.
Diagramming: I integrated Mermaid.js for the circuit generation but wrote a custom wrapper to inject CSS styles, allowing for the unique "translucent" nodes and dynamic coloring of wires based on active states.
State Management: I used React's useRef and useEffect hooks to manage the asynchronous timing of algorithm visualizations, ensuring the UI updates synchronized perfectly with the logic steps without freezing the browser.
Challenges we ran into
Mermaid.js Customization: The library is great for standard charts, but it fights against custom styling. Making the Input and Logic subgraphs translucent (glassmorphism) required manipulating the SVG generation string directly in the React component.
Animation Sync: Handling the "speed" of sorting/searching algorithms was tricky. React state updates are asynchronous, so I had to implement a custom timeout handler to ensure the visual highlighting didn't lag behind the internal logic loop.
Accomplishments that we're proud of
The "Live" Circuit: Seeing the wires light up instantly when a user clicks a Truth Table row feels magical. It turns a static diagram into a living simulation.
UX Polish: I'm proud of the small details, like the auto-scroll feature that guides the user's eye from the table to the circuit, and the "Smart Reset" that regenerates arrays automatically when the slider moves.
What we learned
Algorithm Internals: Implementing Binary Search visually forced me to handle every edge case (like even vs. odd array lengths) that I usually ignore when just using .find().
DOM vs. Virtual DOM: I learned when to let React handle the render and when to directly manipulate DOM style properties for high-performance animations (60fps) to avoid expensive re-renders during sorting.
What's next for AlgoVista by lone-wolf
Since this is a solo project, I have the freedom to iterate fast. The roadmap includes:
Trees and various tree related Algorithms: Adding visualizers for BFS, DFS transversal and searching Algorithm.
Export Feature: Allowing students to download their simplified circuit diagrams as PNGs for their lab reports.
Mobile Optimization: Further refining the Truth Table view for mobile screens to help students study on the go.
Built With
- css
- javascript
- mermaid.js
- node.js
- react.js(vite)
- tailwind
- useeffect)-for-managing-algorithm-animation-frames.-styling:-tailwind-css-for-a-modern


Log in or sign up for Devpost to join the conversation.