-
-

Title Page
-

List of Missing Children
-

A Sample Page for a Missing Child Report
-
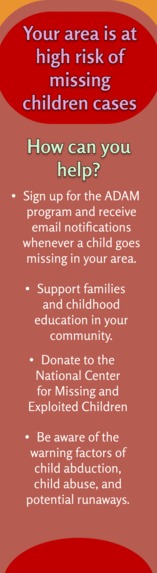
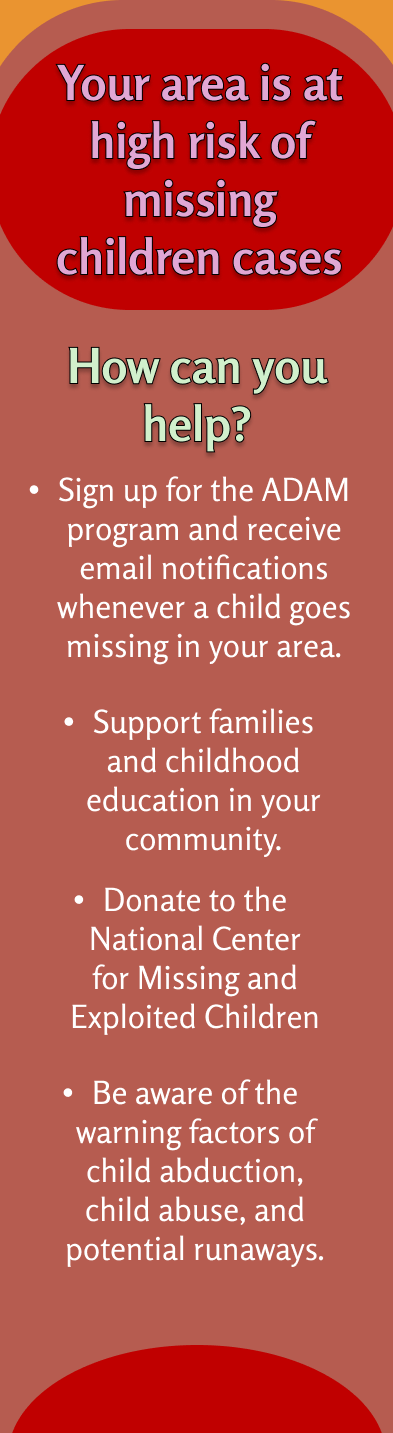
Red Alert Screen


Project Submission Categories
We will be submitting for the HPCC Help Missing Kids Challenge, Like a Good Neighbor State Farm Challenge, Best Overall Challenge, and First Time Hacker Challenge
Inspiration
What inspired our team was hearing about the various challenges within the hackathon in the opening ceremony. Once hearing the sponsors' challenges, we immediately had an objective to create something that would make the community more aware of missing children nearby. We initially thought of creating an alert system similar to the ADAM Program, but we ultimately decided to make an app with multiple functions that would help with bringing a child back home.
What it does
The app has 4 tabs with different functions:
Tab 1—The Search: A user inputs the city that they currently live in. For this demo, we're putting in Atlanta.
Tab 2—Reports: The app fetches data from the network to display all the missing child reports near the city that gets searched. For simplicity's sake, the app displays 8 out of 15 reports right now. When you click on a child's picture, it should pull up a page with all their information and a link to the MCNEC network to submit a sighting report.
Tab 3—Resources: Along with retrieving missing child reports, the app gives a list of nearby police, fire, and hospital services that someone who rescues a missing child can go to.
Tab 4—Danger Level of City: While we haven't been able to analyze the data fully, the idea is that we would find different factors that correlate with the amount of missing child reports. We would then make three ranges for each factor and allocate a certain amount of points for each city.
For example, if high unemployment rates correlate with missing children, then we would come up with 3 ranges: < 5%, 5-15%, and > 15%. If the unemployment rate is less than 5%, then the city would receive 1 point. If the unemployment rate is between 5-15%, the city would receive 2 points. If the unemployment rate is over 15%, then the city would receive 3 points.
Cities that receive mostly 3s for all factors would be considered High Risk. Cities that receive a mix of 2s and 1s for all factors would be considered Medium Risk. Cities that receive mostly 1s for all factors would be considered Low Risk. Because we don't know these factors, for our demo we just selected Atlanta to be a high-risk area, even though we aren't positive about it. The page for high-risk cities will be red while for medium-risk it's yellow and low risk is green. Regardless of rank, the page will still include a section on how a person can help with lowering missing children cases.
How we built it
There are three main components to this project: the data, the app, and Figma.
For the Data: So far, what has been built are four functions: the missing child report finder, the fire station finder, the police department finder, and the hospital finder. Each function sorts through the data and outputs the data entries found within a certain city and state. For example, when searching for Atlanta, Georgia, the functions show that there are 15 missing children reports, 23 hospitals, 44 police, and 49 fire stations, along with information about each location. The information about each location that is exported goes to that 3rd tab about different available resources for people who found a missing child or want to help. Along with that, the information can help with the data analysis. Because we weren't able to properly analyze the data, the steps we would have taken with the data analysis will be detailed in the Further Ideas/Continuations section.
For the App: We built a basic app in React Native and tested it with Expo Go. The app consisted of code entirely in JavaScript.
For Figma: Figma was used to create a prototype front-end for the application that consists of four different tabs.
Challenges we ran into
For the Data: Because ECL is a completely new coding language for us, we kept having syntax-related issues and other issues regarding sorting out the data. Thankfully, HCCP was incredibly helpful with troubleshooting our code and helping us understand how it functions. Because of that, we were later able to properly manipulate pre-existing code to meet our needs.
For the App: Our main challenge was not having any app development knowledge. None of us had a solid grasp on JavaScript either, which is the language React Native uses. There was sufficient documentation on React Native, though. This made the process of learning it much smoother.
For Figma: Apart from having to get used to Figma, it was not that challenging and was relatively easy to learn.
What we learned
For the Data: Considering how ECL was a completely new coding language for all of us, we learned a lot oh how to use it for data analysis. For example, we learned what wild and keyed functions were for (to define an undefined variable within a function file), and one way to run function files (by having the module and then the function afterward). Along with that, we learned a new way to sort through a large extent of data. There are still more things we could learn like how to find the frequency of certain data points, but this project allowed us to dip our toes in ECL.
For the App: We learned about the process of developing an app and we gained knowledge in JavaScript. Having previous experience with coding helped with coding in JavaScript, but there were parts of it that we had to learn from a basic level. Props was one part of JavaScript that was new for most of us.
For GitHub: Working on a project with others allowed us to learn how to use Git as a means of collaboration.
Further Ideas/Continuations of KidFinder
For the Data: After finally solving how to sort through several data points, there is a plethora of ways to analyze the data. One method our group was thinking about was finding the top 100 cities in the data set that had the highest percentage of missing children. We could calculate this by dividing the number of missing children by the total population of that city. After that, we would pull all the available data on each of the top 100 or 1000 cities and compare the results. The best method to do this would be with several bar graphs that have corresponding ranges that would make the most sense. Those bar graphs would make it relatively easy to see the trend within the data, which will help determine what factors that cause more children to go missing.
For example, let's say a majority of the top 100 cities for missing children reports have high unemployment rates. This would indicate a factor that causes children to go missing. Since unemployment would be considered a factor, all cities will receive 1, 2, or 3 points depending on how severe unemployment is over there. The factors that would be analyzed would be the unemployment rate, education rate, poverty rate, number of police departments, fire stations, and hospitals.
For the App: We didn't have the time to encode the specific functions we wanted the app to do (i.e pull up the updated records of a child that is missing), so we used jpeg placeholders to show what a user would expect using the app. As such, the main things we would need to work app wise is just formatting everything and figuring out a way to keep the data constantly updated.
Built With
- ecl
- expo-go
- figma
- github
- javascript
- react-native

Log in or sign up for Devpost to join the conversation.