Inspiration
Our inspiration for Aishark came from the need to efficiently analyze and visualize data from various sources in real-time.
What it does
Aishark is a data analysis and visualization tool that allows users to process large datasets and generate insightful visualizations quickly.
How we built it
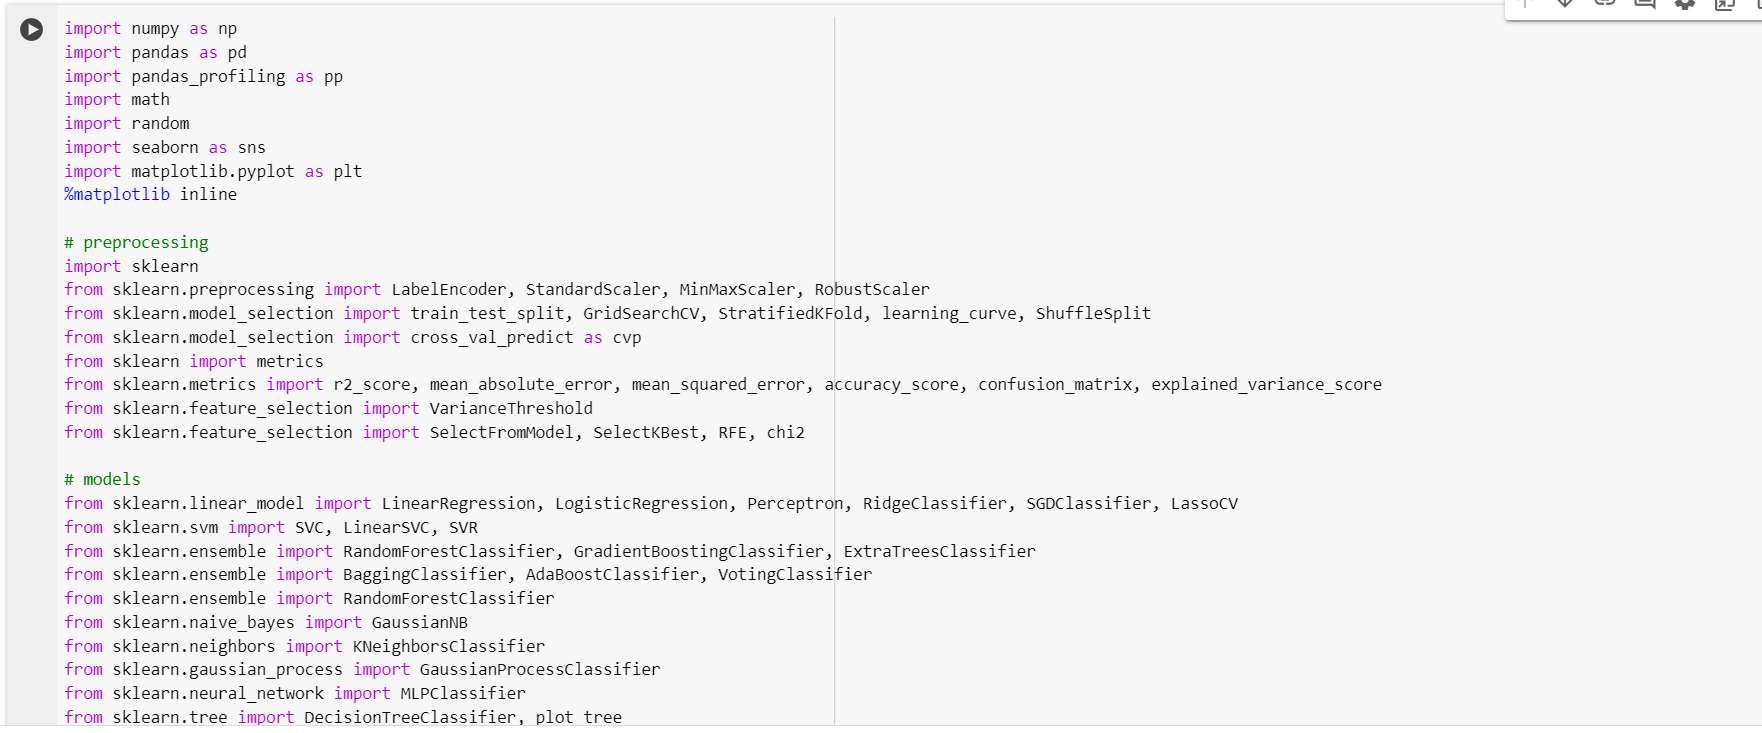
We built Aishark using a combination of Python for backend processing, JavaScript for frontend development, and various data visualization libraries such as D3.js and Matplotlib.
Challenges we ran into
One major challenge we faced was optimizing the performance of our data processing algorithms to handle large datasets efficiently. Additionally, integrating real-time data streams posed some technical hurdles that we had to overcome.
Accomplishments that we're proud of
We're proud of achieving a seamless integration between the backend processing and frontend visualization components of Aishark. Additionally, our team successfully implemented several advanced data analysis algorithms that enhance the tool's capabilities.
What we learned
Throughout the development of Aishark, we learned valuable lessons about optimizing code for performance, handling real-time data streams, and collaborating effectively within a team to achieve our goals.
What's next for Aishark
In the future, we plan to further enhance Aishark's features by incorporating machine learning algorithms for predictive analysis and expanding its compatibility with additional data sources and formats.
Built With
- built-with*-**languages**:-python
- d3.js-**database**:-postgresql-**cloud-services**:-aws-(amazon-web-services)-for-hosting-and-deployment-**apis**:-restful-api-for-data-retrieval-and-manipulation-**other-technologies**:-pandas-for-data-manipulation
- docker-for-containerization
- for
- git
- javascript-**frameworks**:-flask-(python)
- react-(javascript)-**data-visualization-libraries**:-matplotlib
- version

Log in or sign up for Devpost to join the conversation.