-
main
Inspiration
We chose the health prompt as it seemed the most realistic out of the three prompts we saw to have a solid systems engineering impact on. It seemed like an interesting scenario that isn't something we'd come up with off the bat as an example, and is a nice change of pace from our team's day-to-day work in Aerospace.
What it does
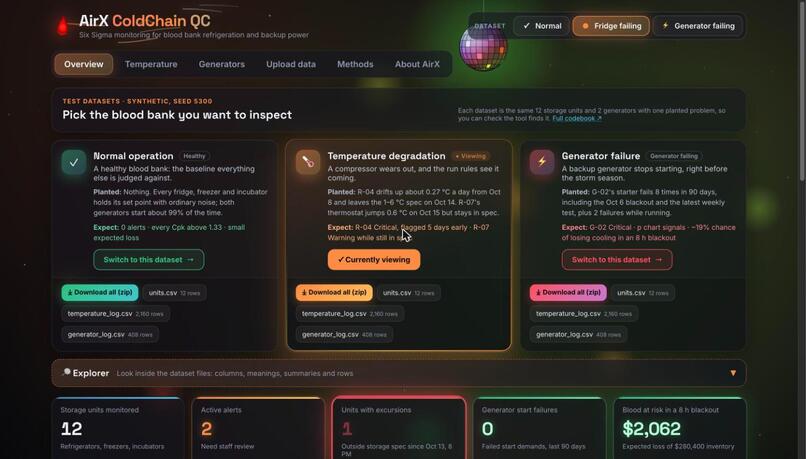
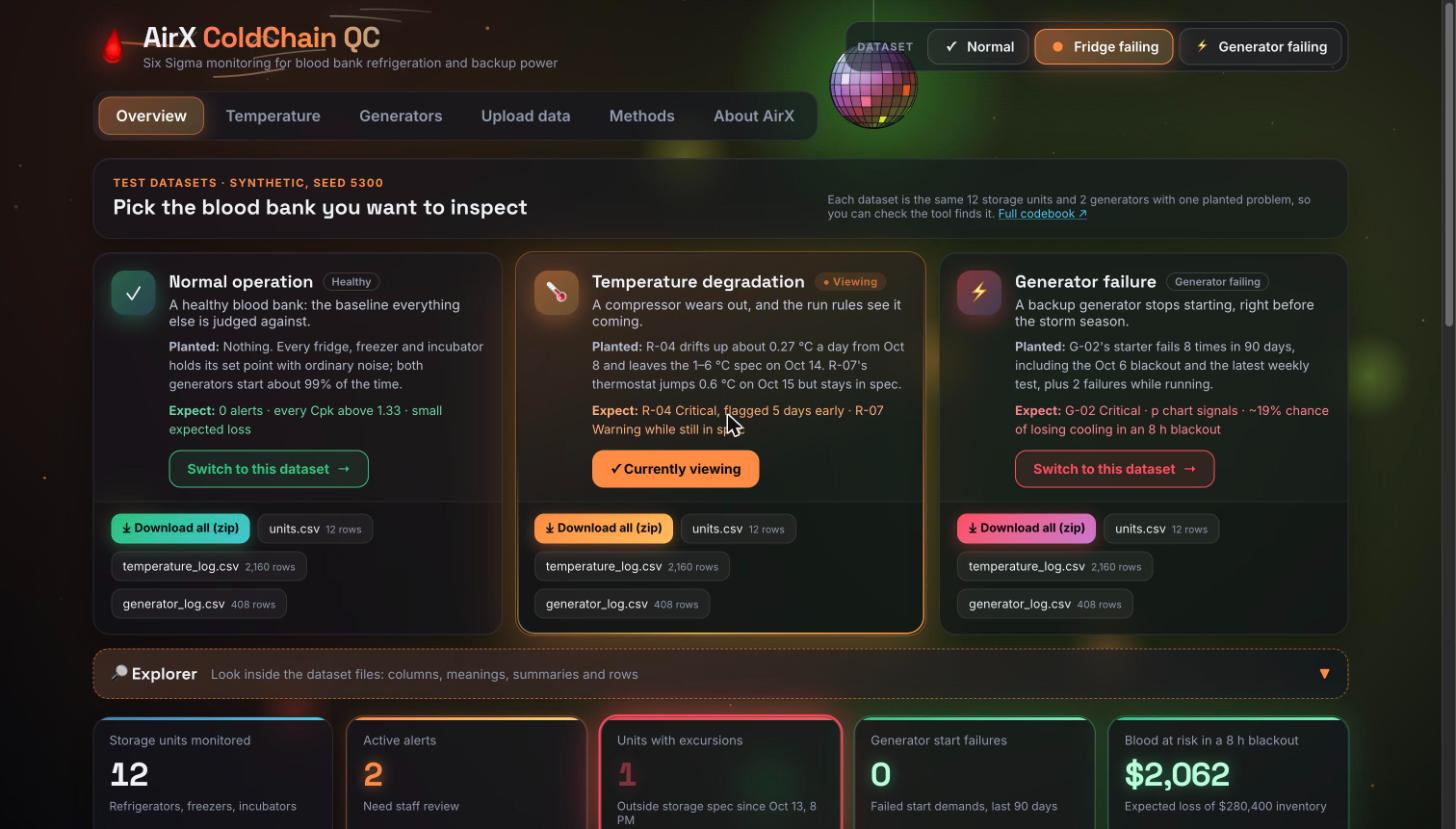
AirX ColdChain QC reads three plain CSV files (a unit list, temperature readings and generator test logs) and gives a blood bank manager a one-page status board. Each of the 12 storage units and 2 backup generators gets a status of Normal, Review, Warning or Critical, plus a short action list that says what to check first.
- Temperature: each unit gets an I-MR control chart with the 8 run rules, plus Cp, Cpk, Pp and Ppk with confidence intervals against the spec for its product type (red cells, plasma or platelets). A fridge drifting upward is flagged days before it leaves its safe range.
- Generators: a p-chart tracks failed starts quarter by quarter, and an exponential reliability model estimates the chance a generator runs through a blackout. We turn that into the chance of losing cooling and the dollars of blood at risk.
- Three test datasets: Normal operation (nothing planted), Temperature degradation (a failing compressor on fridge R-04), and Generator failure (generator G-02 failing starts, including during the Oct 6 blackout). Each has one planted problem, so you can check the tool finds it. You can switch between datasets, download them as zip files, and look inside them in the Explorer with a full codebook.
- Upload your own data in the same three-file format.
Alerts come from rules and statistics only. No AI model is making the calls, so every flag can be traced back to a chart and a formula.
How we built it
- Python library bloodbank_qc: all the statistics (I-MR, run rules, capability, p-chart, reliability, system reliability).
- FastAPI backend wrapping the library, and a React dashboard with hand-drawn SVG charts.
- Deployed on Posit Connect (dashboard and API from one URL), with a GitHub Action that redeploys on every push to main.
- Built by vibecoding with Claude Code, with a statistics-first rule: numbers were checked against known answers before any styling.
Six Sigma methods used
Control charts (I-MR, p-chart), the 8 run rules, control limits versus spec limits, process capability (Cp, Cpk, Pp, Ppk with confidence intervals), exponential reliability (R(t), failure rate, MTTF), series and parallel system reliability, and DMAIC as the overall frame.
How we know the numbers are right
60 automated tests reproduce numbers from the course's own datasets and examples (the I-MR limits on daily_production.csv, the onsen.csv capability indices, the rotary-pump MTTF). They also check that each run rule fires where a pattern was planted, and that bad input gives a clear error and not a made-up number. We also reviewed the site manually and double-checked our tests.
Challenges we ran into
We didn't run into too many challenges with this project. The largest thing was working with AI to make sure we incorporated the class concepts correctly and were getting correct numbers out of it.
What we learned
We learned good ways to display statistical data to users. Much of this project involved us planning out good ways to implement the data and display it, so that we could feed these instructions into Claude to vibecode correctly.
What's next
Live sensor feeds instead of CSV uploads, alerts by text or email, and a calibration study on real blood bank logs. All data in this project is synthetic. More disco-themed aesthetics maybe?
Demonstration
- Live app: https://connect.systems-apps.com/content/2f99849a-2483-4b3e-91c5-1bf7caf8e417/
- Illustrated walkthrough with 21 screenshots of the three test datasets: https://github.com/jmj282/sysen5300_airx/blob/main/docs/WALKTHROUGH.md
- Code: https://github.com/jmj282/sysen5300_airx
Team AirX: Owyn Adams, Jake Janish, Roman Nagirniak, Nkenna Opara, Carter Perun.


Log in or sign up for Devpost to join the conversation.