-
-
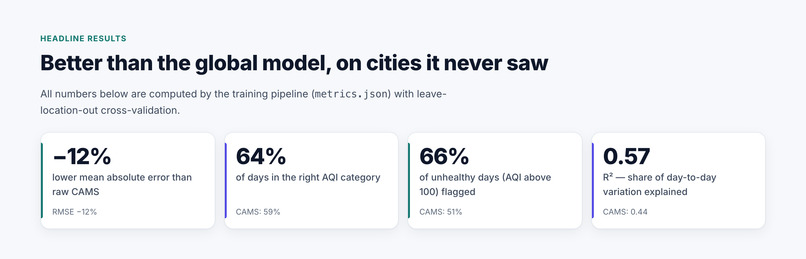
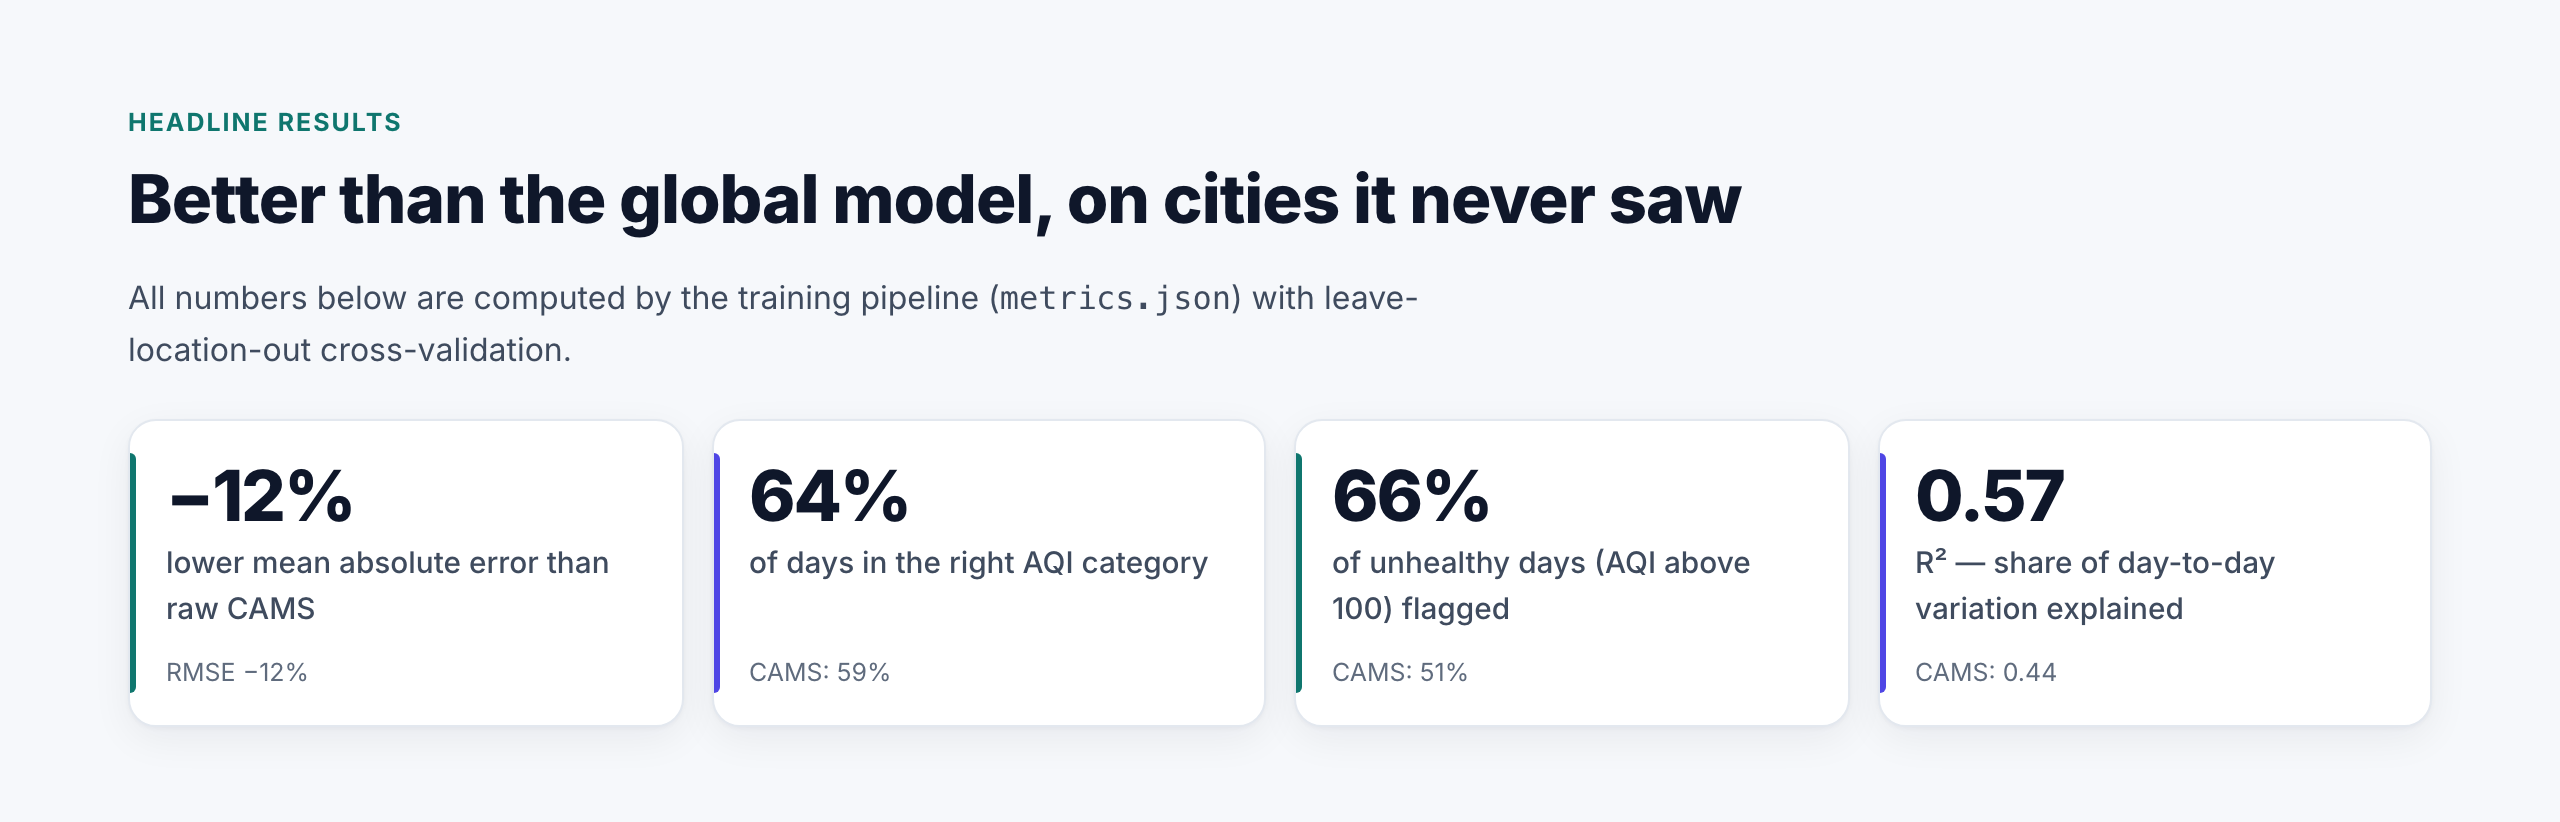
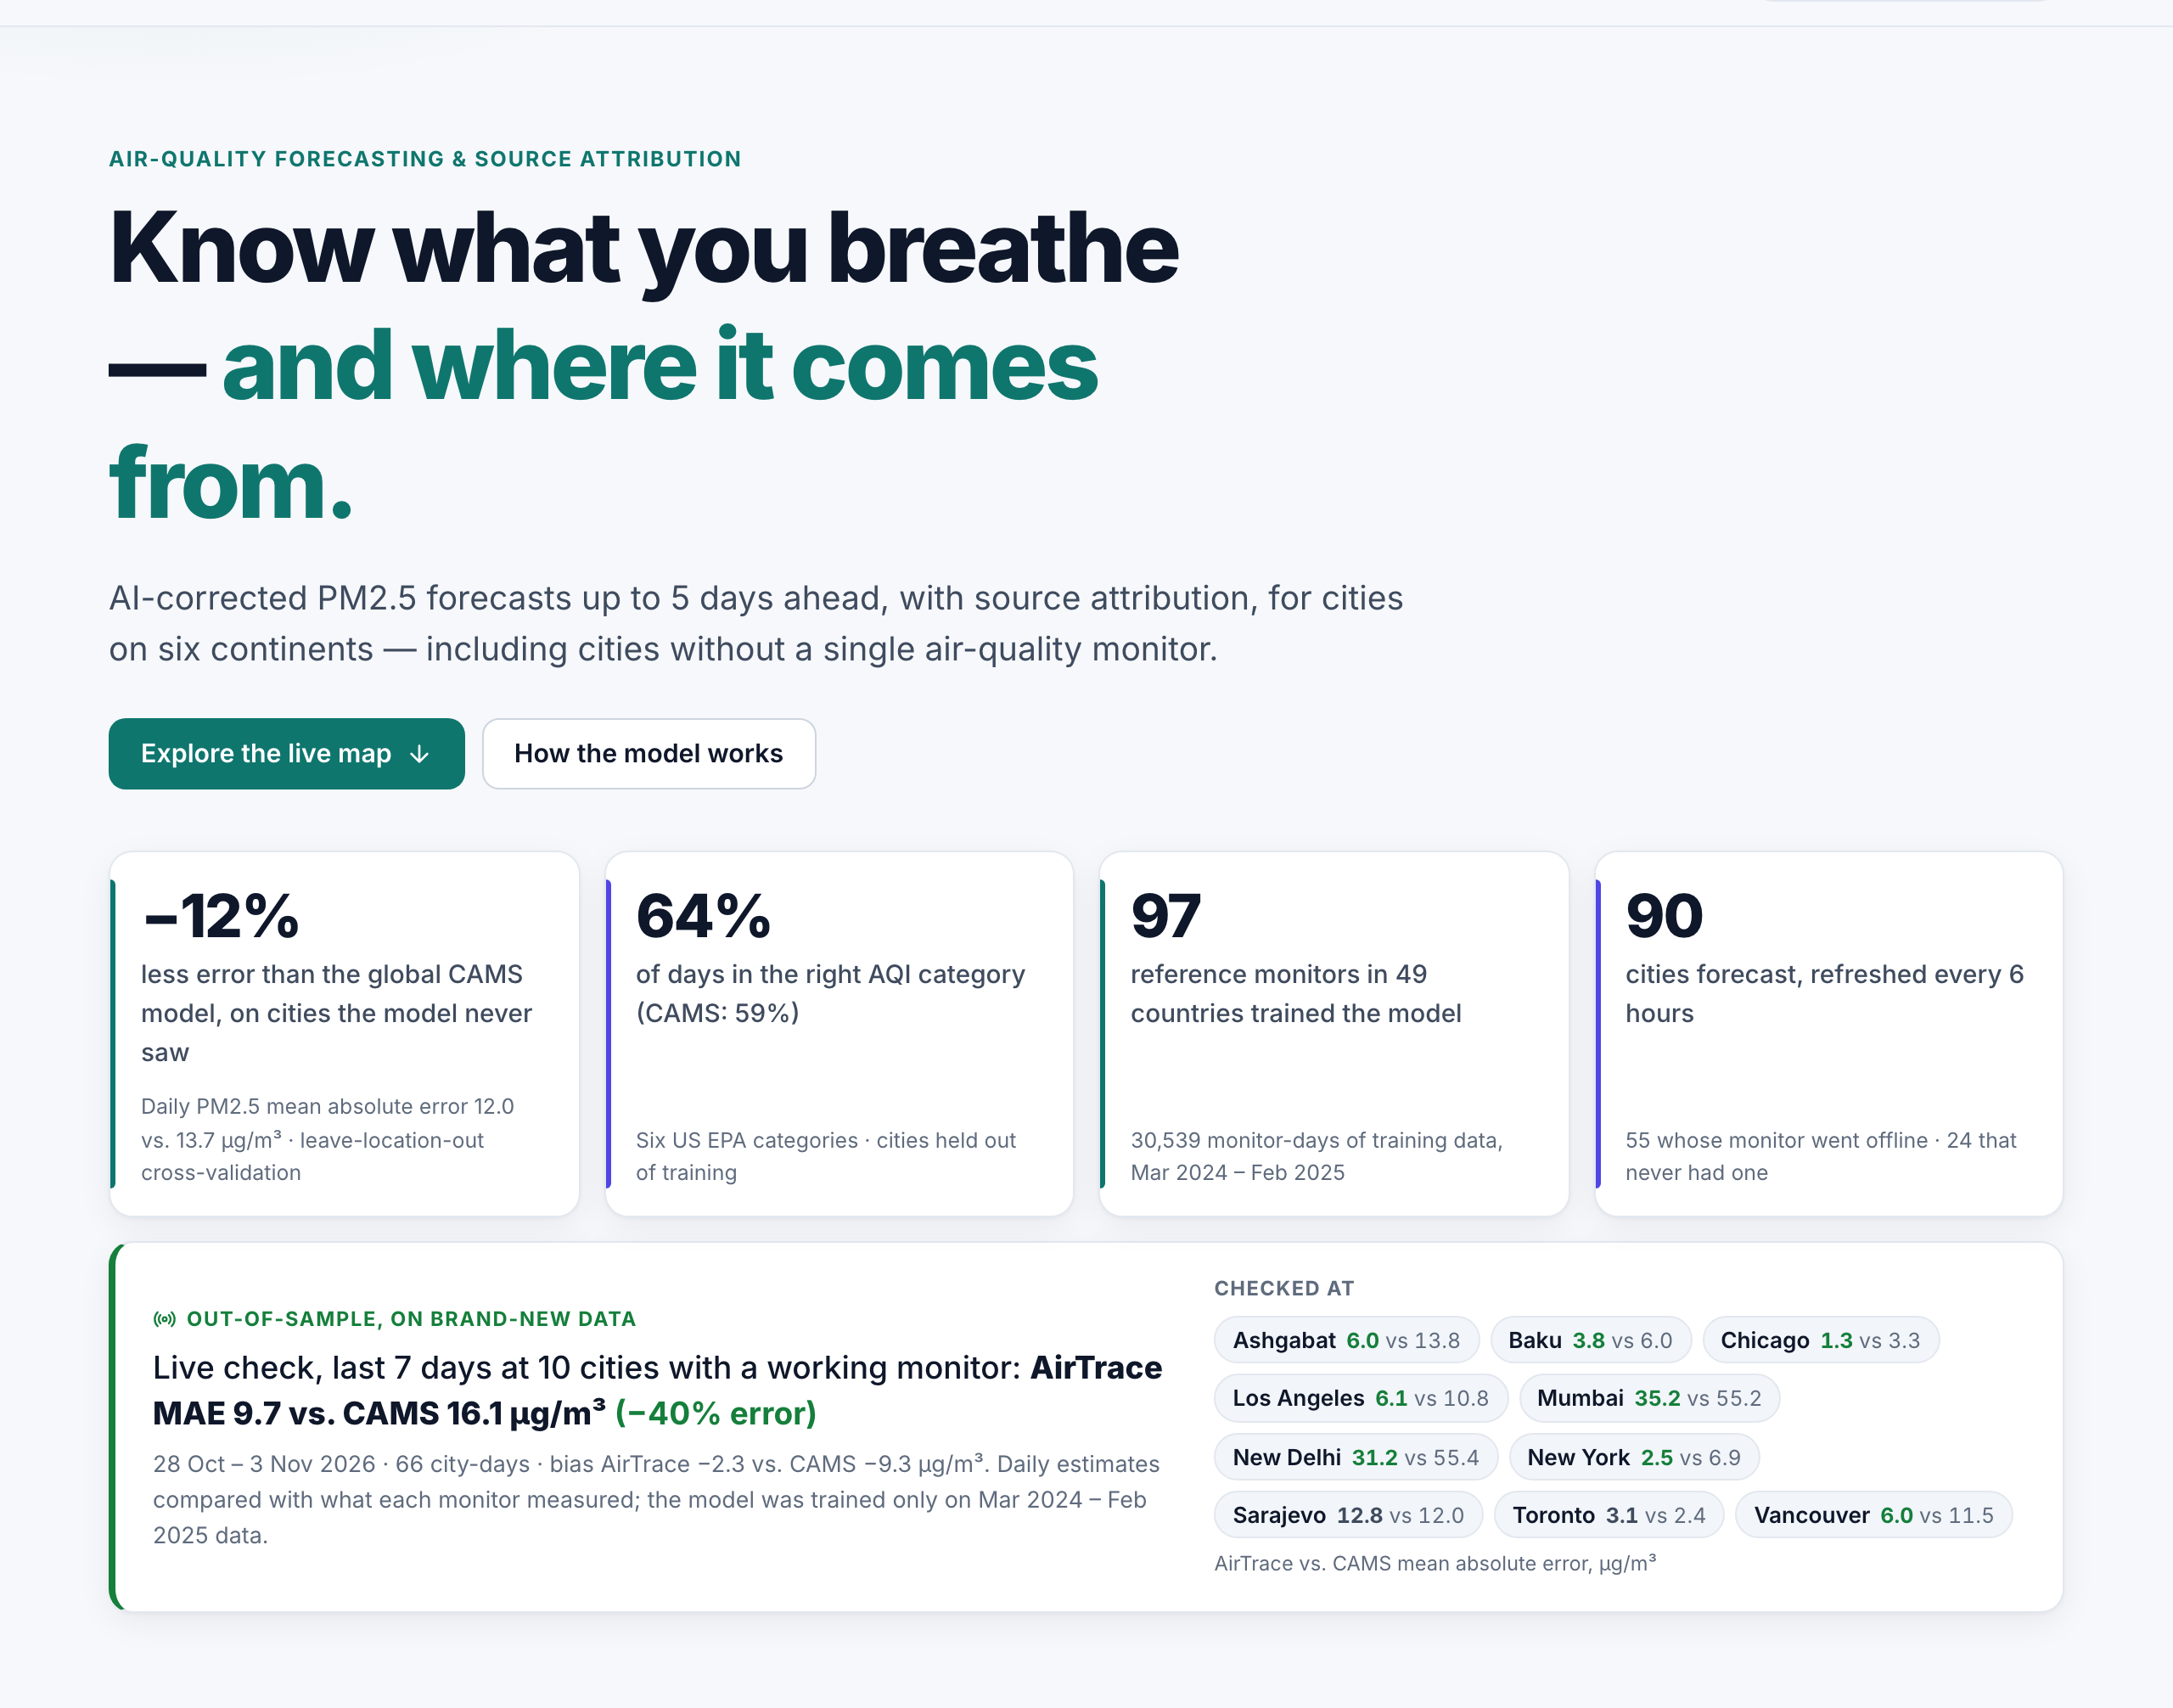
Tested on locations the model never saw: 12% lower error than CAMS, AQI category right on 64% of days.
-
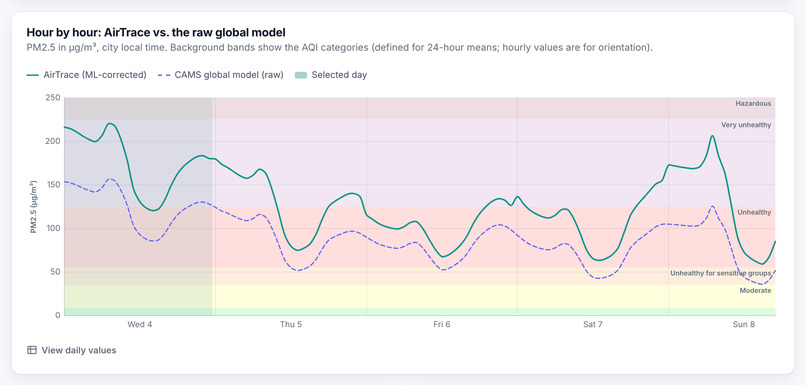
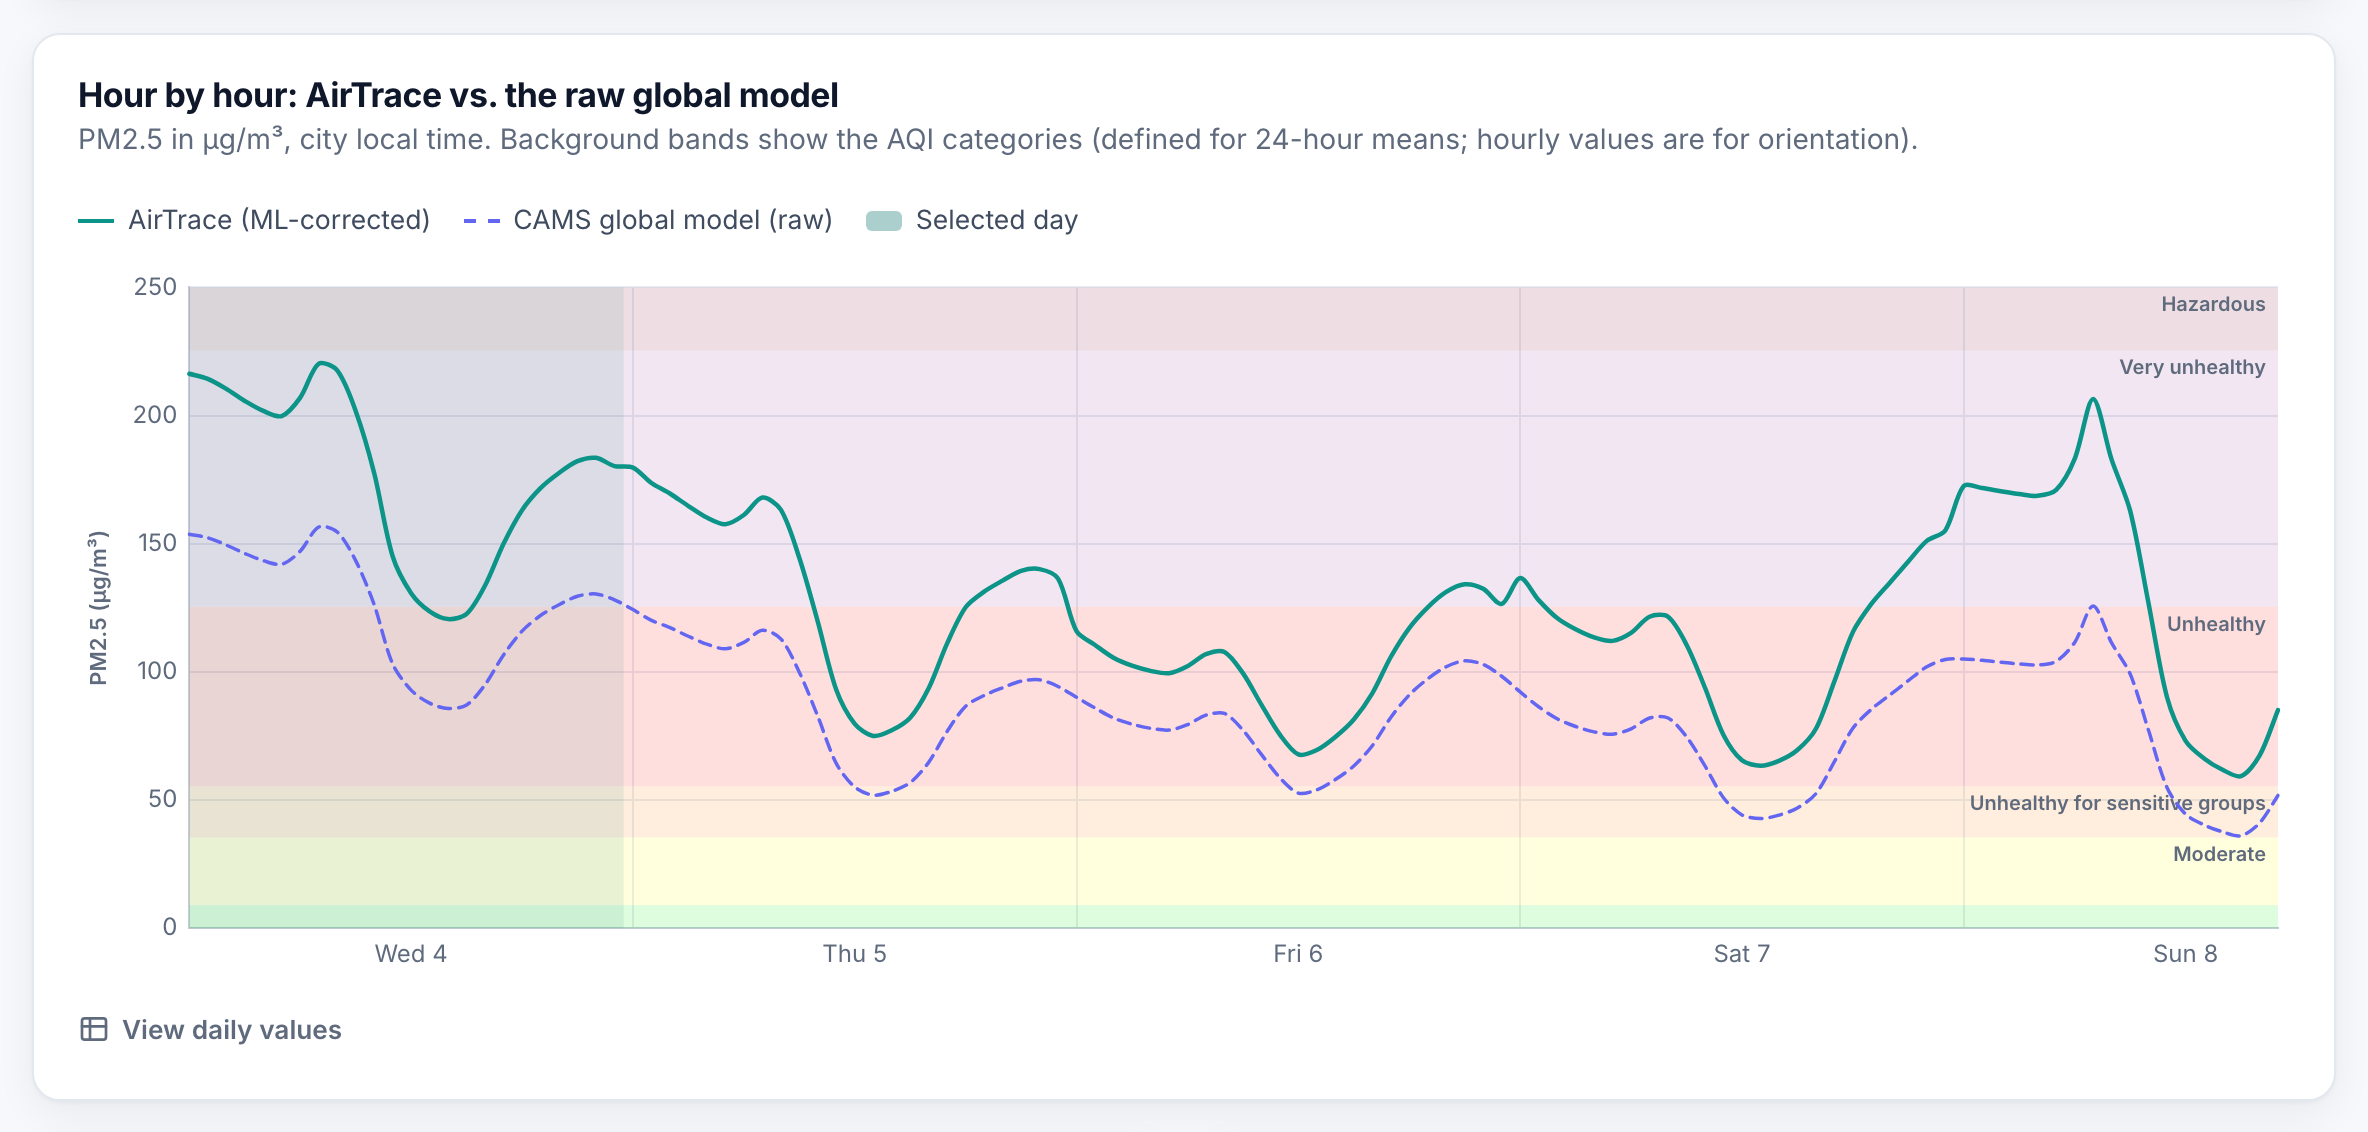
Hourly PM2.5: AirTrace (solid line) next to the raw CAMS global model (dashed line).
-
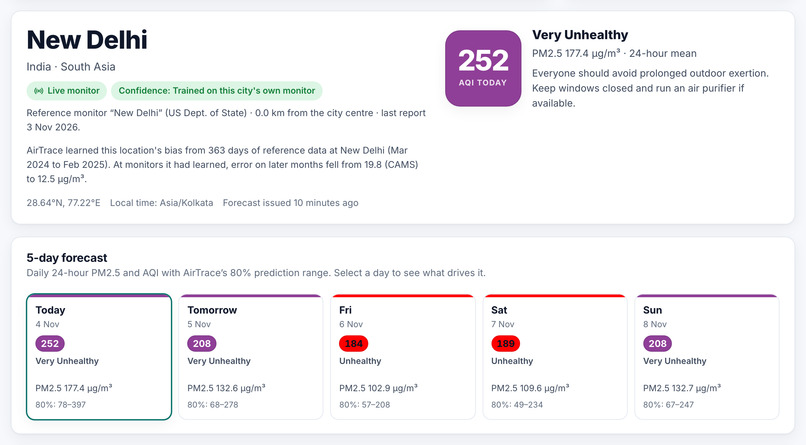
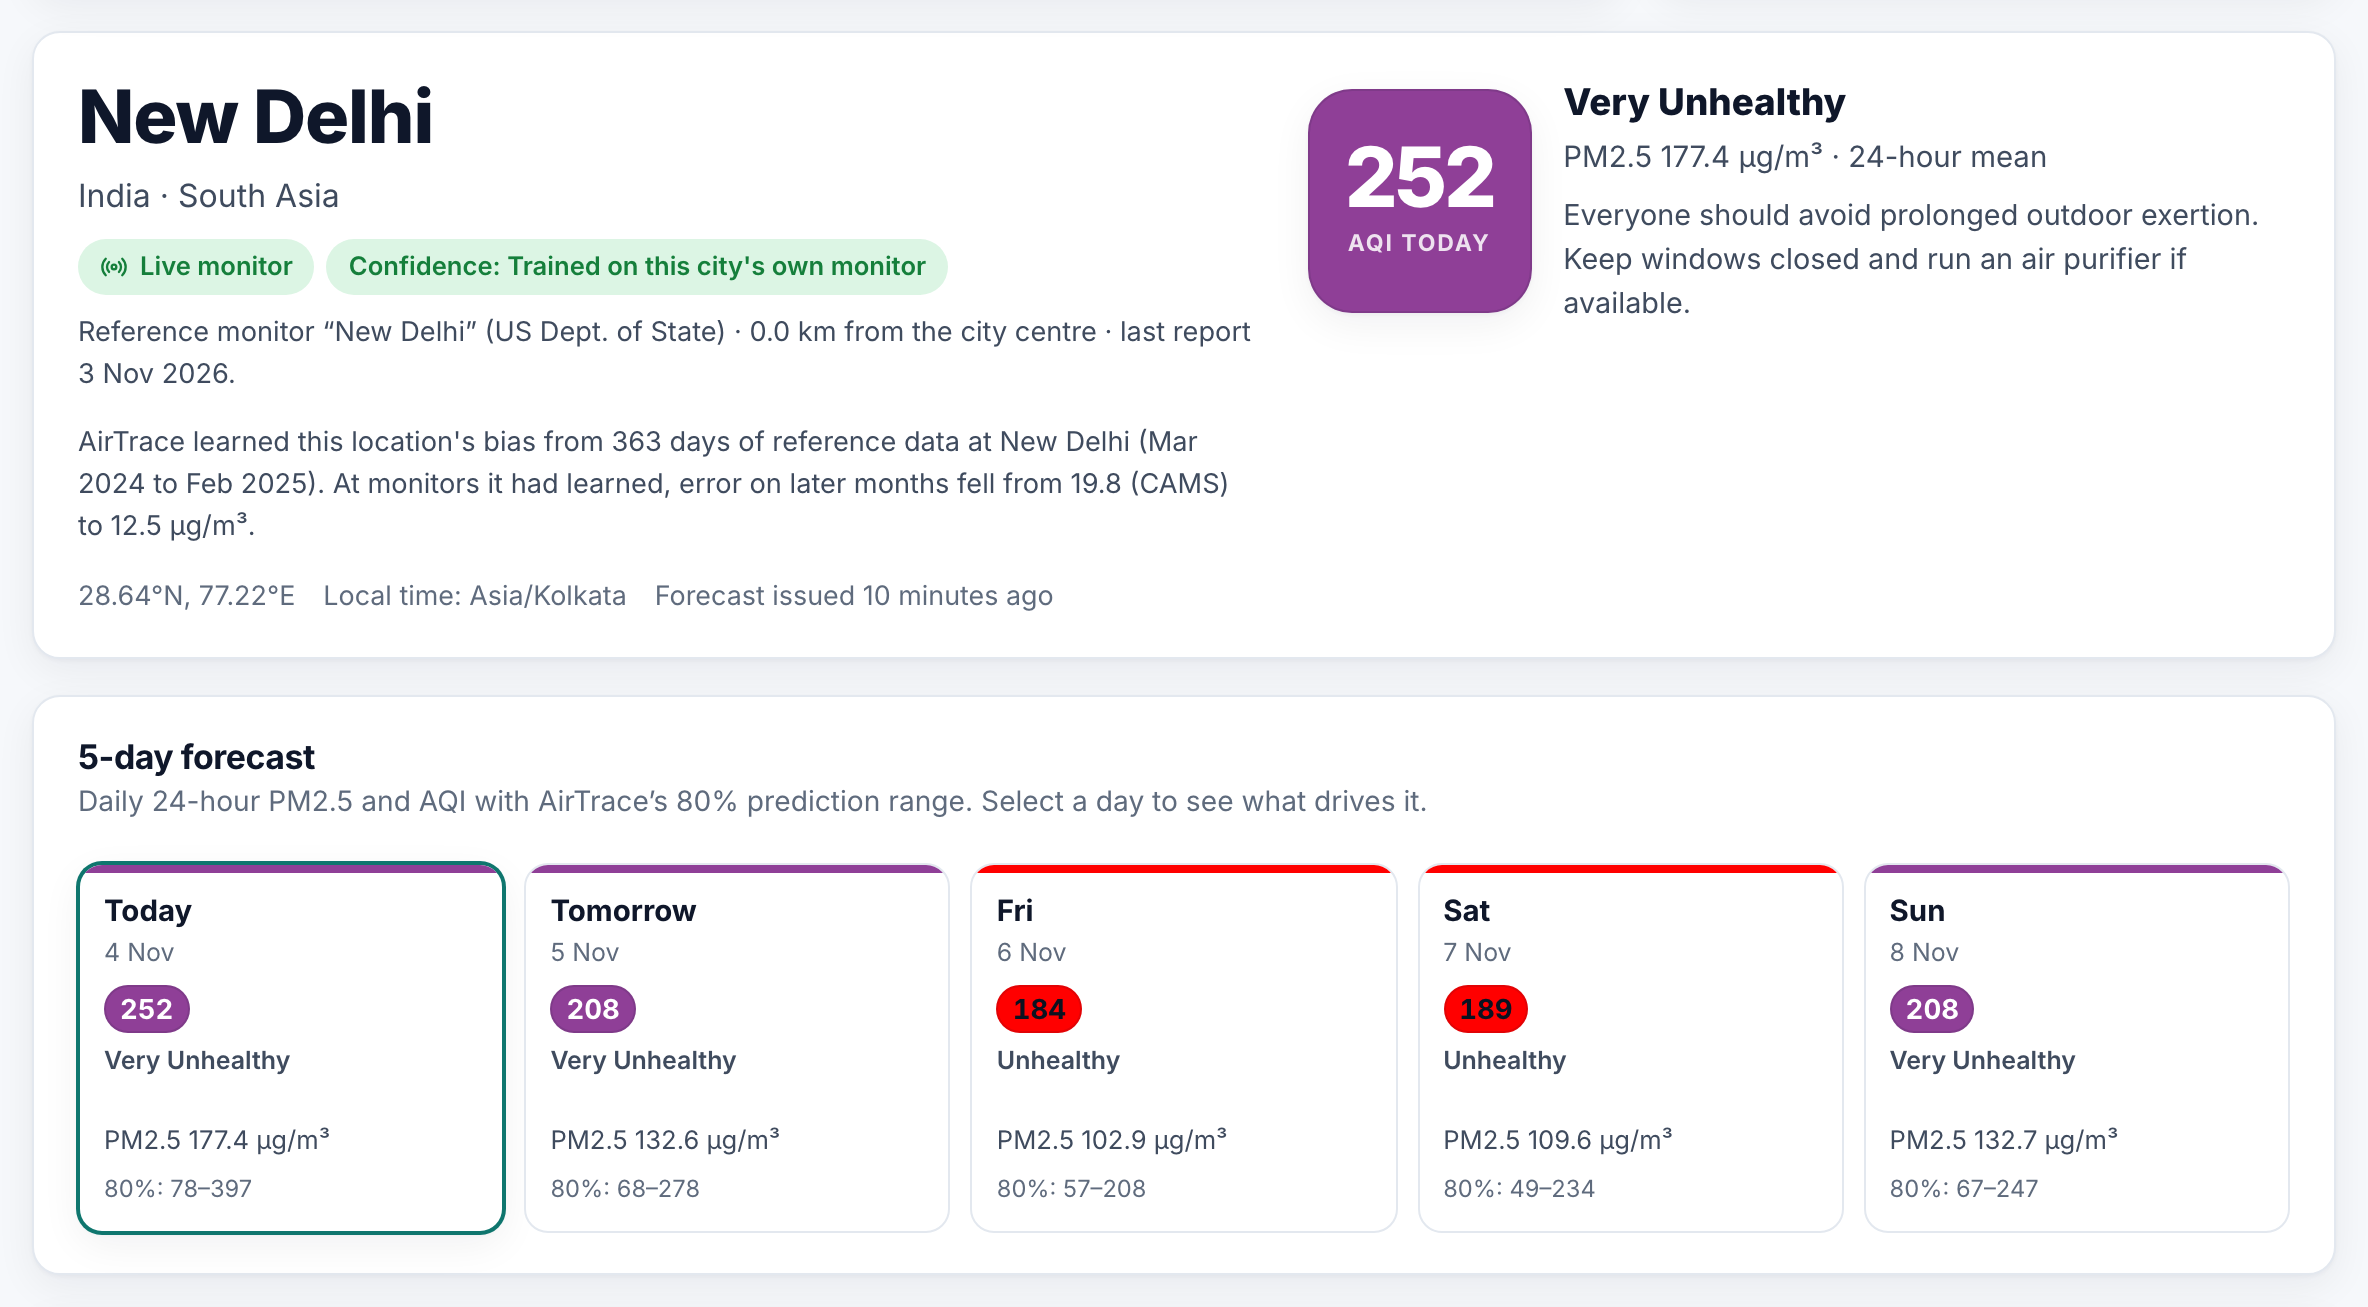
New Delhi: today’s AQI, a confidence level for the city, and a 5-day forecast with an 80% range.
-
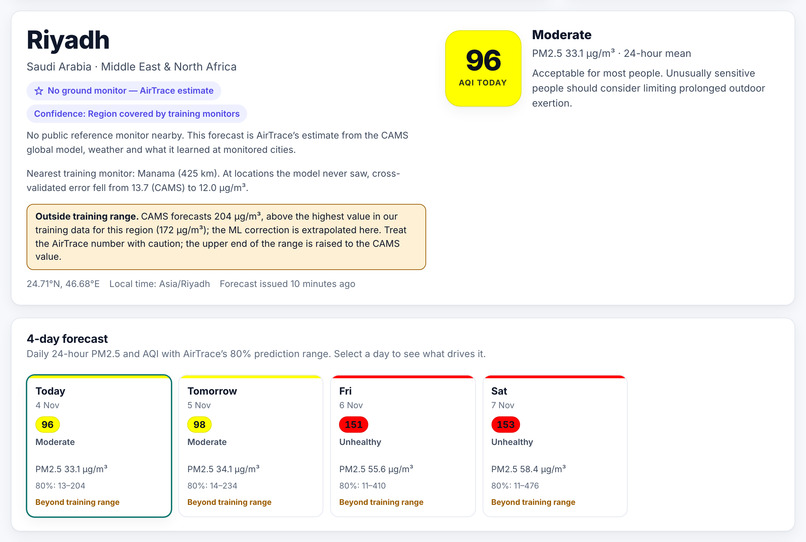
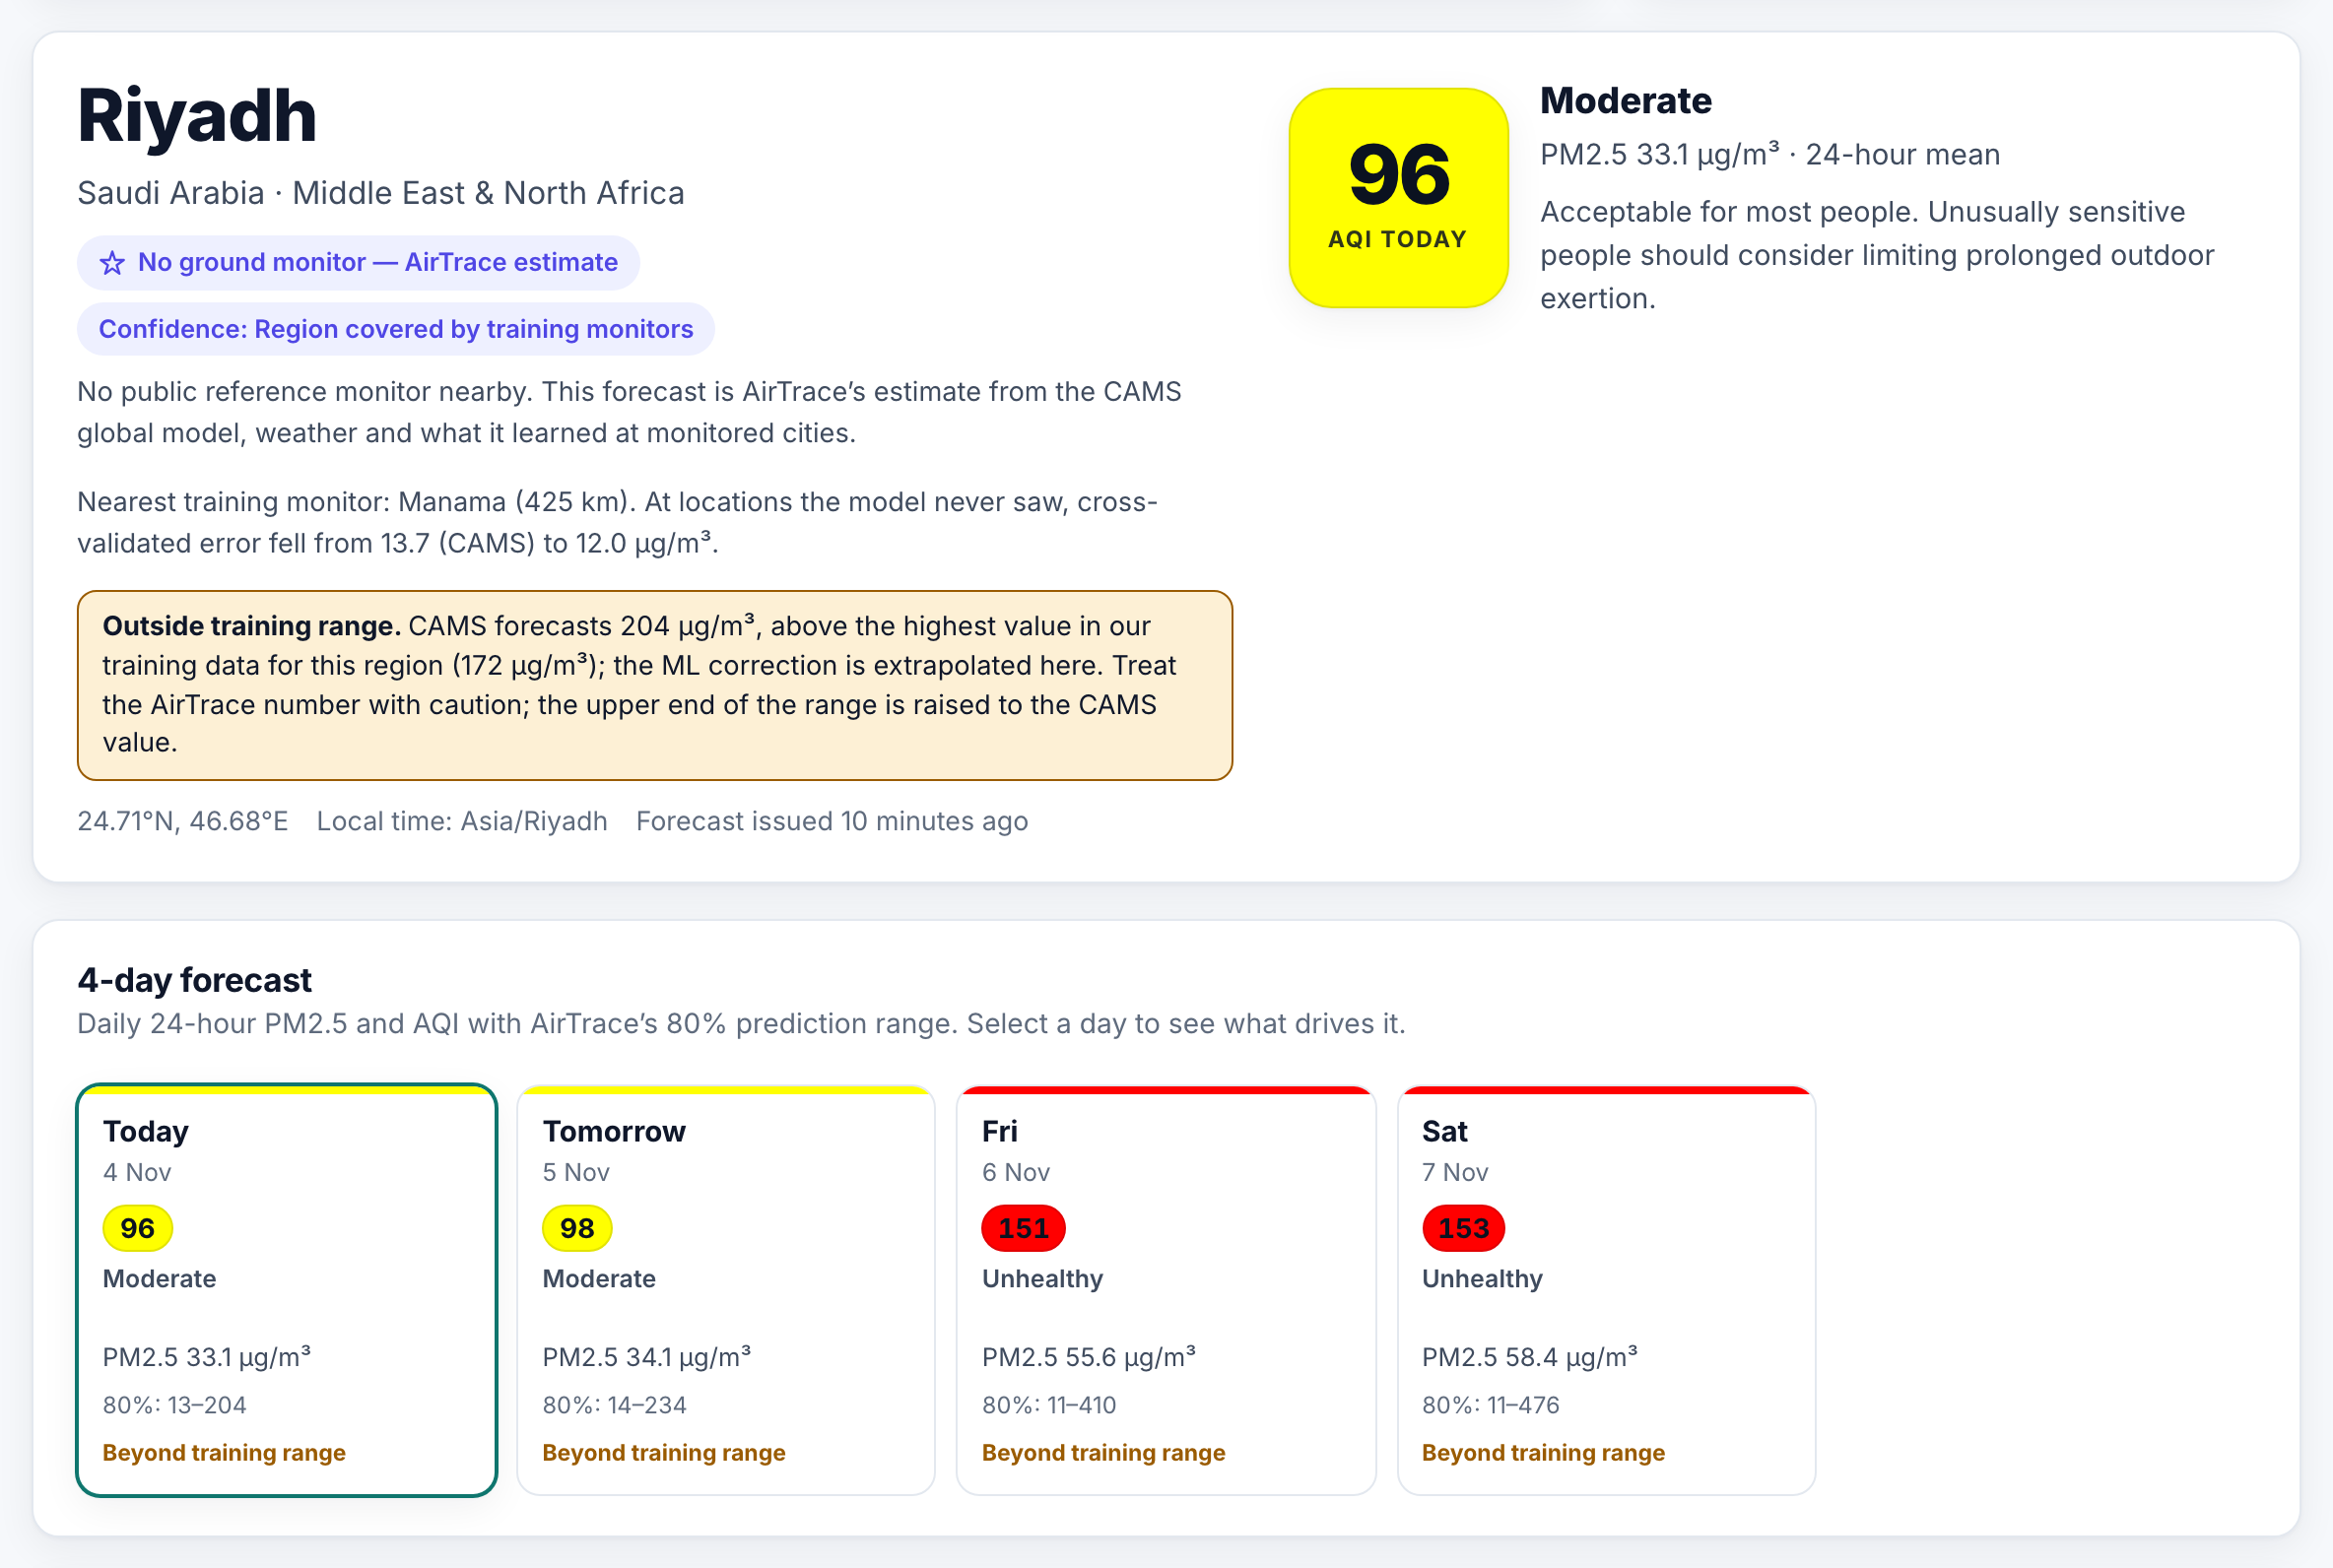
When CAMS goes beyond anything in the training data, like this Riyadh dust event, the page shows a warning
-
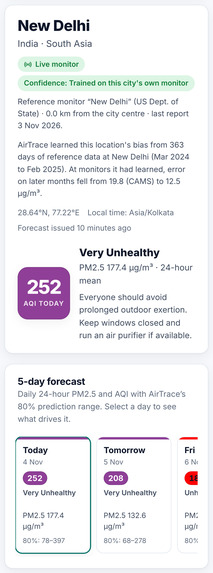
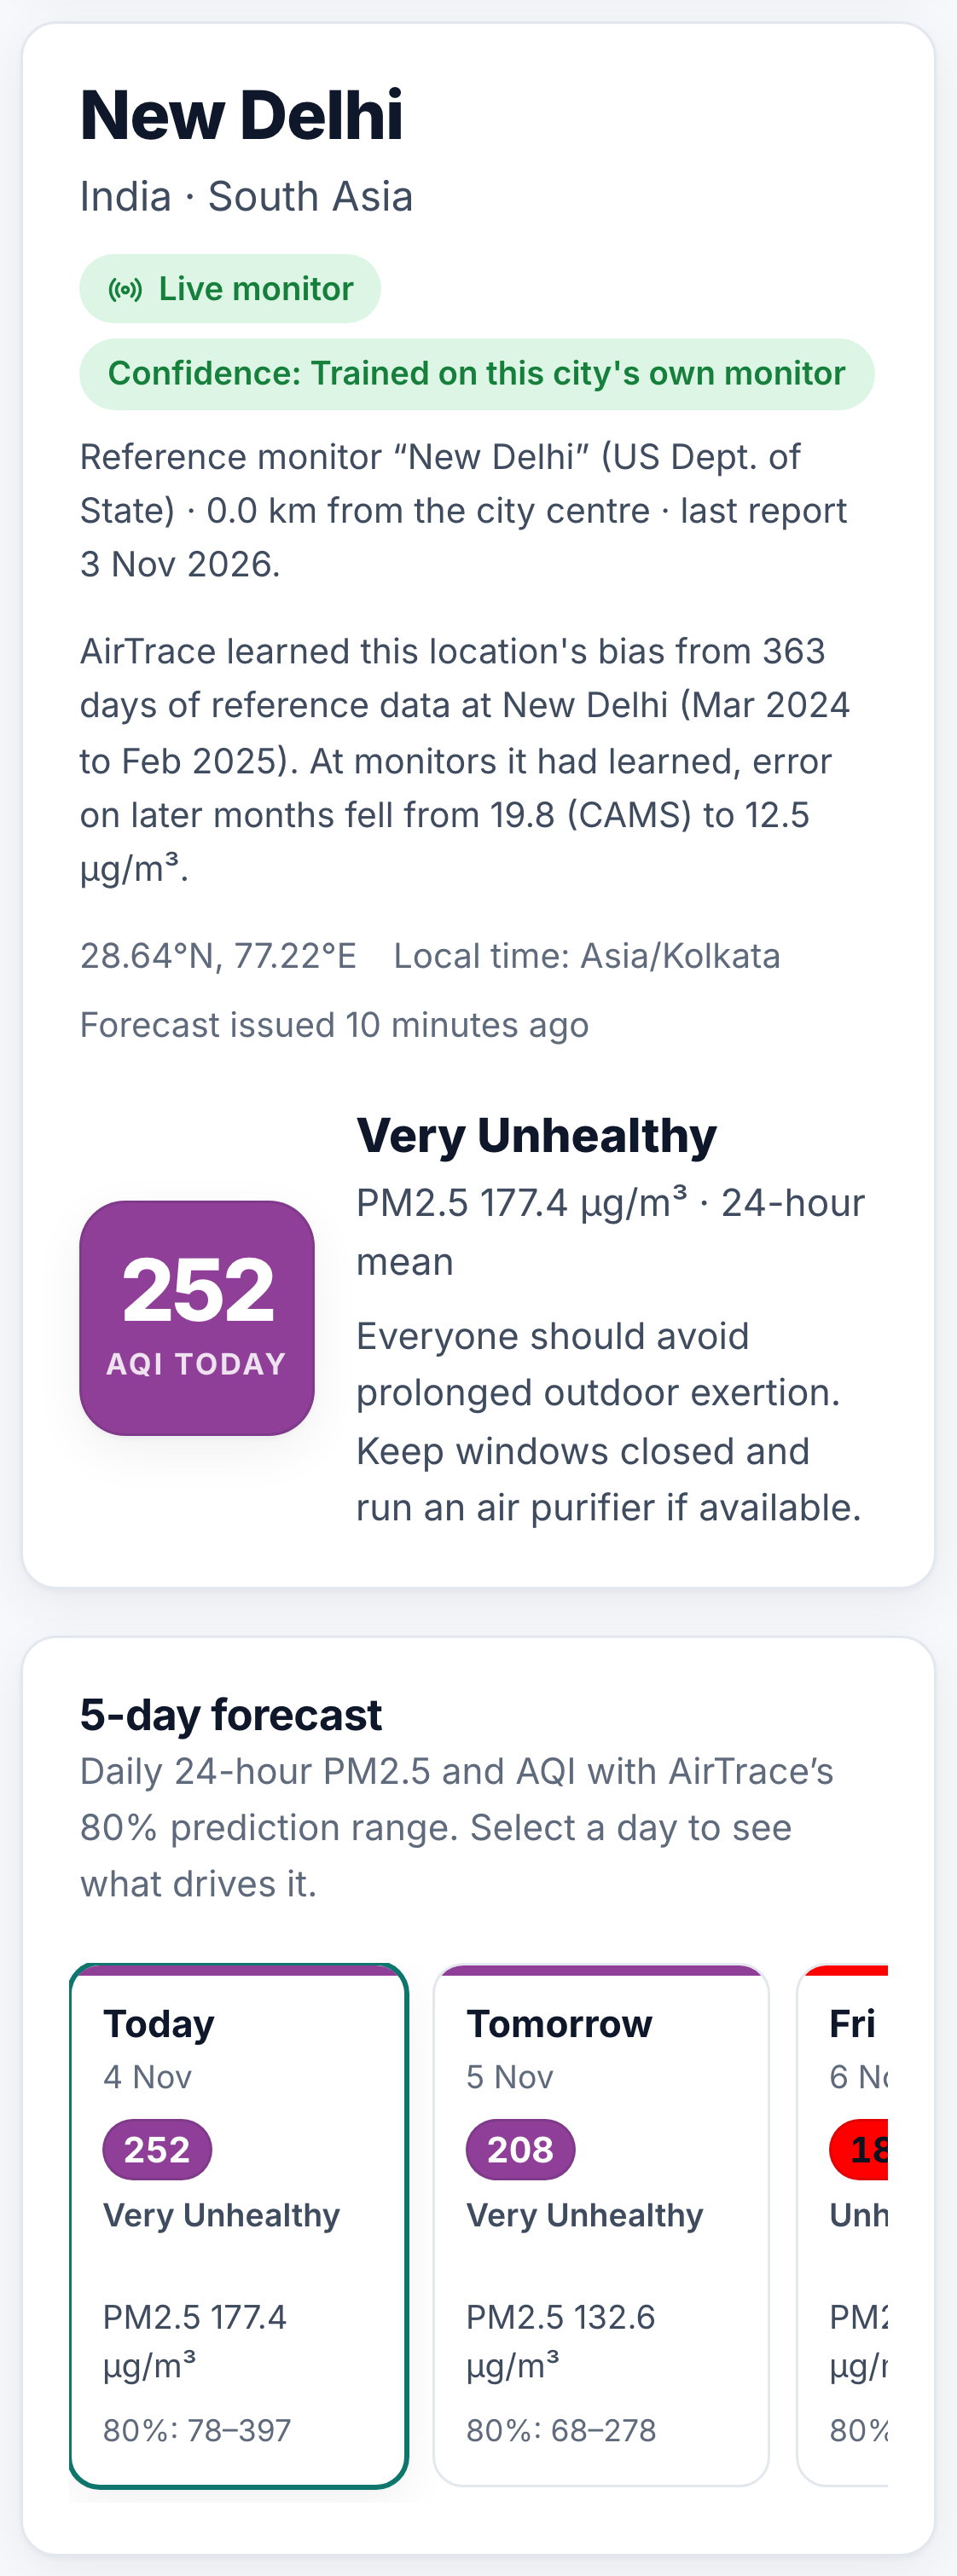
The site also works on phones.
-
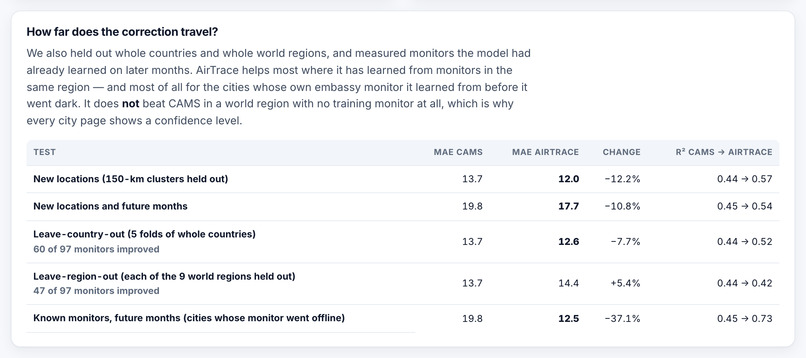
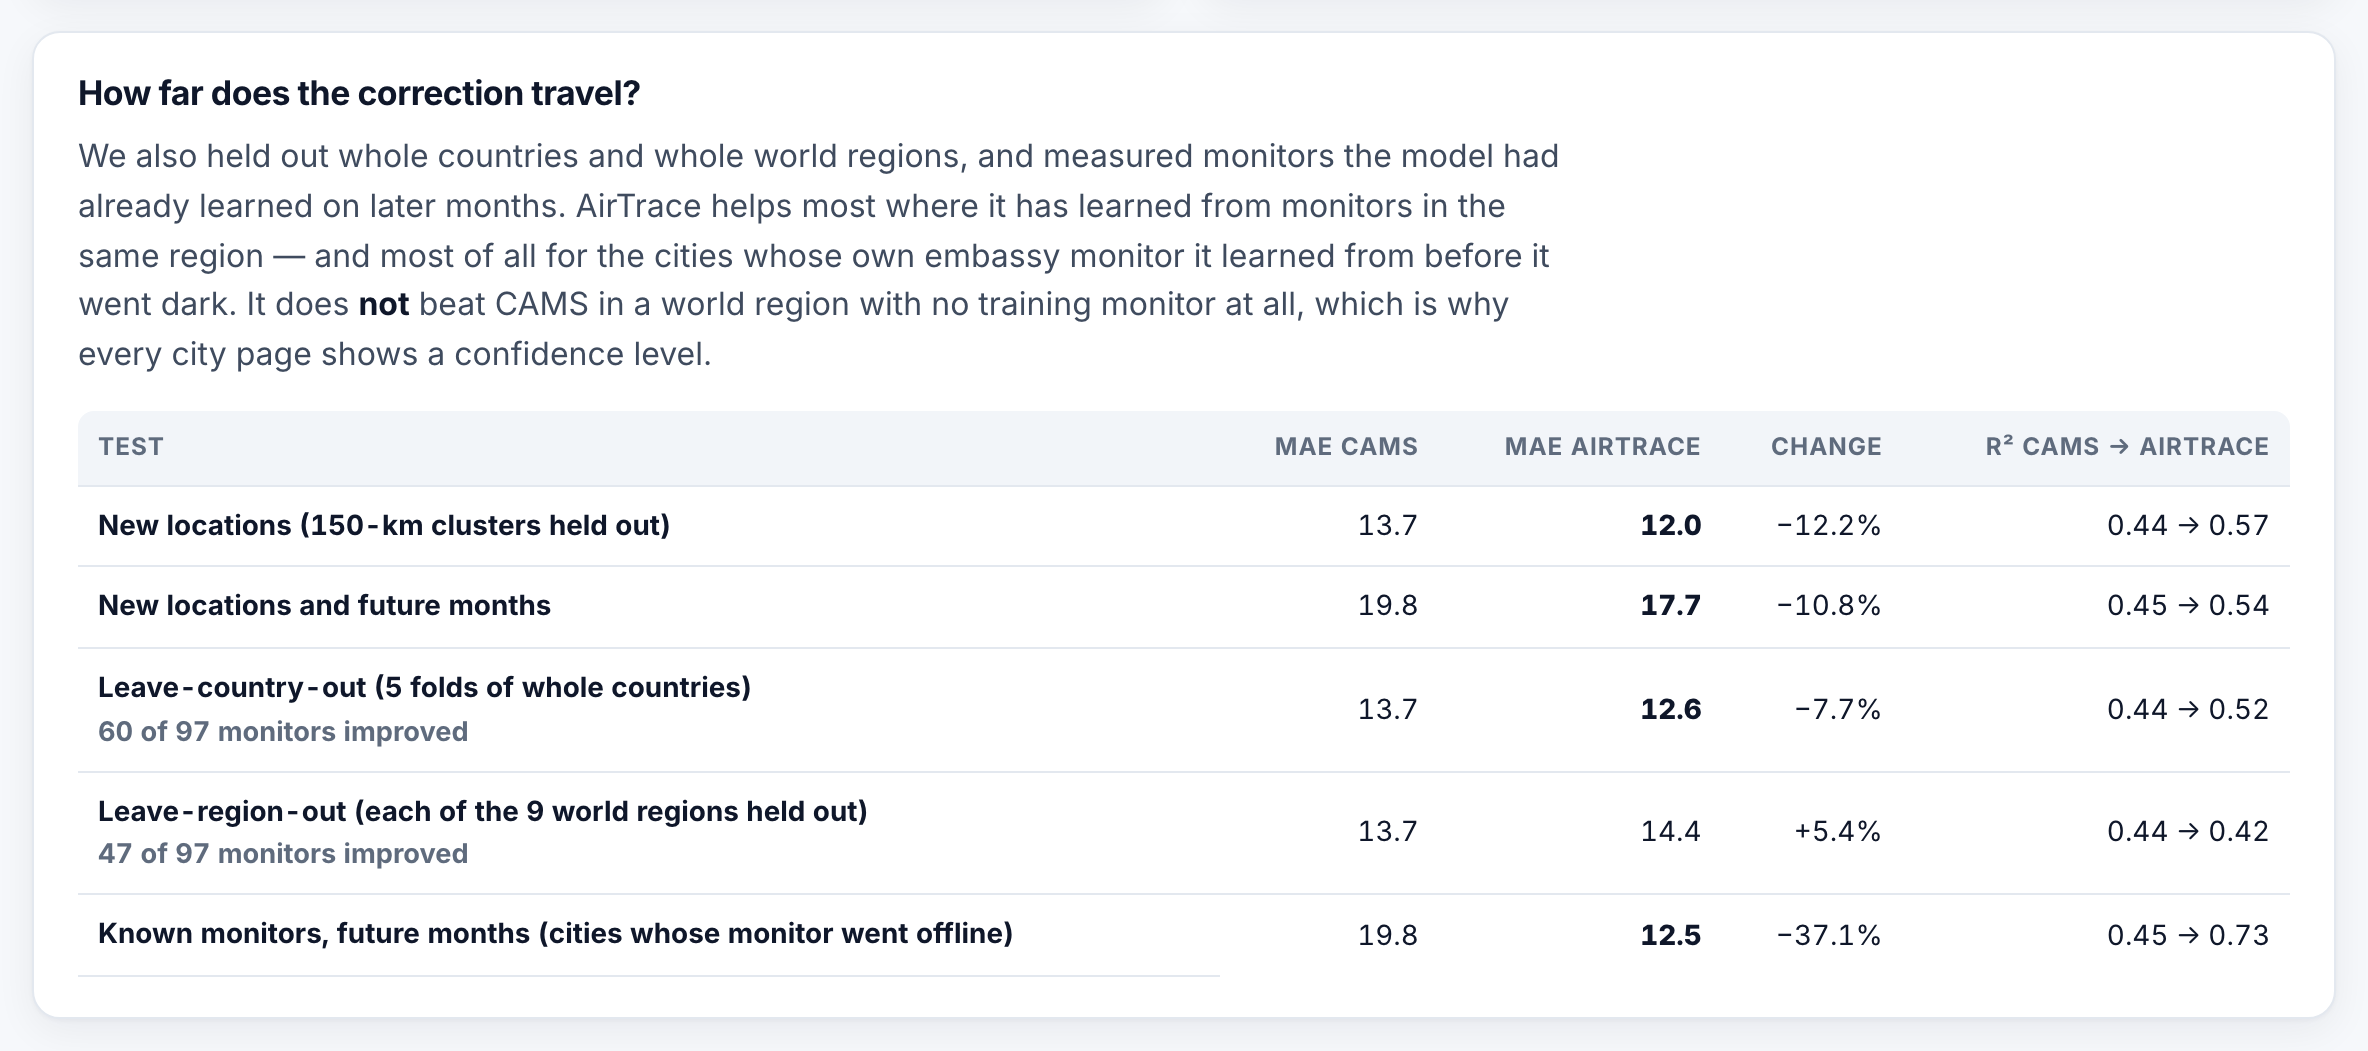
How far the correction travels, including the cases where it doesn’t beat CAMS.
-
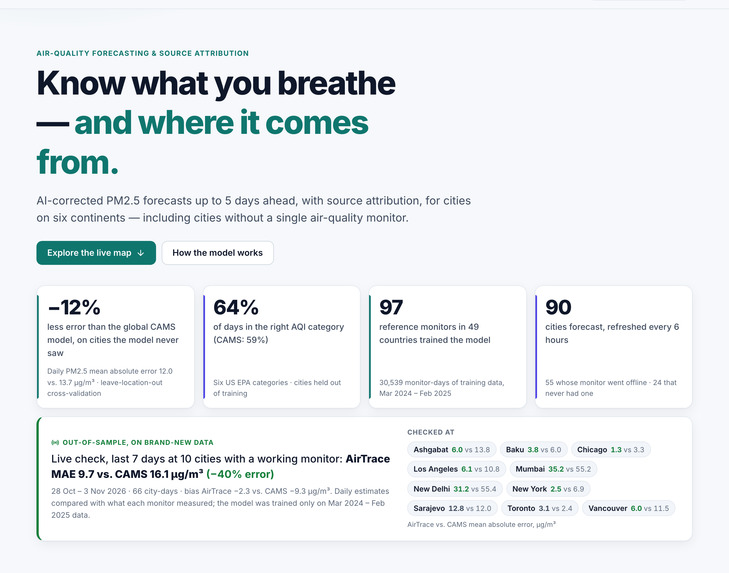
Home page: headline results and a live check against monitors that still report, on brand-new 2026 data.
-
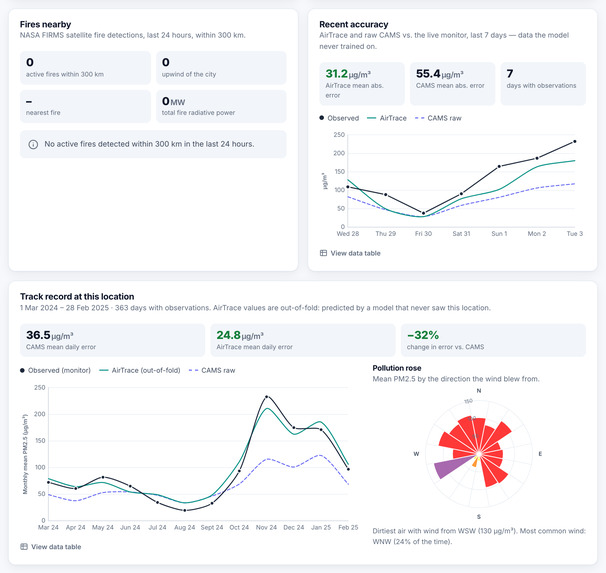
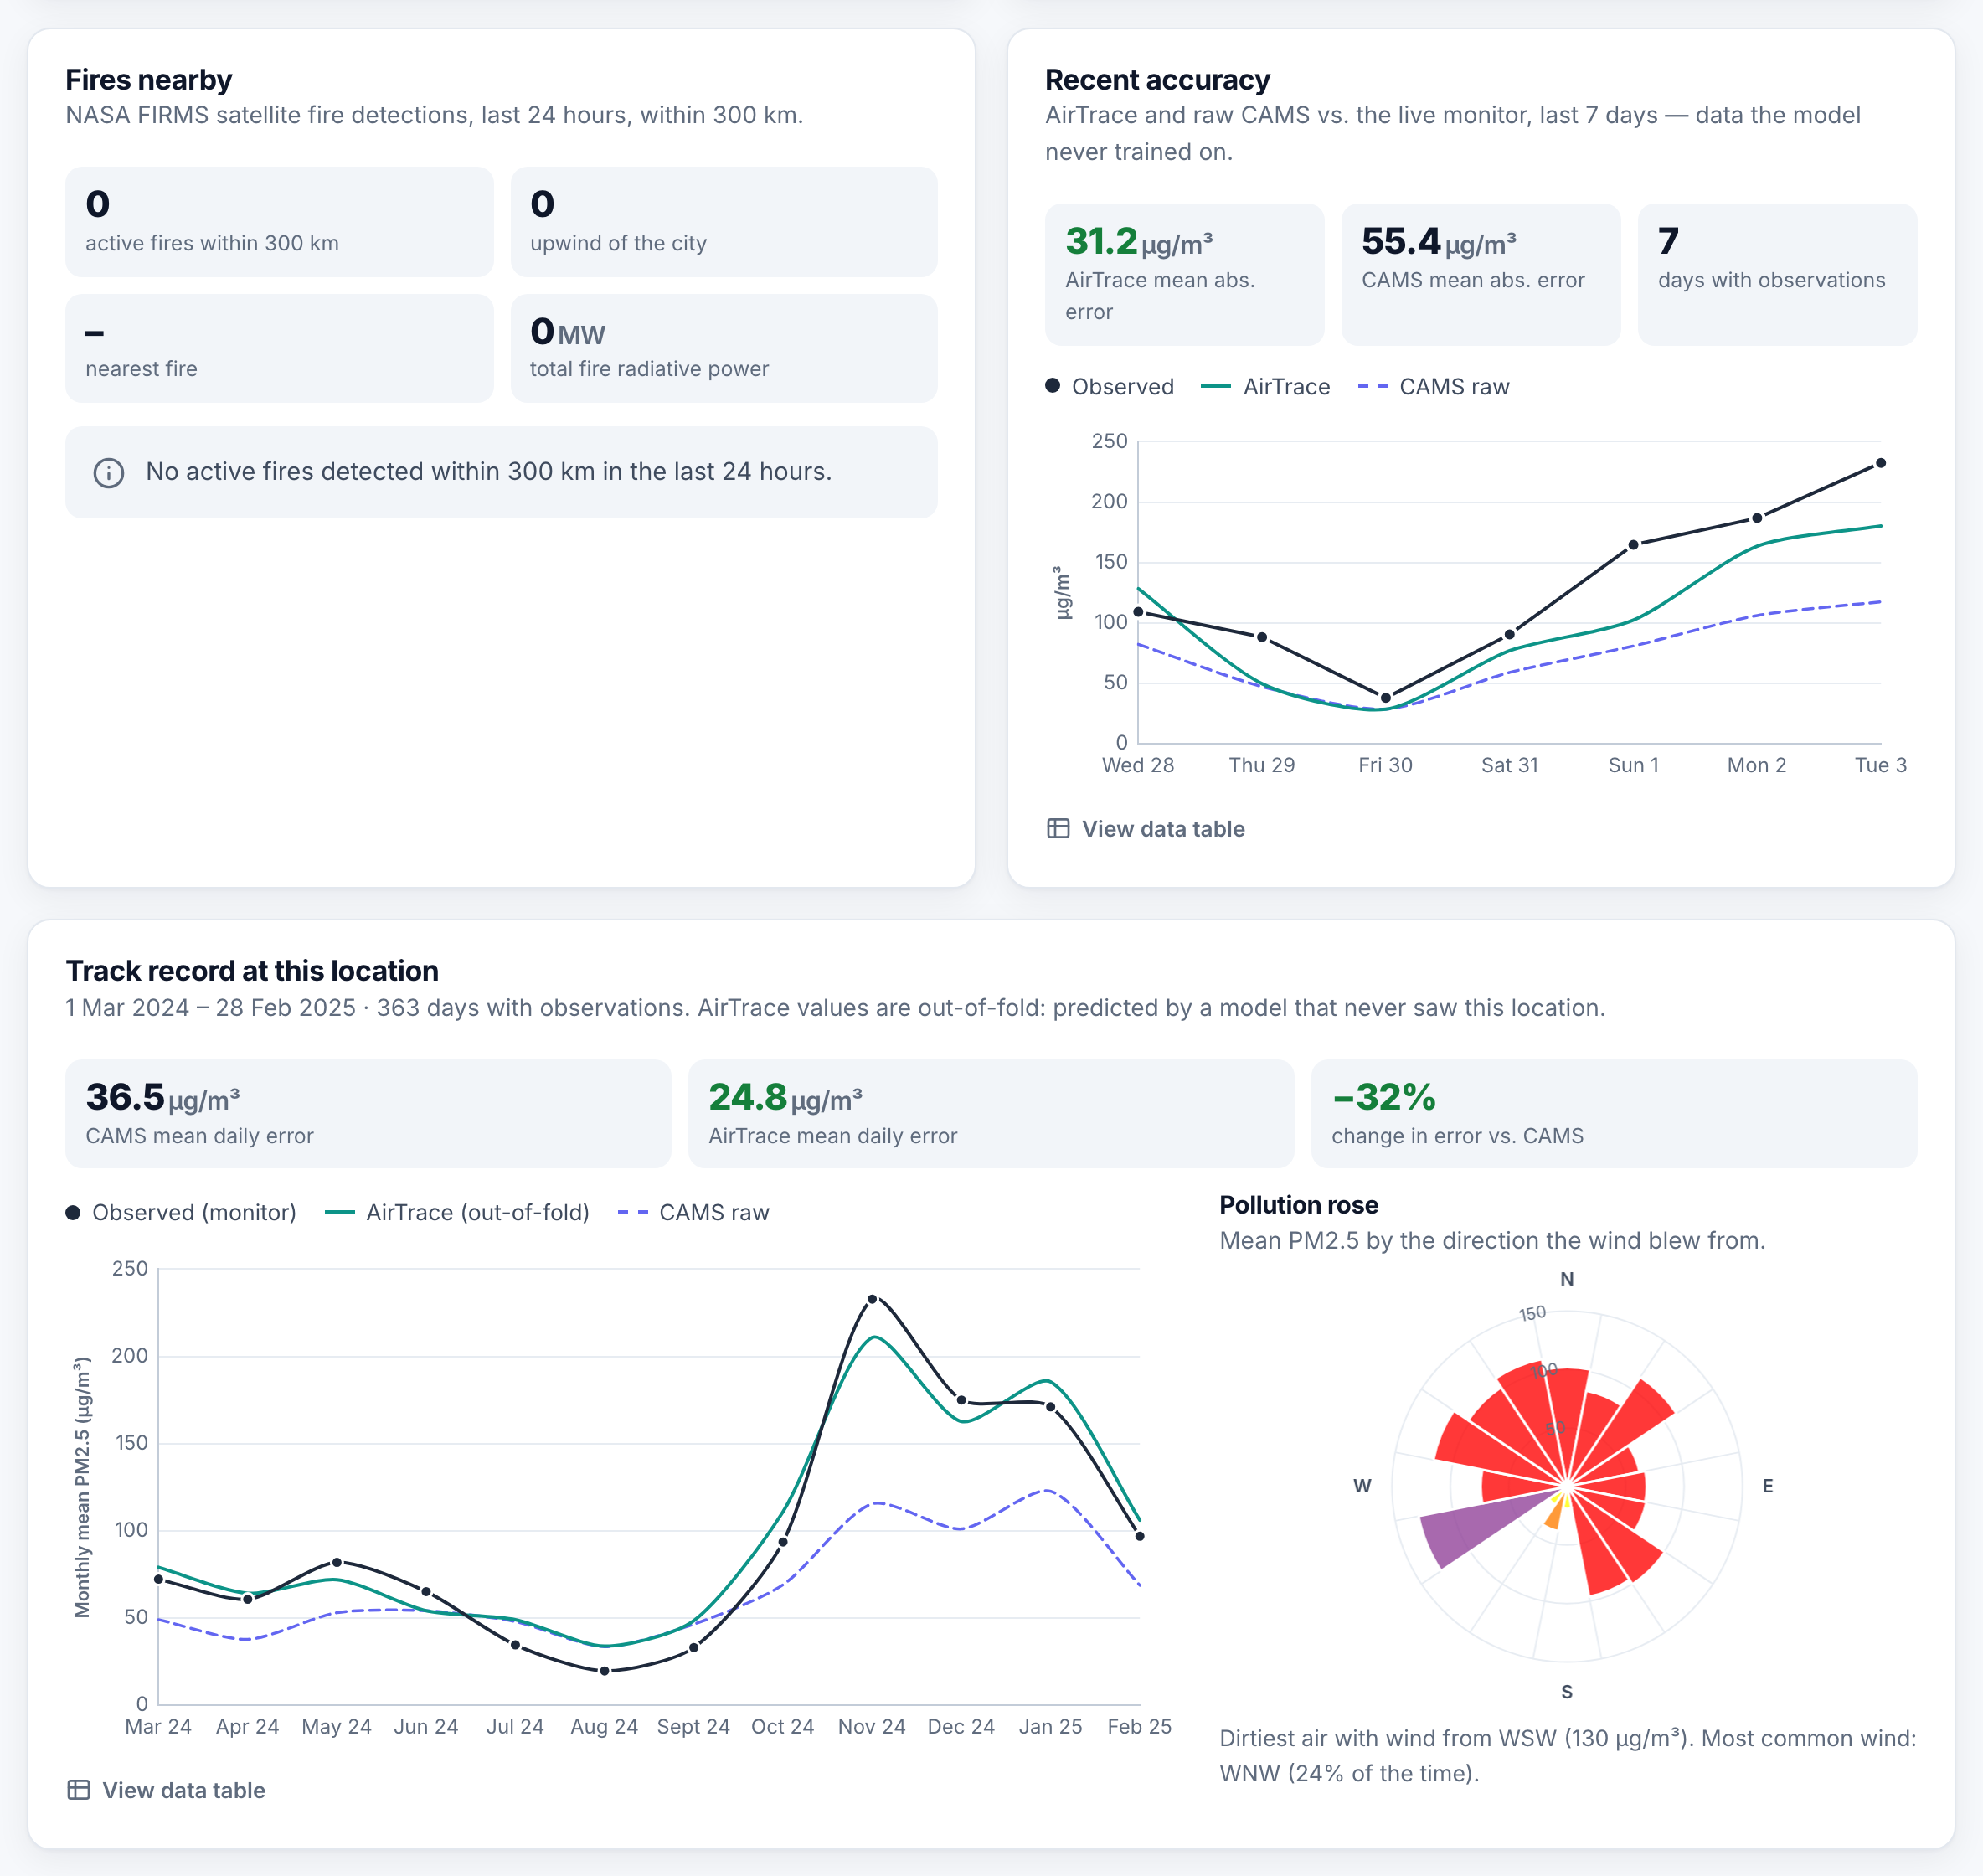
Fires within 300 km, recent accuracy against the local monitor, and the city’s track record.
-
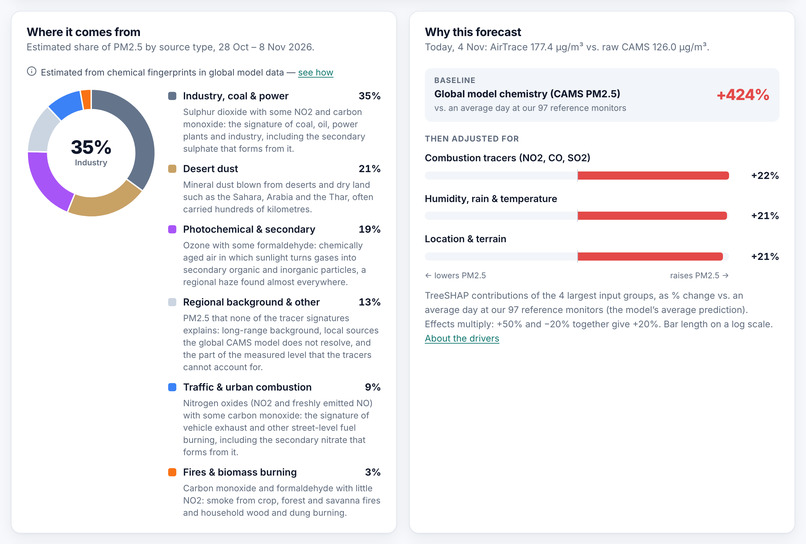
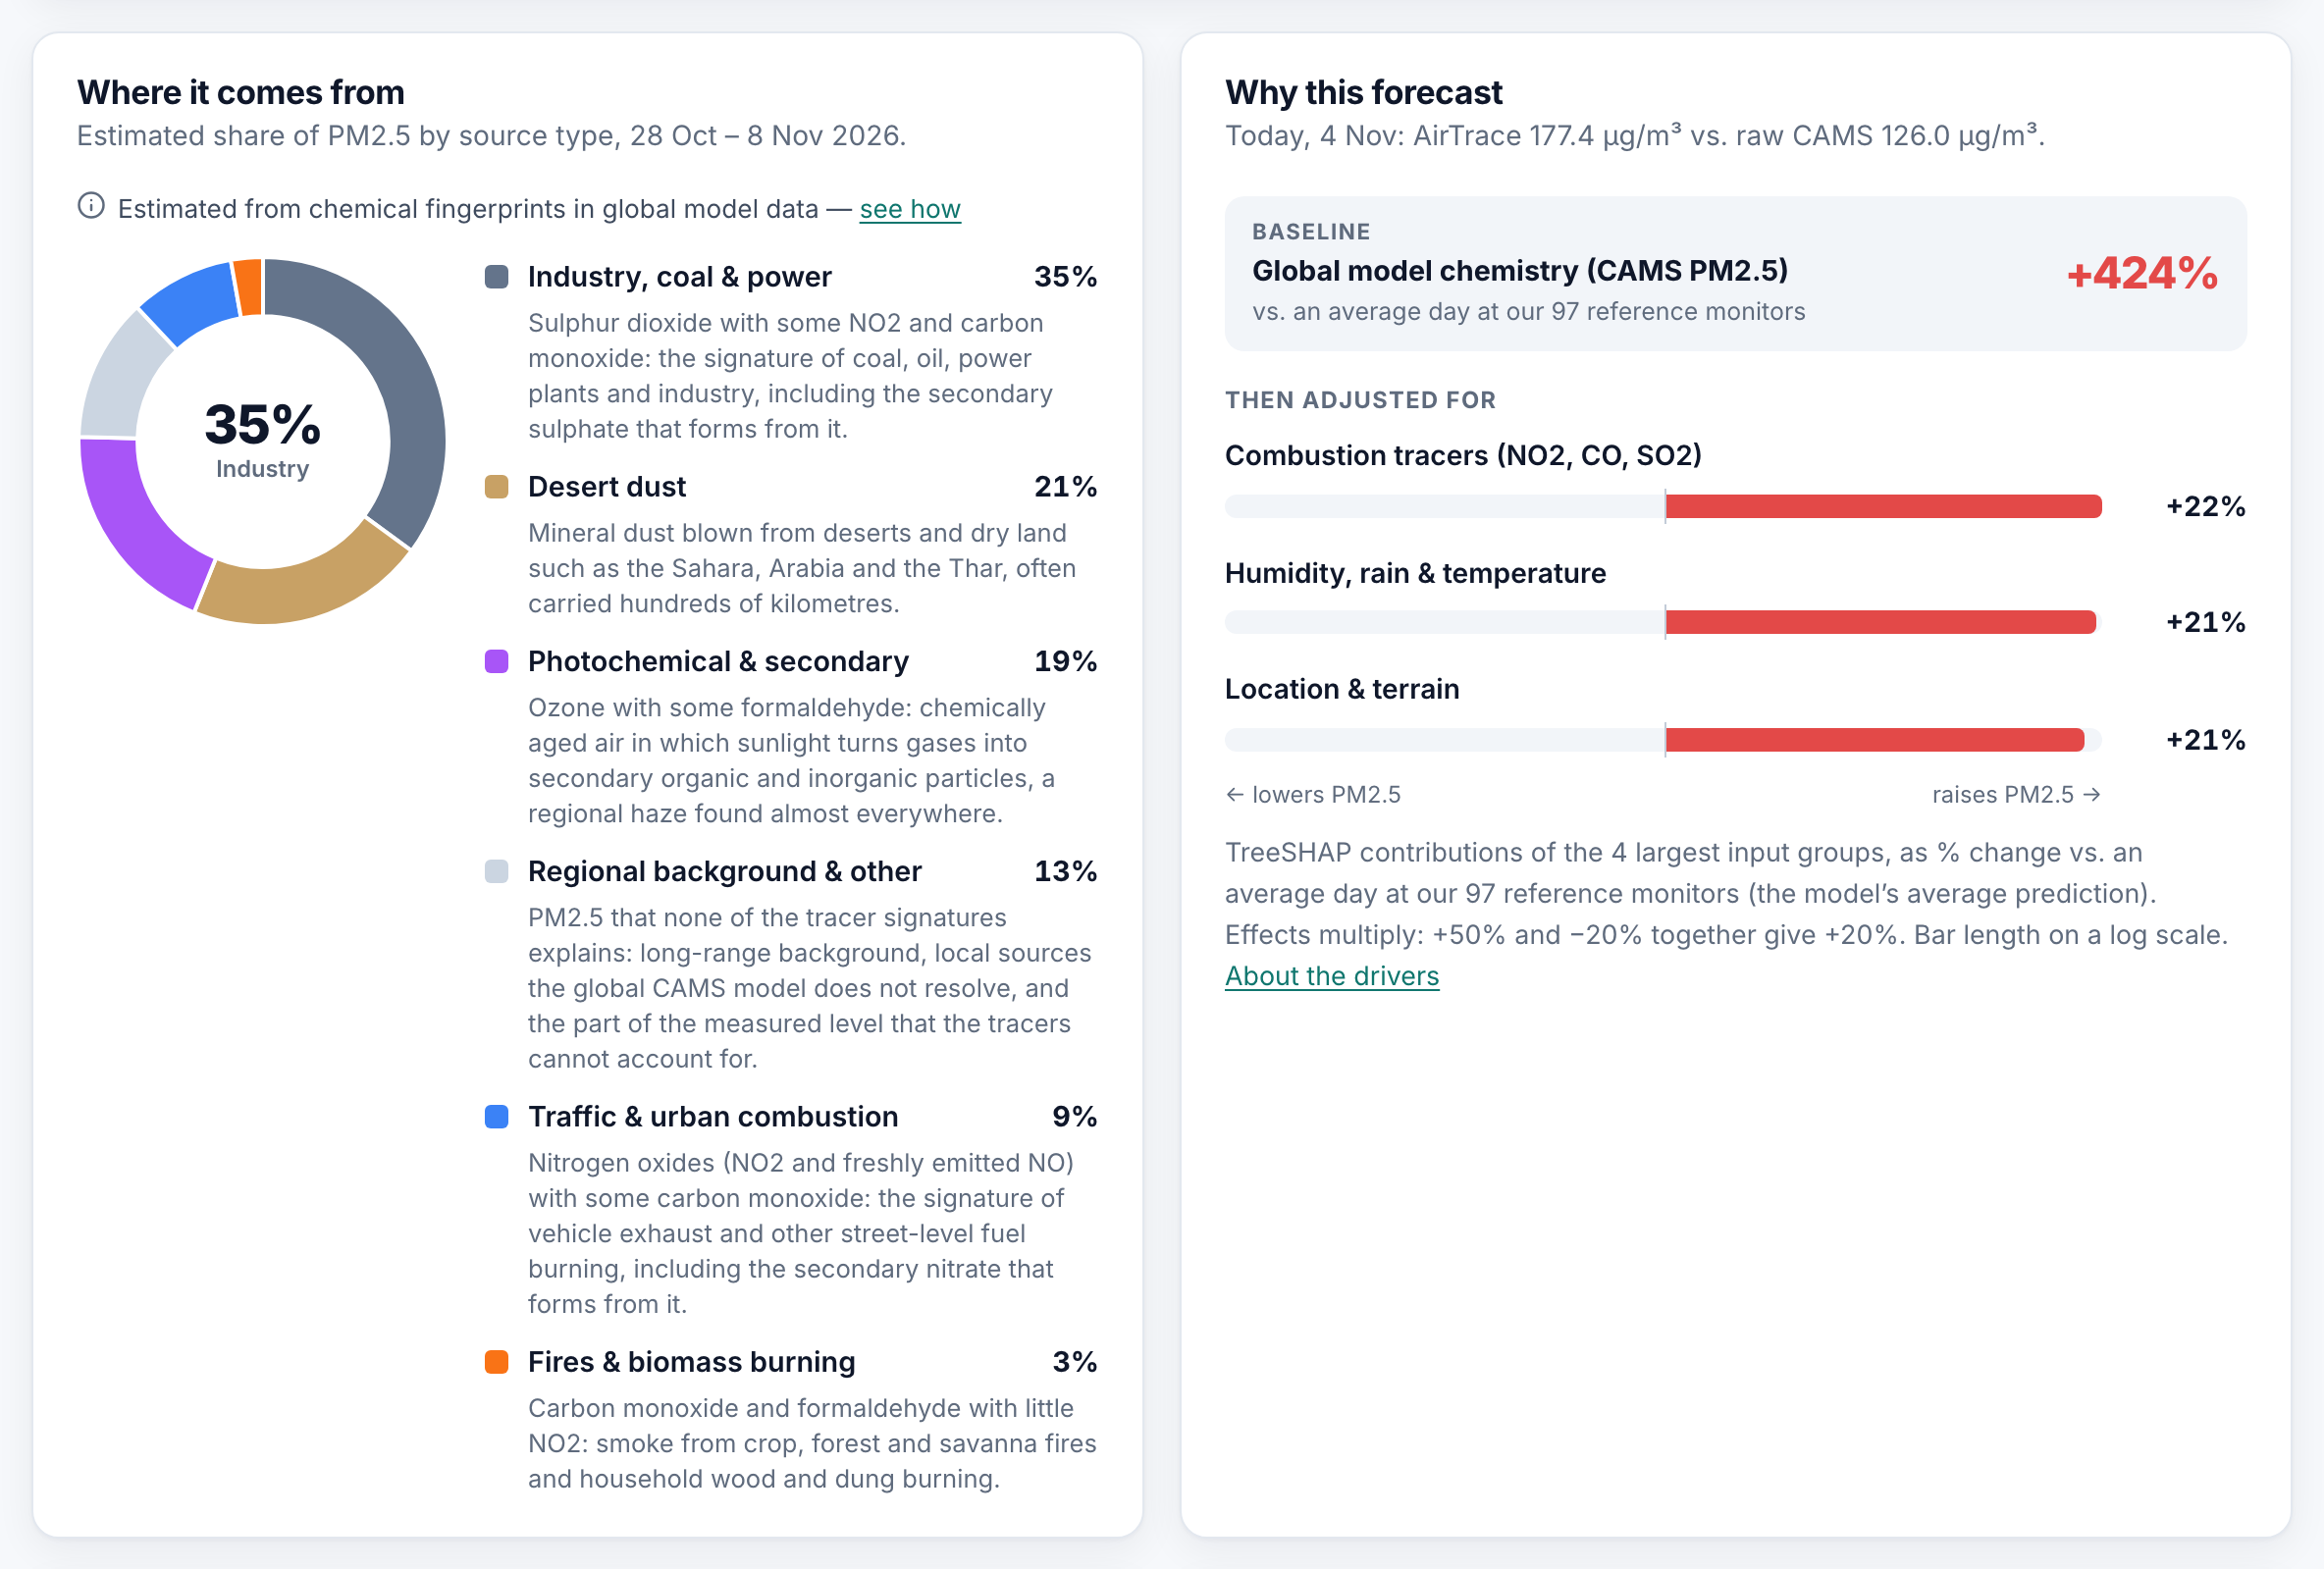
Estimated pollution sources, and which inputs pushed today’s forecast up or down.
-
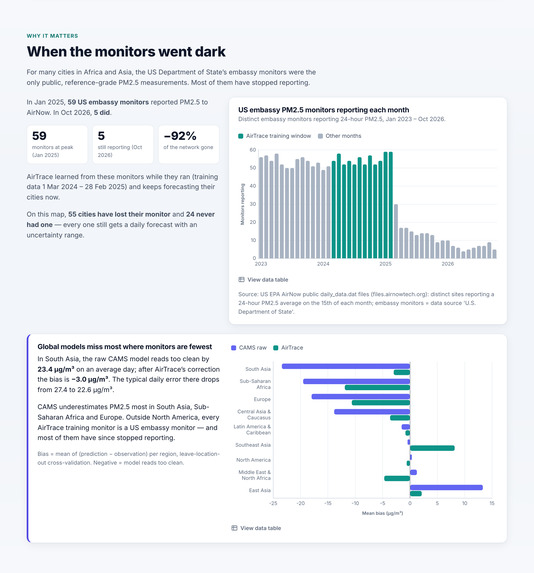
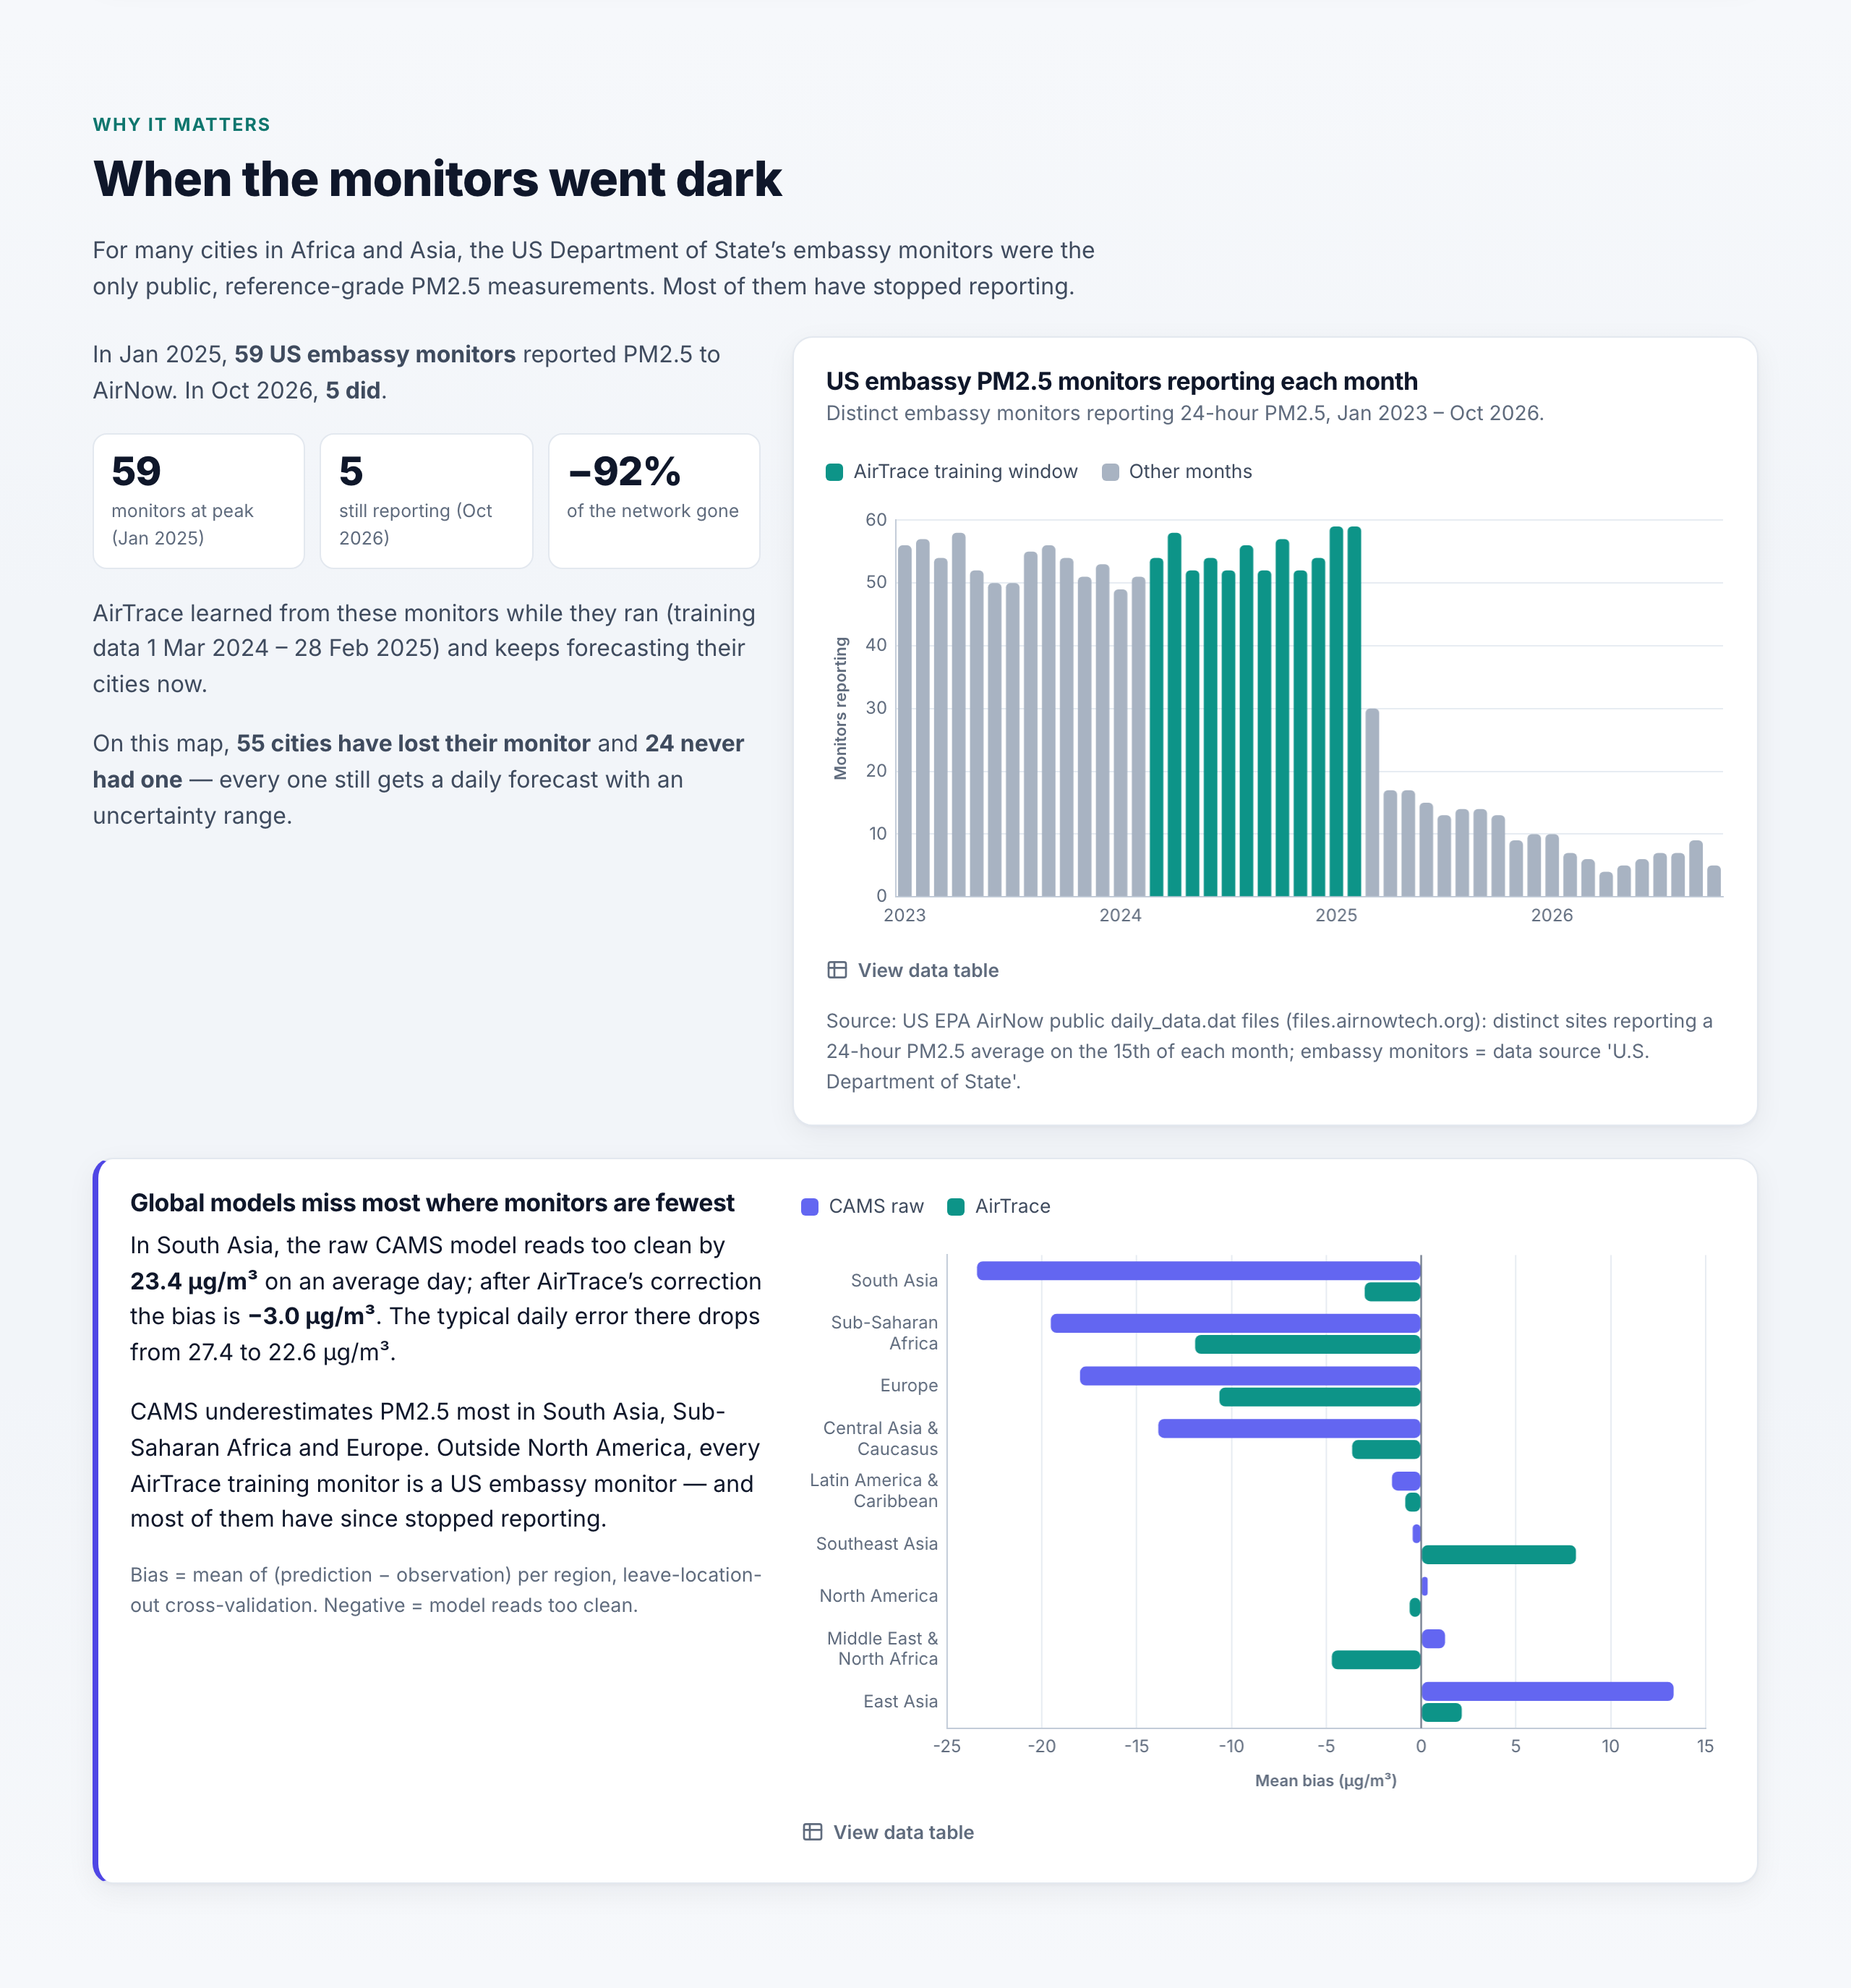
US embassy monitors reporting to AirNow fell from 59 in January 2025 to 5 in October 2026.
-
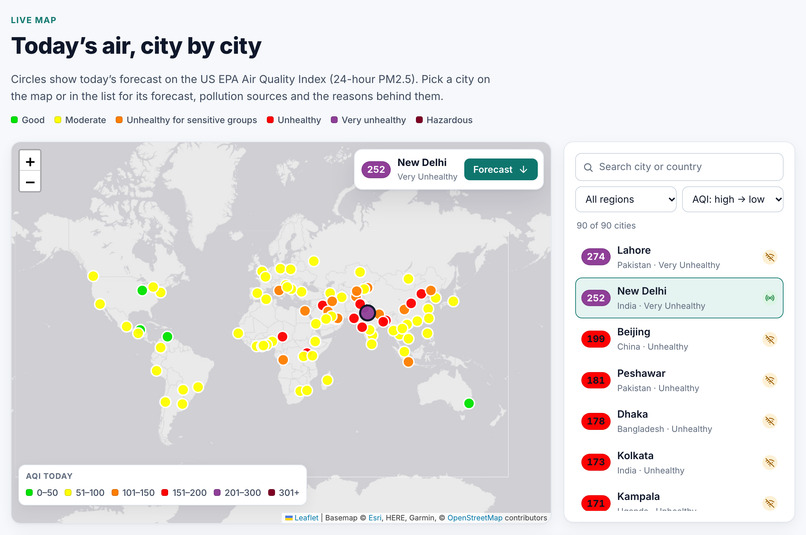
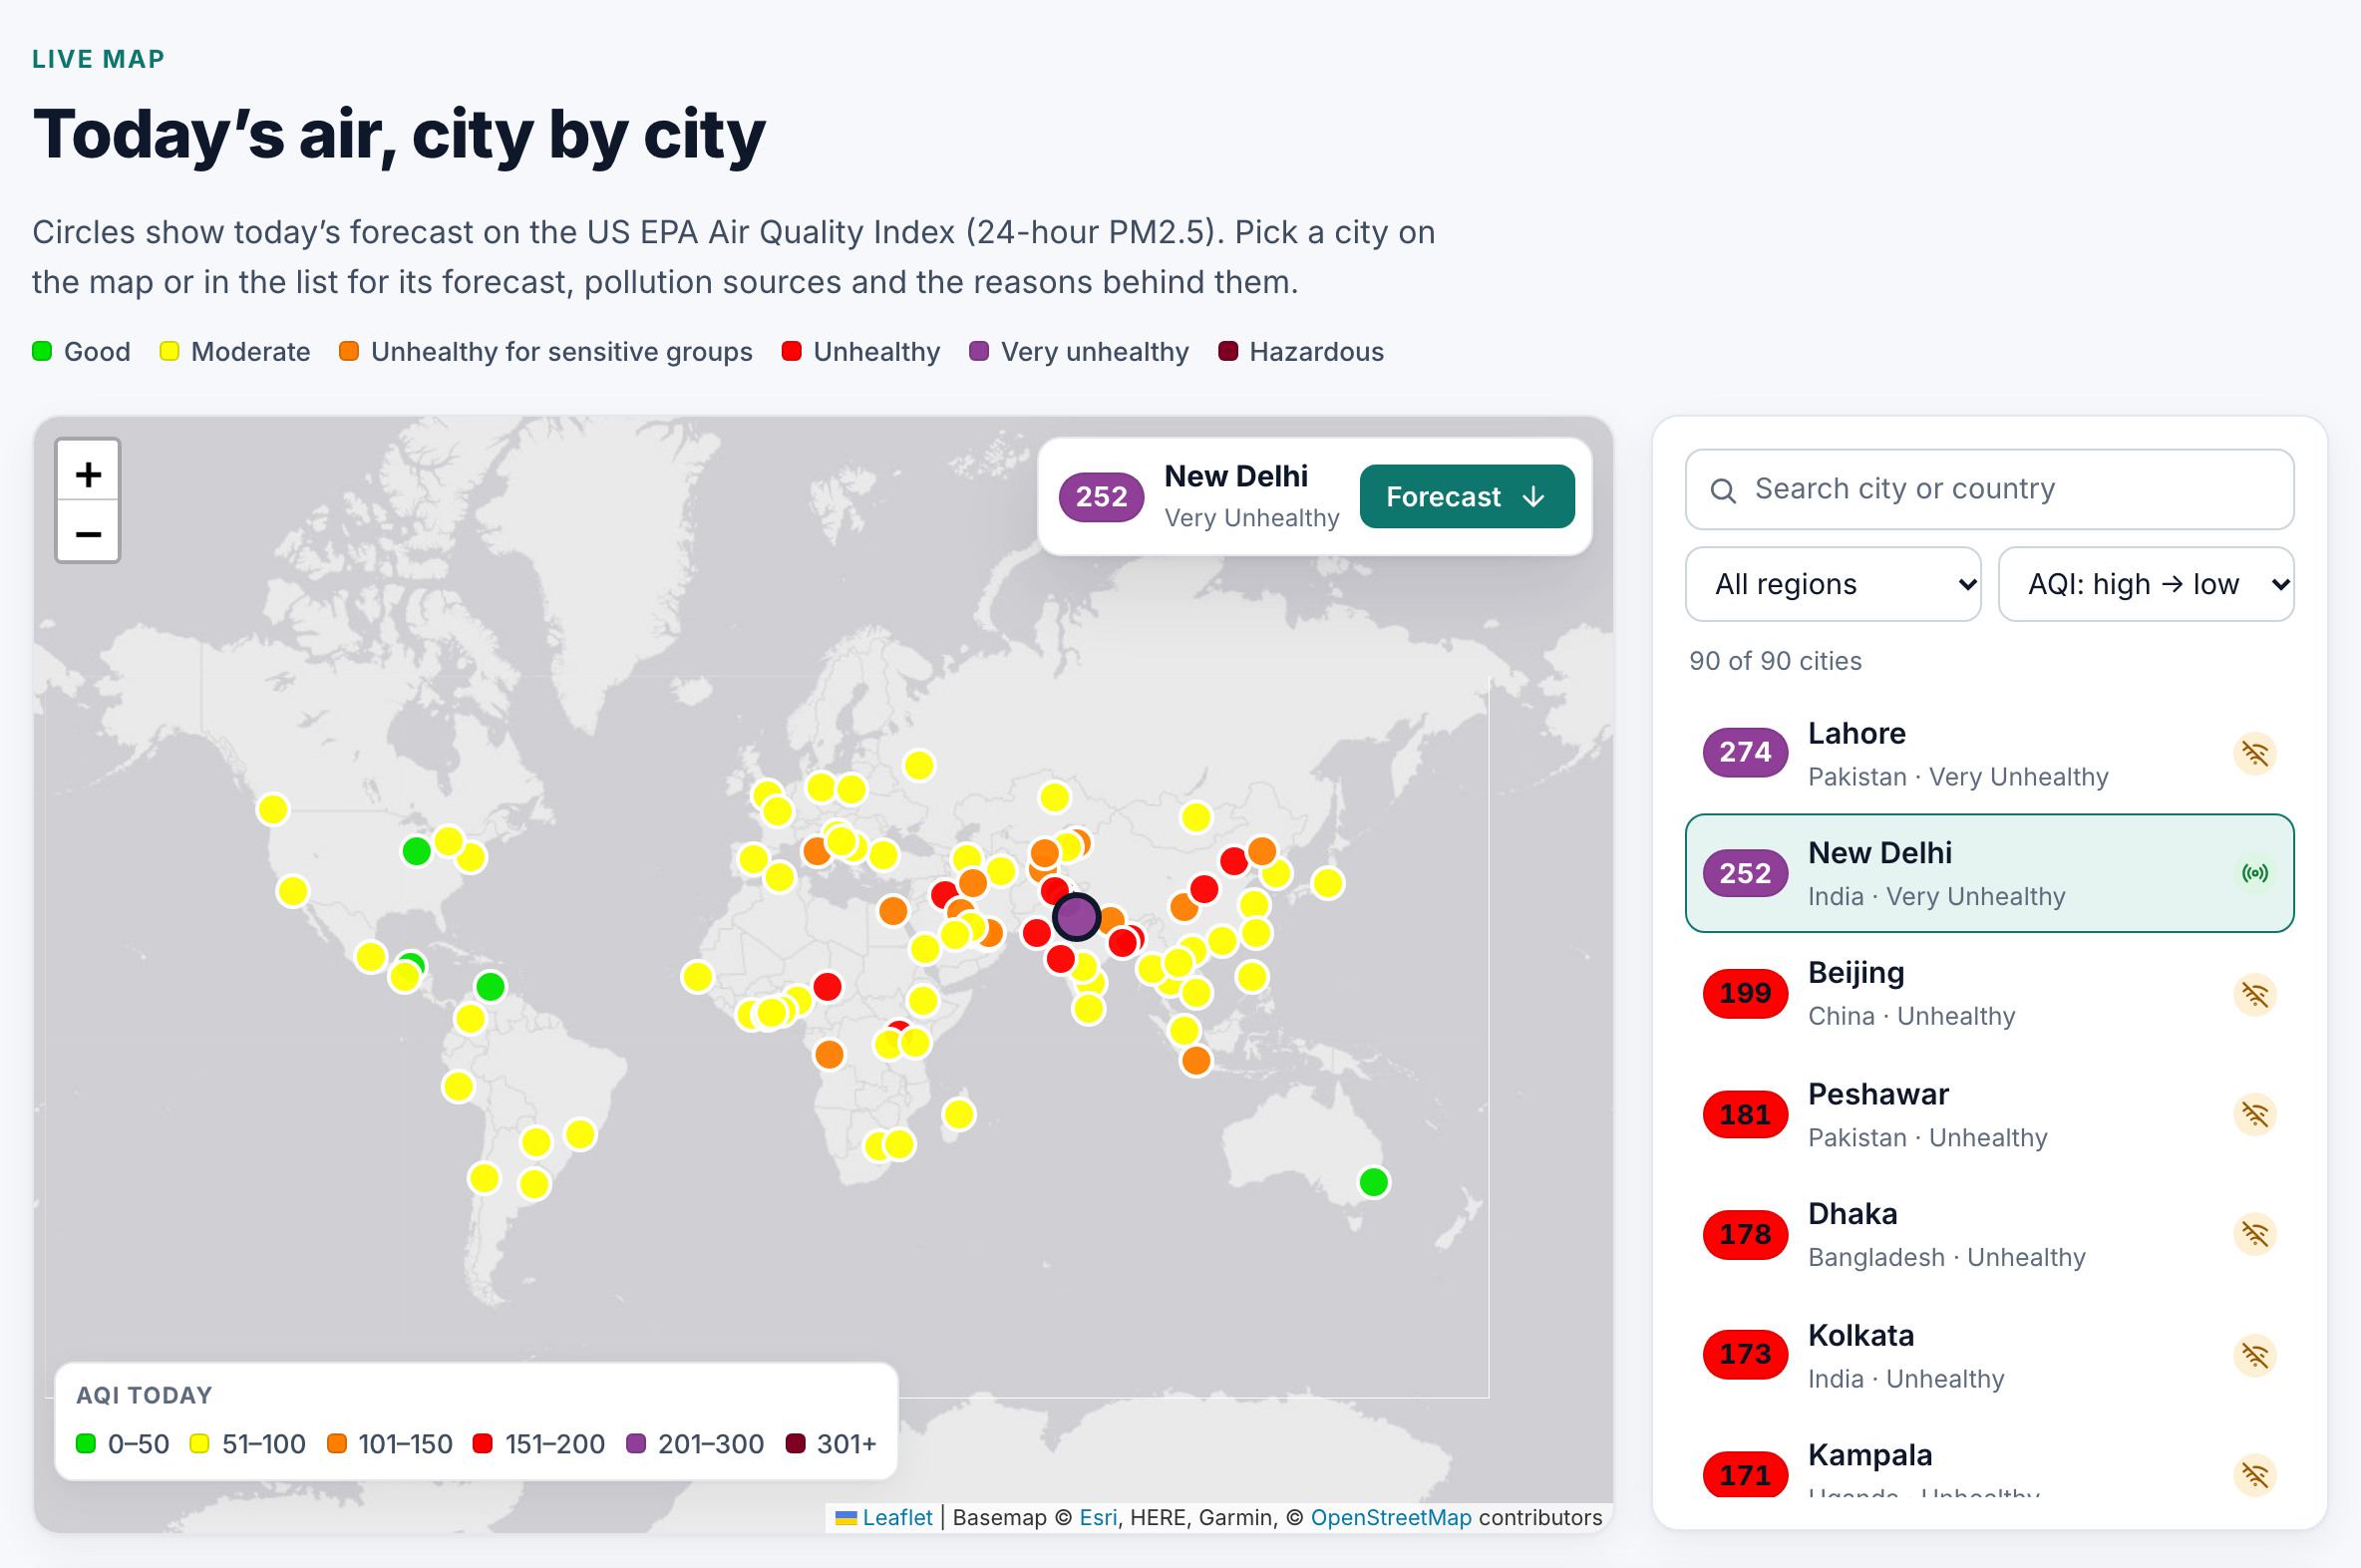
Today’s forecast for 90 cities on six continents. Pick a city on the map or in the list.
Inspiration
For a lot of cities in Africa and Asia, the only public reference-grade PM2.5 monitor was the one at the US embassy. In March 2025 the US State Department stopped sharing that data. I counted the embassy monitors still reporting in AirNow's public files: 59 in January 2025, 5 in October 2026.
Global models like Copernicus CAMS still give a number for every city, but in my data they underestimate PM2.5 by about 23 µg/m³ in South Asia and 20 µg/m³ in Sub-Saharan Africa. I wanted to see if the bias those monitors revealed could be learned and used after they went dark.
What it does
- Forecasts daily PM2.5 and US AQI for 90 cities, for today and up to 4 more days, with an 80% range.
- Explains each forecast: what pushed it up or down (weather, combustion gases, dust, season, location).
- Estimates where the pollution comes from: traffic, industry & coal, burning, dust, secondary aerosol, sea salt and background.
- Shows nearby fires from NASA FIRMS and flags the upwind ones.
- Shows a confidence level for every city and warns when the global model goes beyond anything in the training data.
- Updates itself every 6 hours with GitHub Actions, using only free data with no API keys.
Try it: handue.github.io/airtrace
How we built it
All the ML is written in Python with pandas, LightGBM, scikit-learn and SciPy.
- I used one year of daily PM2.5 (March 2024 to February 2025) from 97 reference monitors in 49 countries: 61 US embassy monitors and 36 in North America. For each one I pulled hourly CAMS data and ERA5 weather from Open-Meteo.
- From that I built 33 daily features (CAMS PM2.5, PM10, dust, gases, weather, season, location). The same code is used for training and for the live site.
- The model is LightGBM that corrects the CAMS forecast. Two versions are averaged, and quantile models with a conformal correction give the 80% range.
- For validation I held out whole clusters of monitors within 150 km of each other, and also tested on future months, whole countries and whole regions.
- Source attribution uses a chemical mass balance model on 8 CAMS tracers, calibrated against measured PM2.5.
- The website is a static site (Leaflet, Chart.js) on GitHub Pages, rebuilt every 6 hours by a GitHub Action.
I used Claude Code (Anthropic's AI coding assistant) a lot for writing code, running experiments and drafting the docs. The narration in the demo video is an AI voice (Kokoro, open source). More details are in the README.
Challenges we ran into
- The free Open-Meteo API has a daily limit, so I had to size the training set to fit inside it and cache every response.
- Some data was missing from the archives. Mixing height doesn't exist before July 2024, and three of the CAMS gases only start in September 2024. I left them out of the model after checking that it didn't hurt accuracy.
- My first validation split grouped monitors by 1° grid cells, and nearby monitors ended up on both sides of the split. That made the result look better than it was (−17%). After switching to 150 km clusters the real improvement was −12%.
- Source attribution was harder than expected. NMF and PMF kept pushing traffic or sea salt to zero, so I switched to fixed chemical profiles. Only 2 of the 5 sanity checks I set up pass, and I wrote that in the README.
Accomplishments that we're proud of
- At locations the model never saw, the average error dropped from 13.65 to 11.98 µg/m³ (about 12%) and R² went from 0.44 to 0.57. It gets the AQI category right on 64% of days compared with 59% for CAMS, and catches 66% of unhealthy days compared with 51%.
- In South Asia, CAMS underestimates PM2.5 by 23 µg/m³ on average. After the correction it's down to 3.
- For monitors it had already learned, the error on later months dropped by 37% (19.8 to 12.5). That's the case for the 55 cities on the site whose embassy monitor is now offline.
- On new data from late October 2026, at the 10 cities that still have monitors, the error went from 15.8 to 9.7 µg/m³. In New Delhi on November 3 the monitor measured 233, CAMS said 118 and AirTrace said 180.
- The site tells you when not to trust it, with a confidence level for each city and a warning when the input goes beyond the training data.
What we learned
Global chemistry models get the overall patterns right, but they're biased in places with no ground monitors. A small amount of reference data fixes a good part of that, though mostly close to where the data comes from. When I held out whole countries the gain dropped to about 8%, and for a region with no training monitor at all it didn't beat CAMS.
I also learned to be careful with validation, since my first setup overstated the result.
What's next for AirTrace
- Add low-cost sensor data (Sensor.Community, PurpleAir), especially in Africa and Latin America
- Use satellite data and move to hourly nowcasts
- Measure real day 3 to 5 forecast accuracy as the live archive grows
- Simple alerts for cities that have no monitor
Built With
- airnow
- chart.js
- copernicus-cams
- github
- github-actions
- javascript
- leaflet.js
- lightgbm
- nasa-firms
- numpy
- open-meteo
- pandas
- python
- scikit-learn
- scipy
