Inspiration
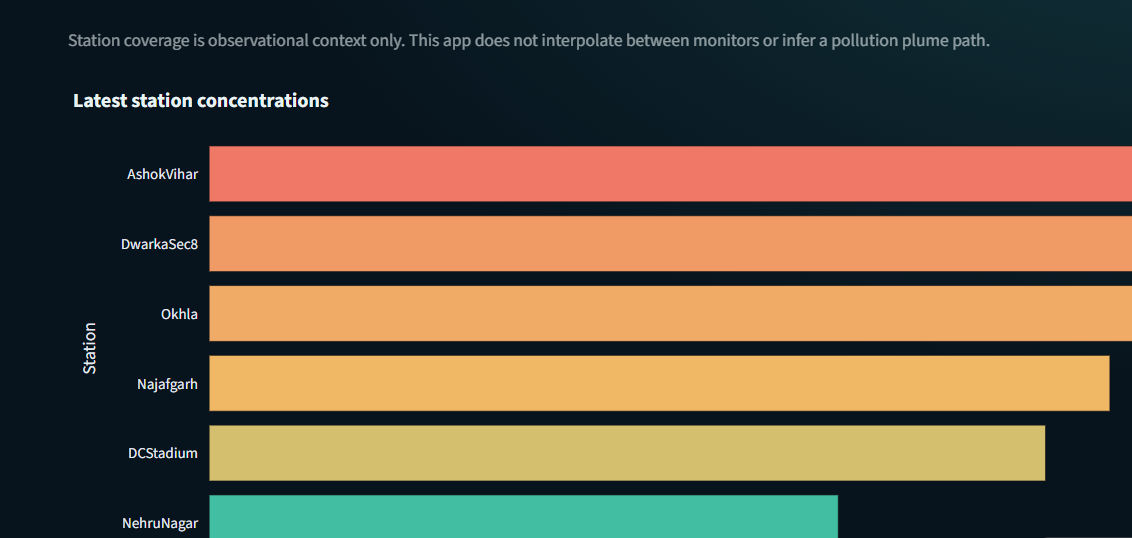
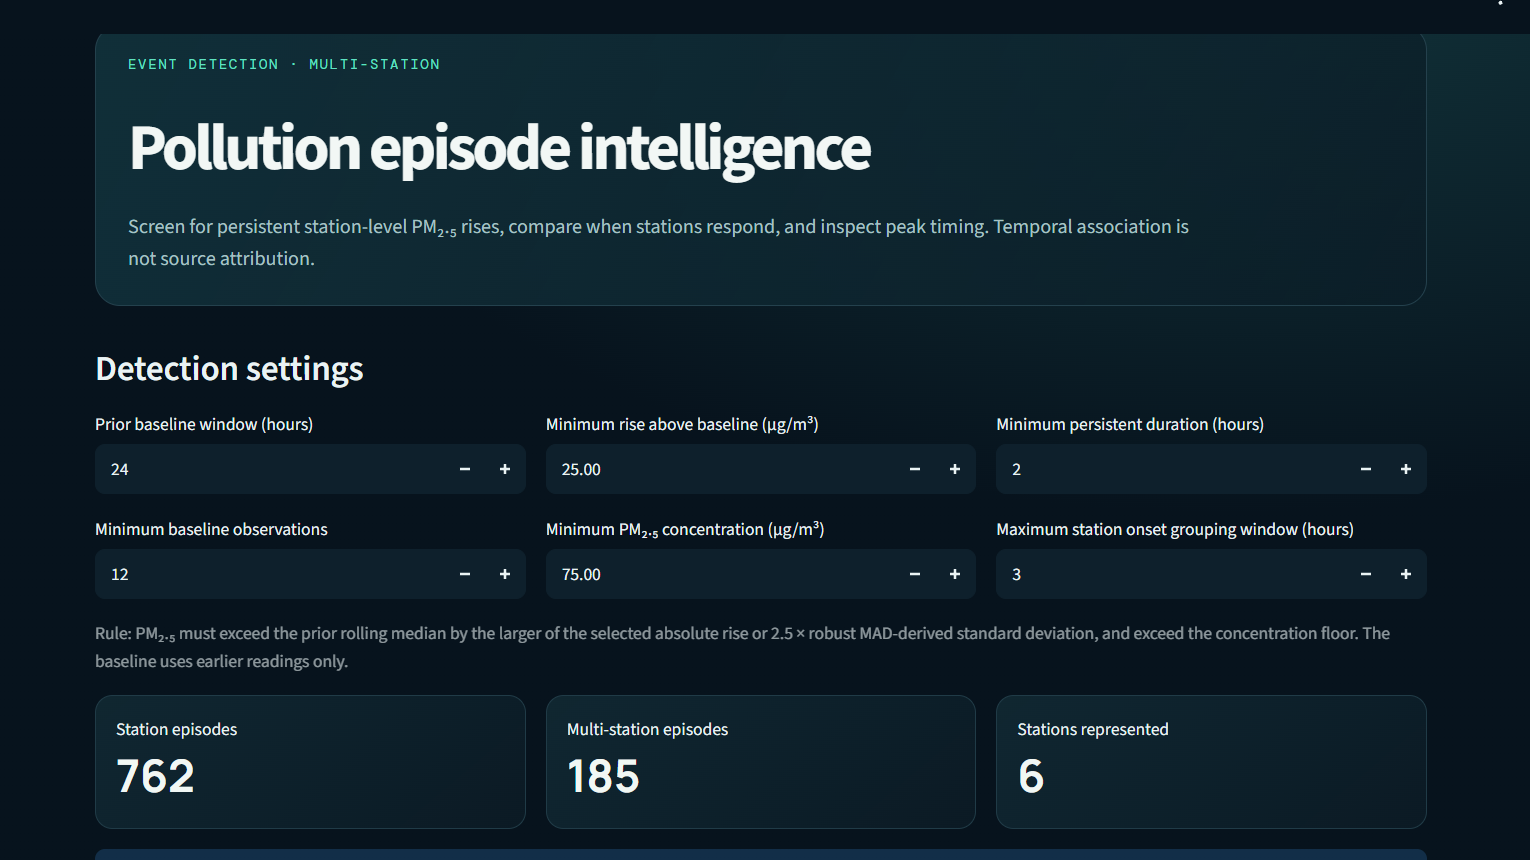
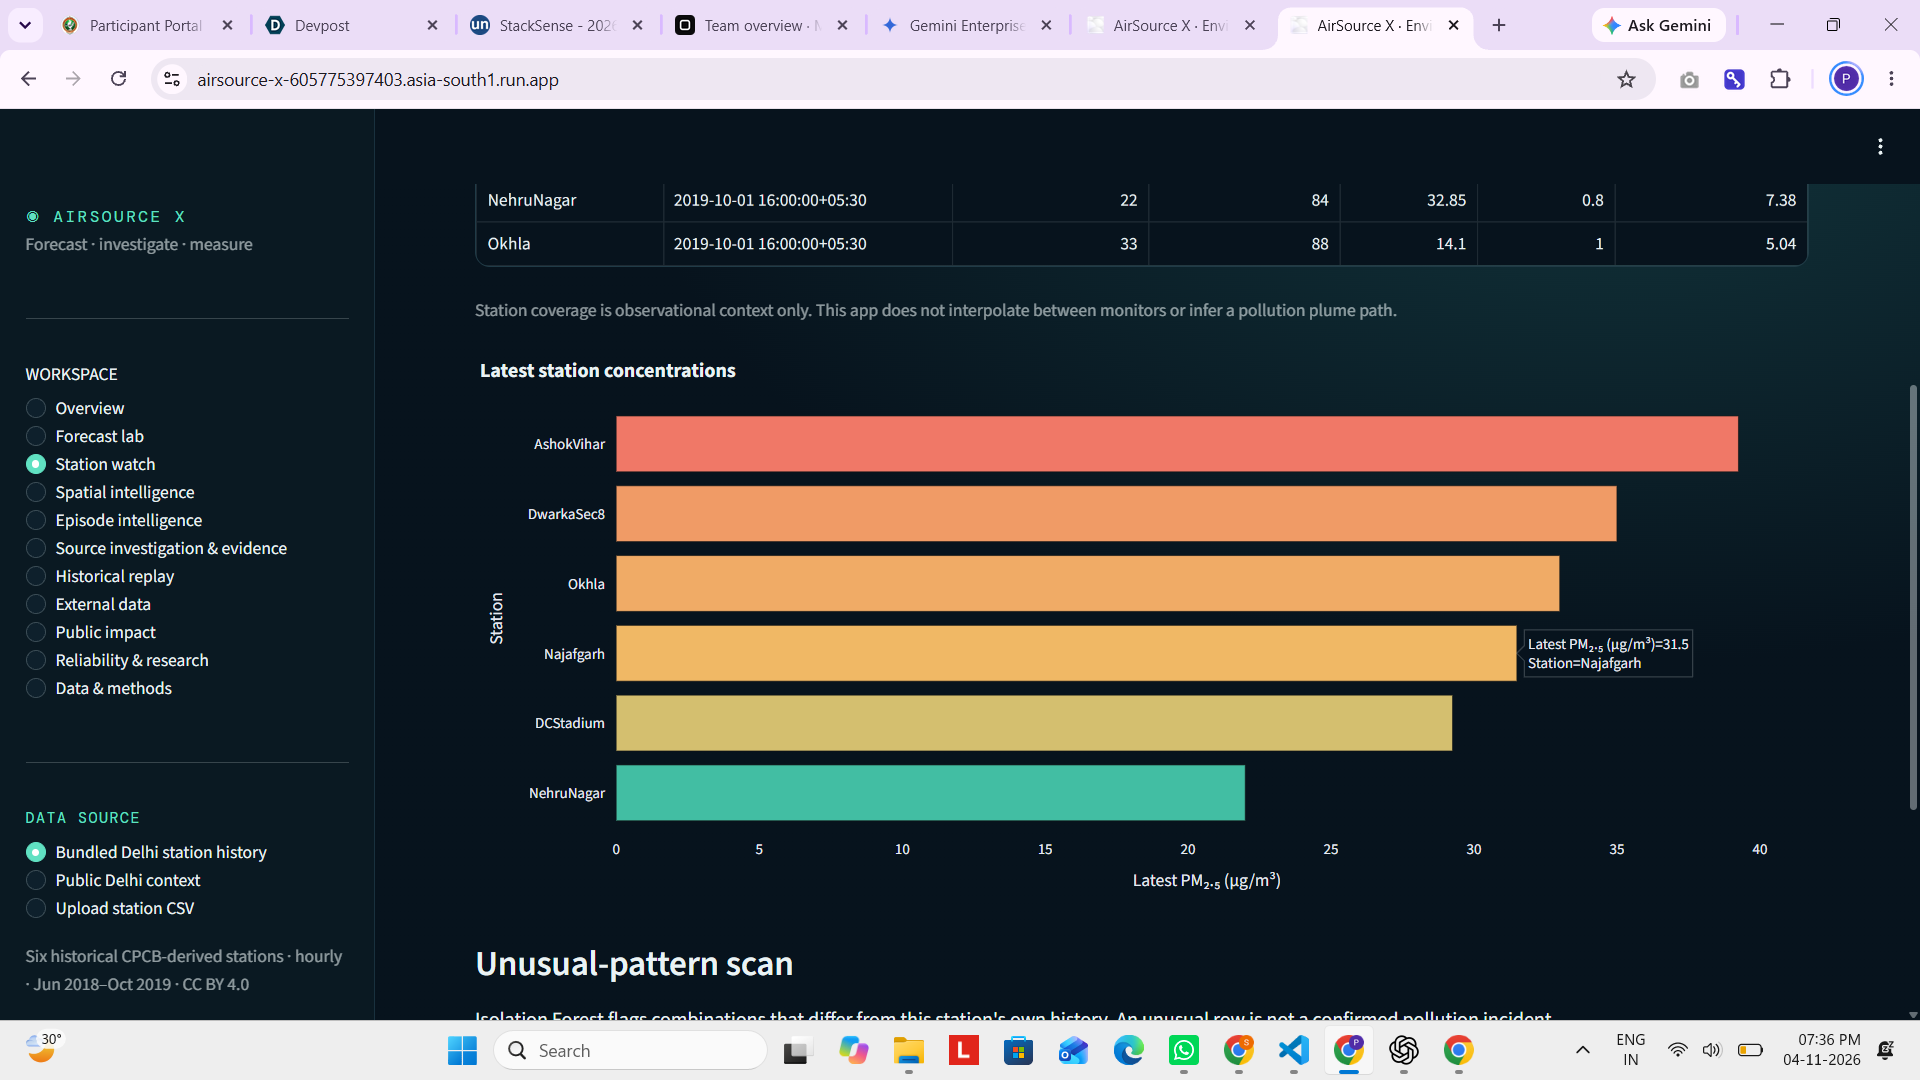
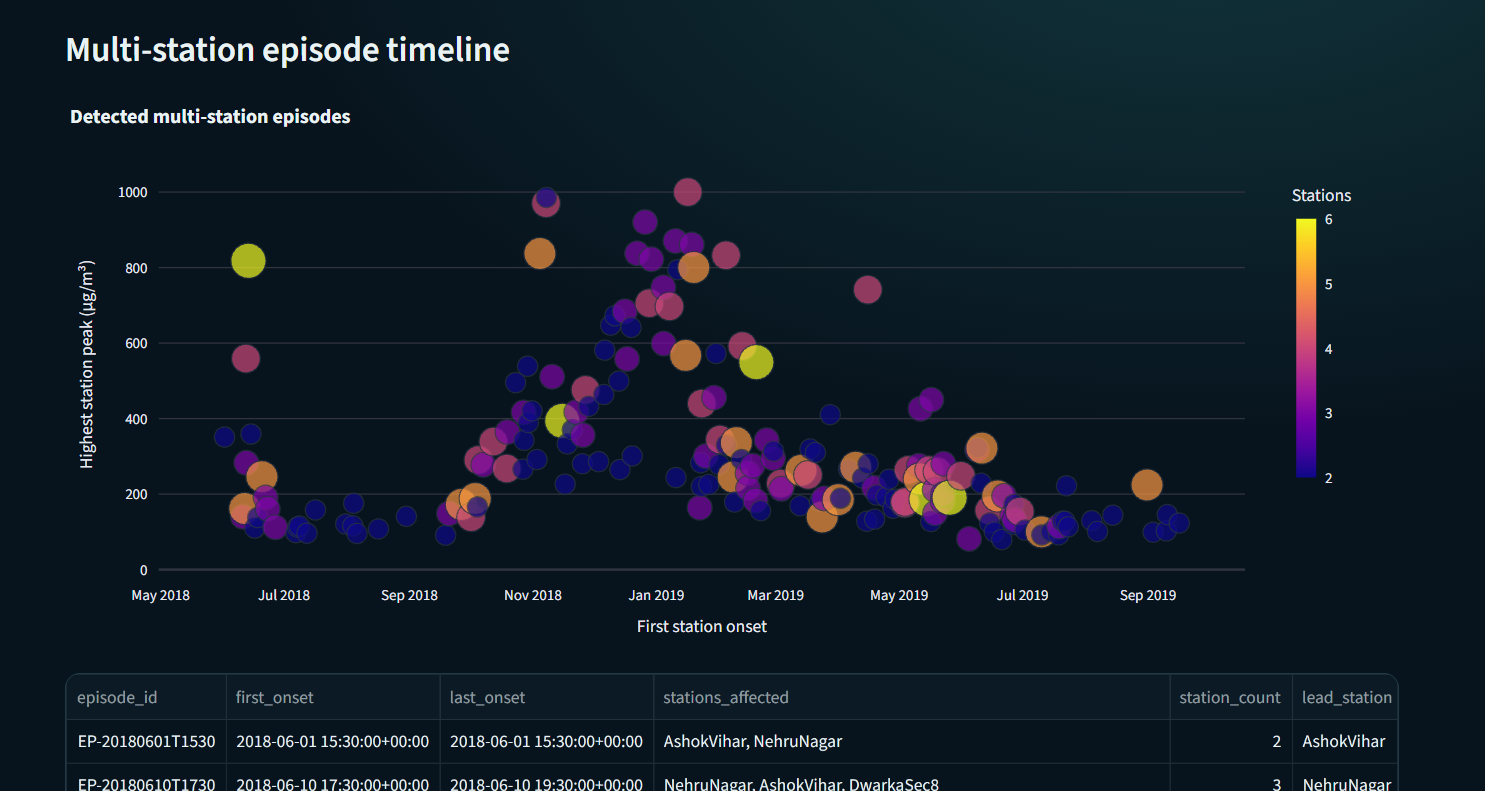
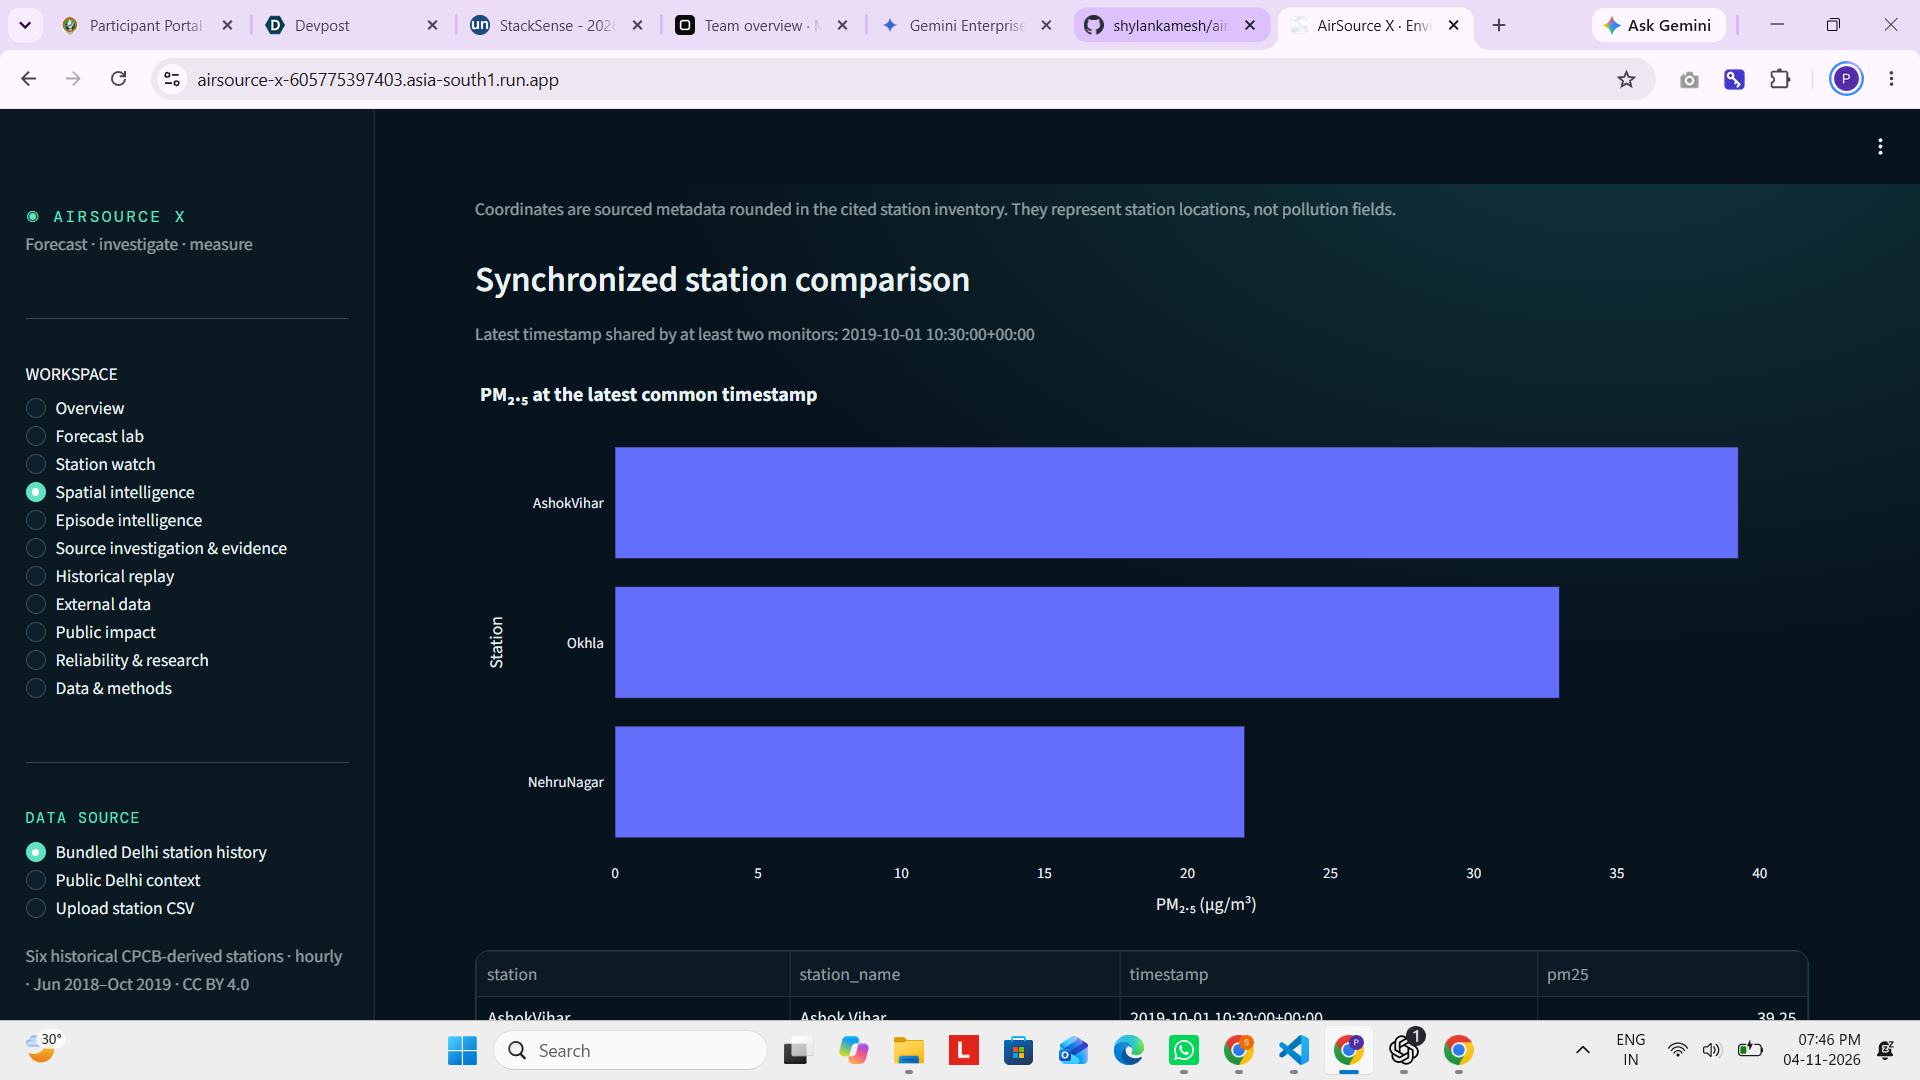
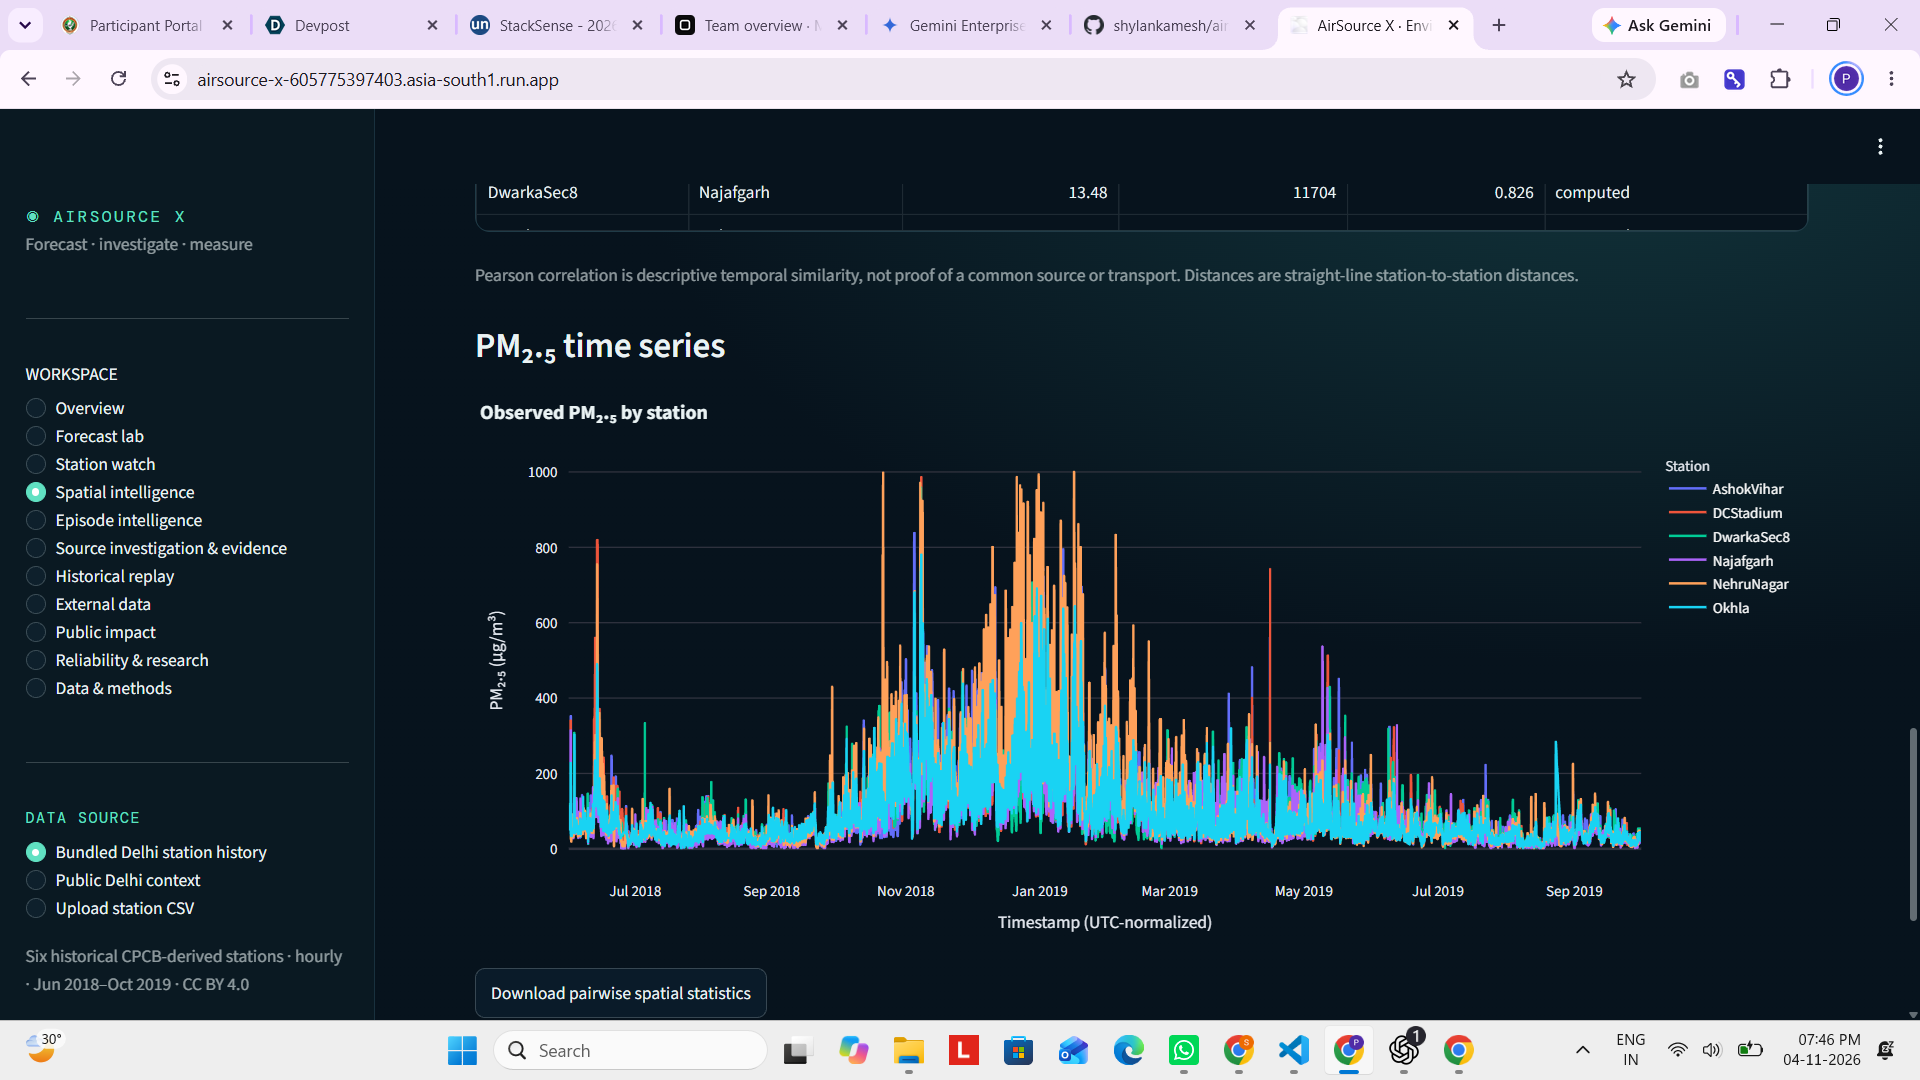
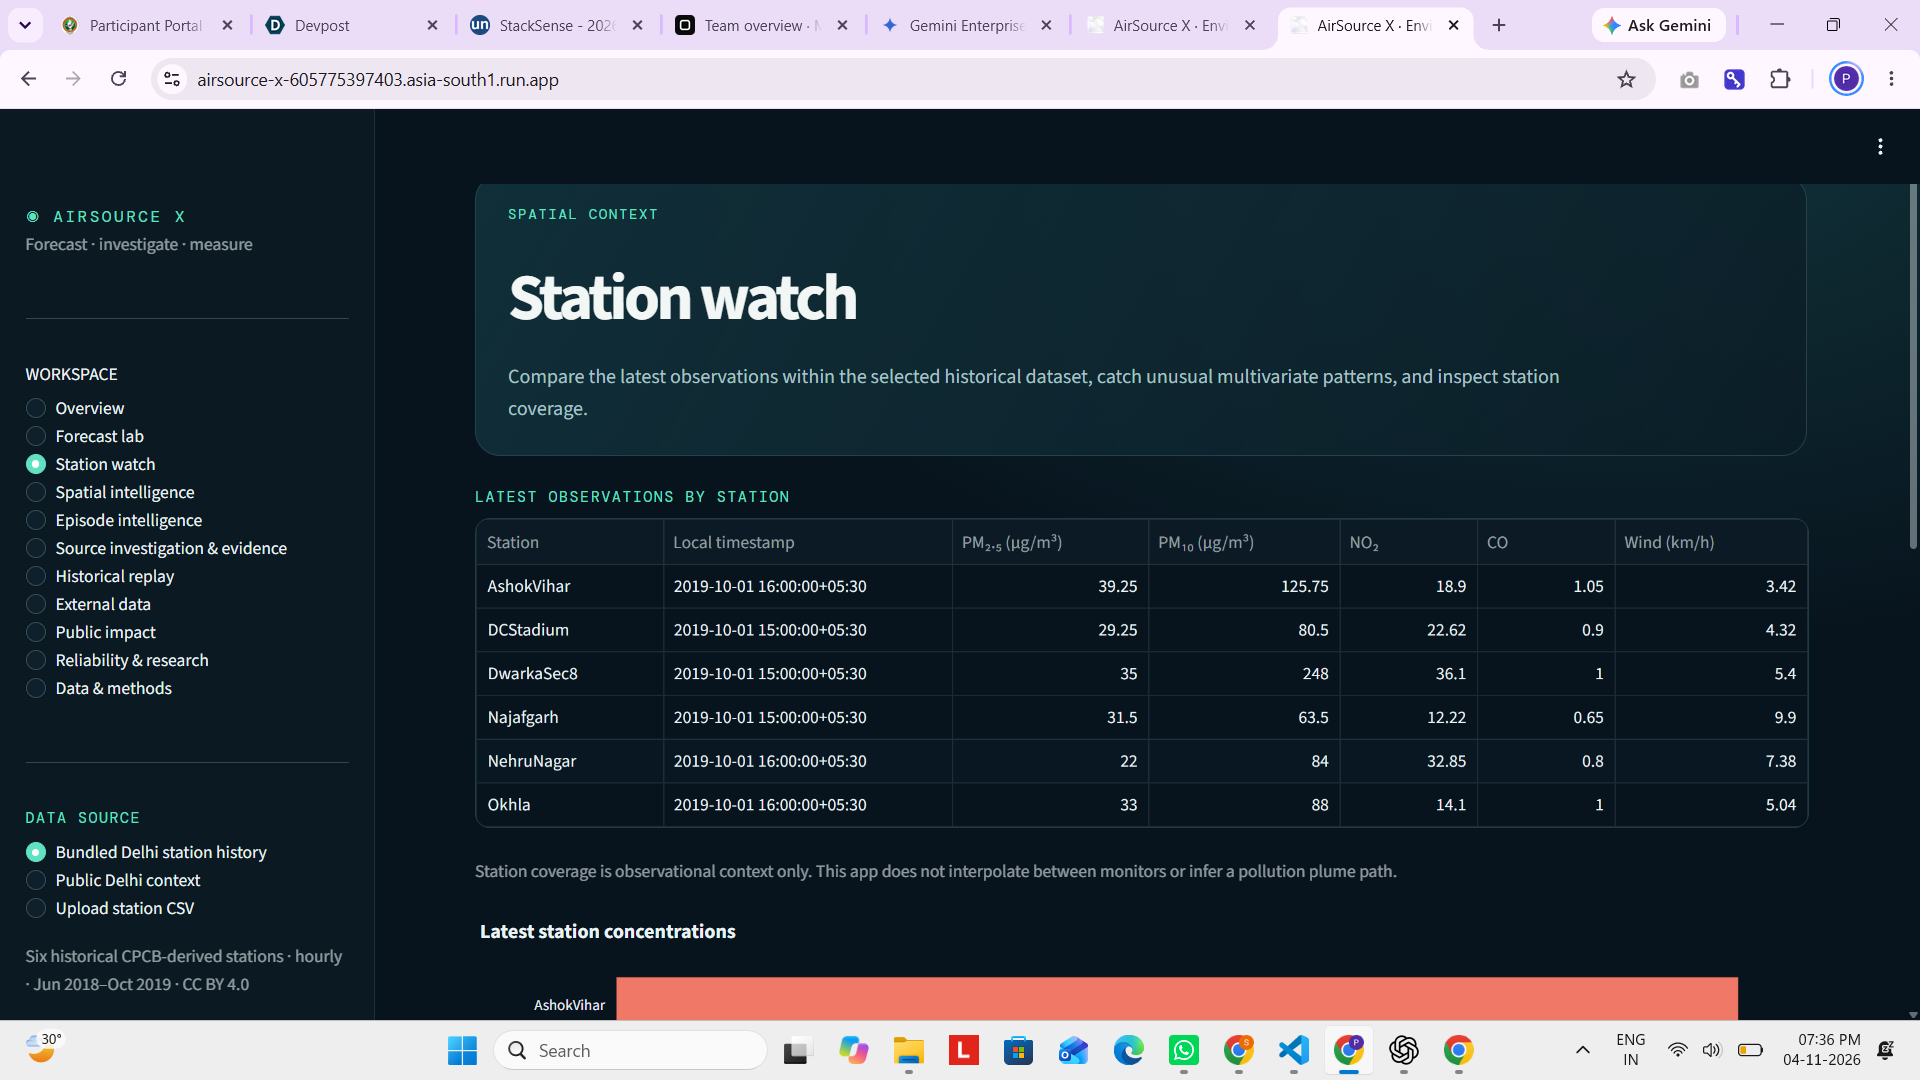
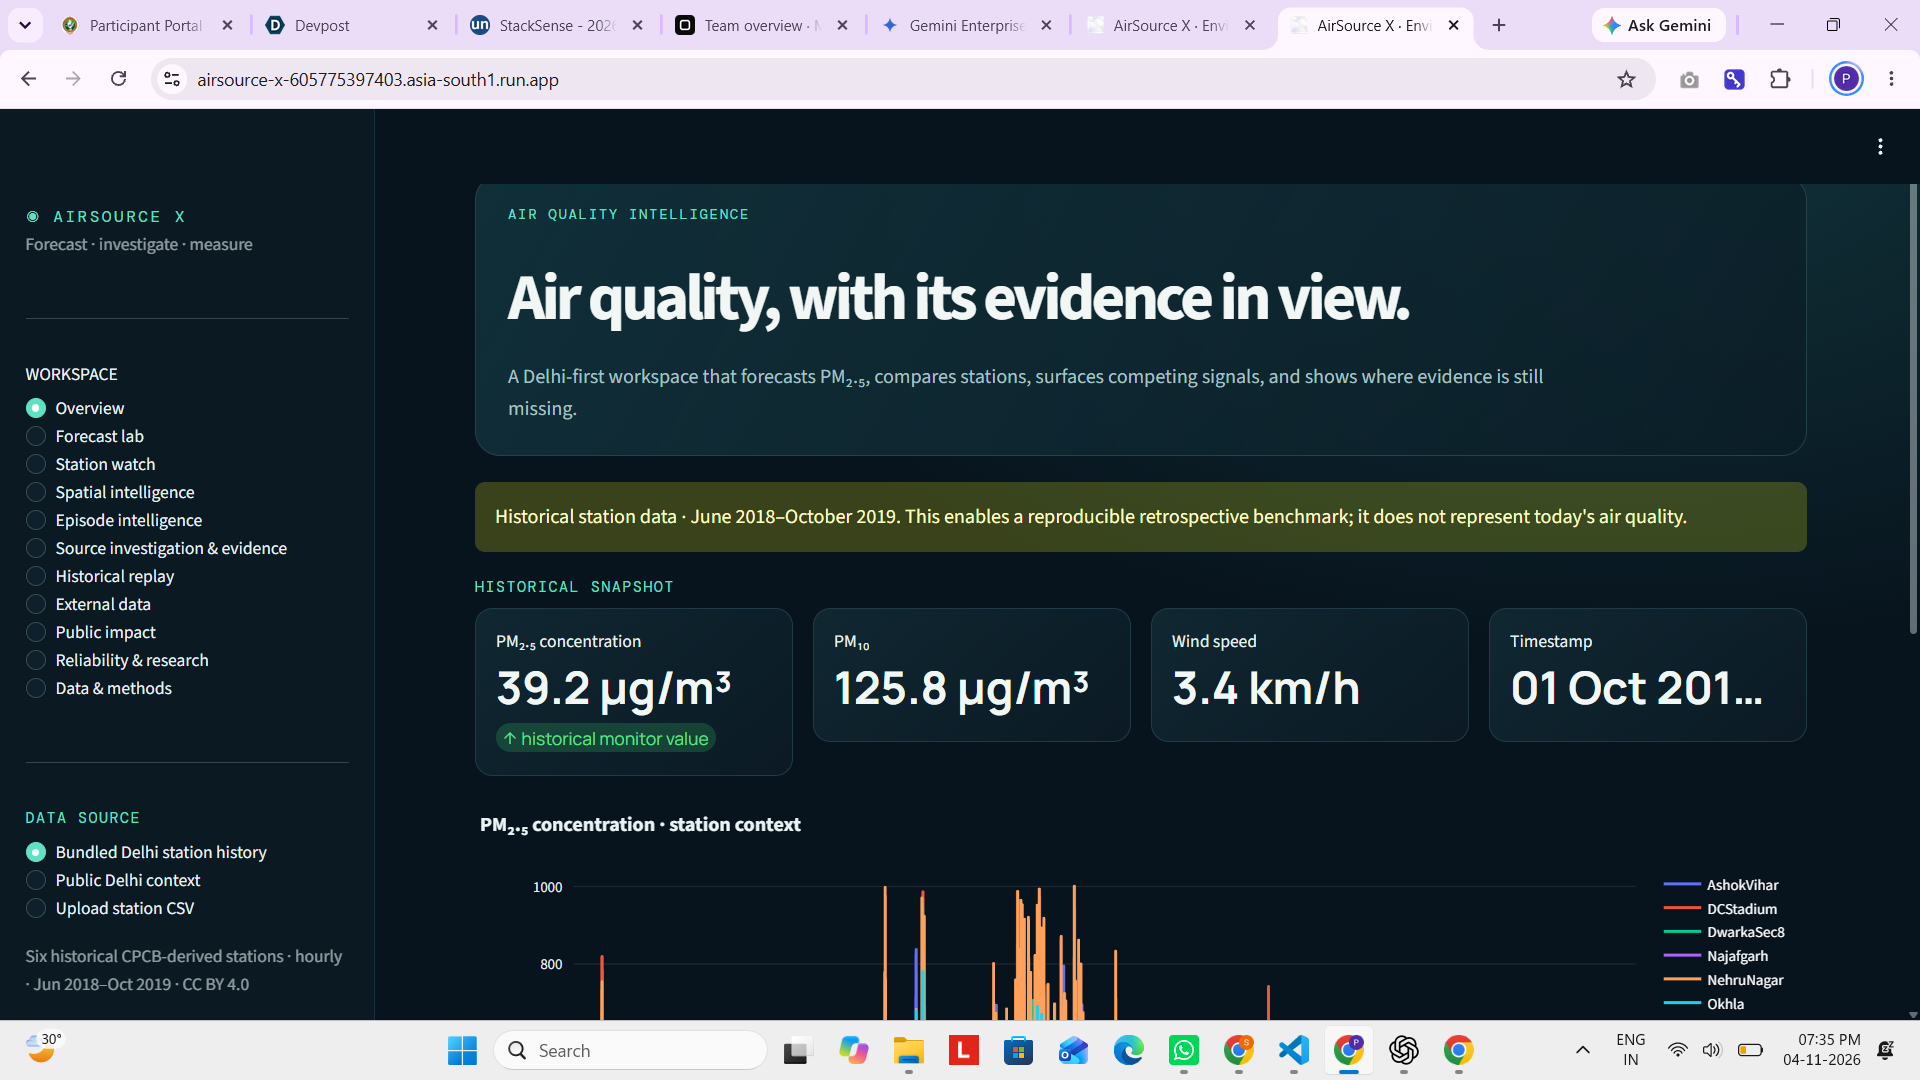
Air-quality dashboards show pollutant readings, but it can be hard to compare stations, explore possible explanations for an episode, or see what evidence is missing. We built AirSource X to make those steps easier to inspect while being clear about uncertainty.
What we built
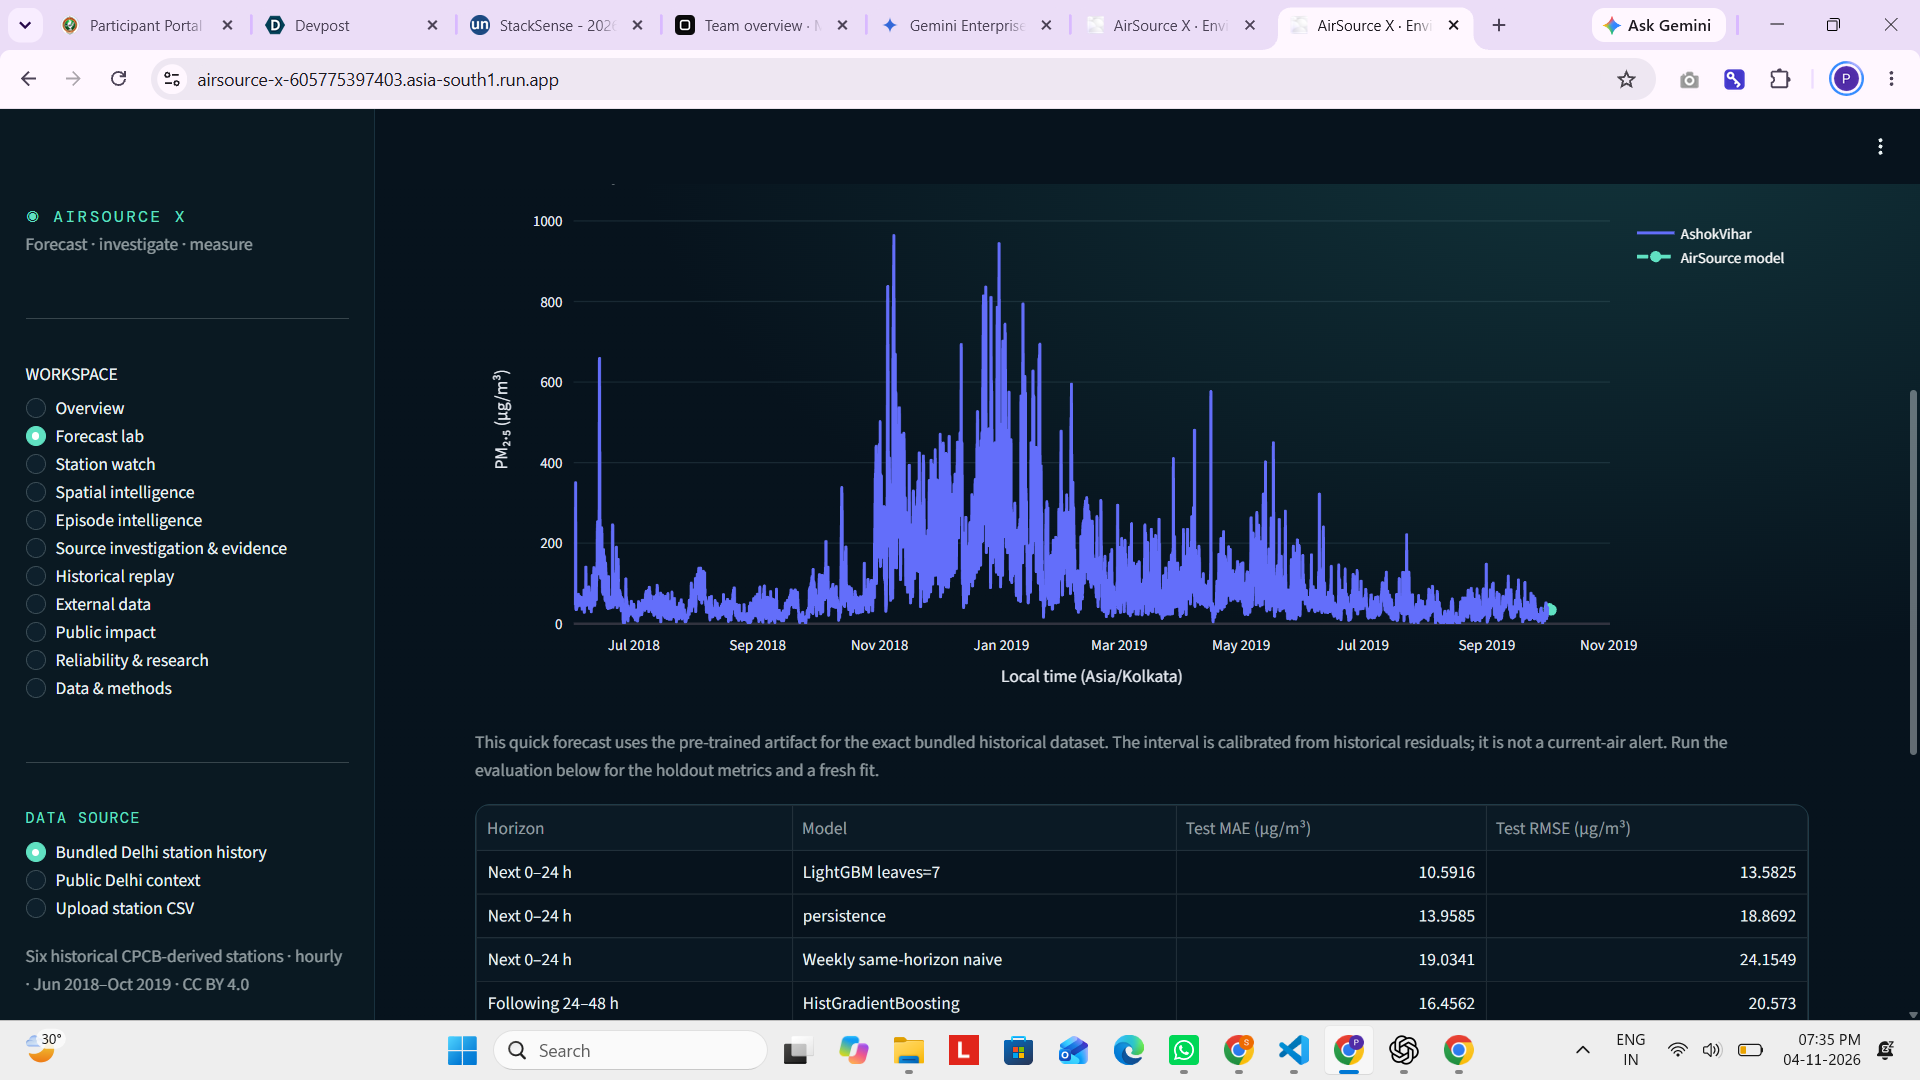
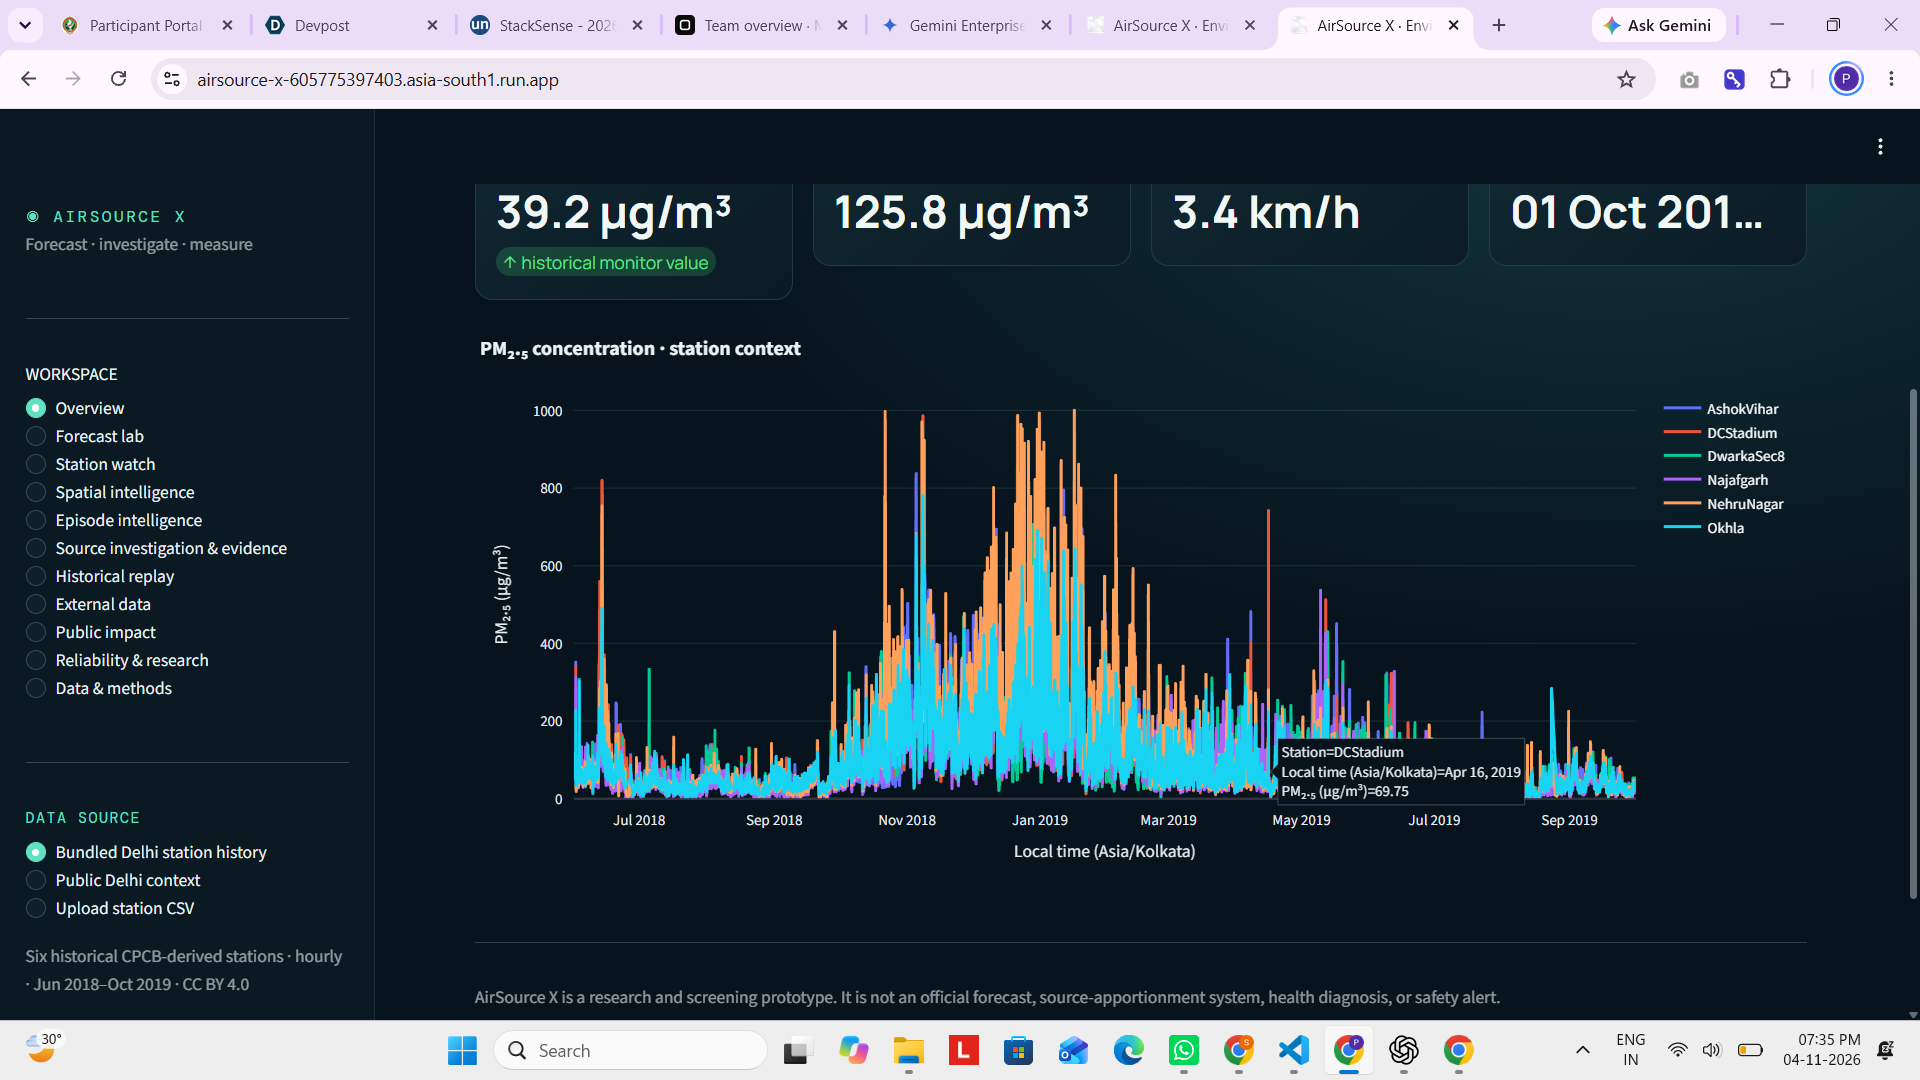
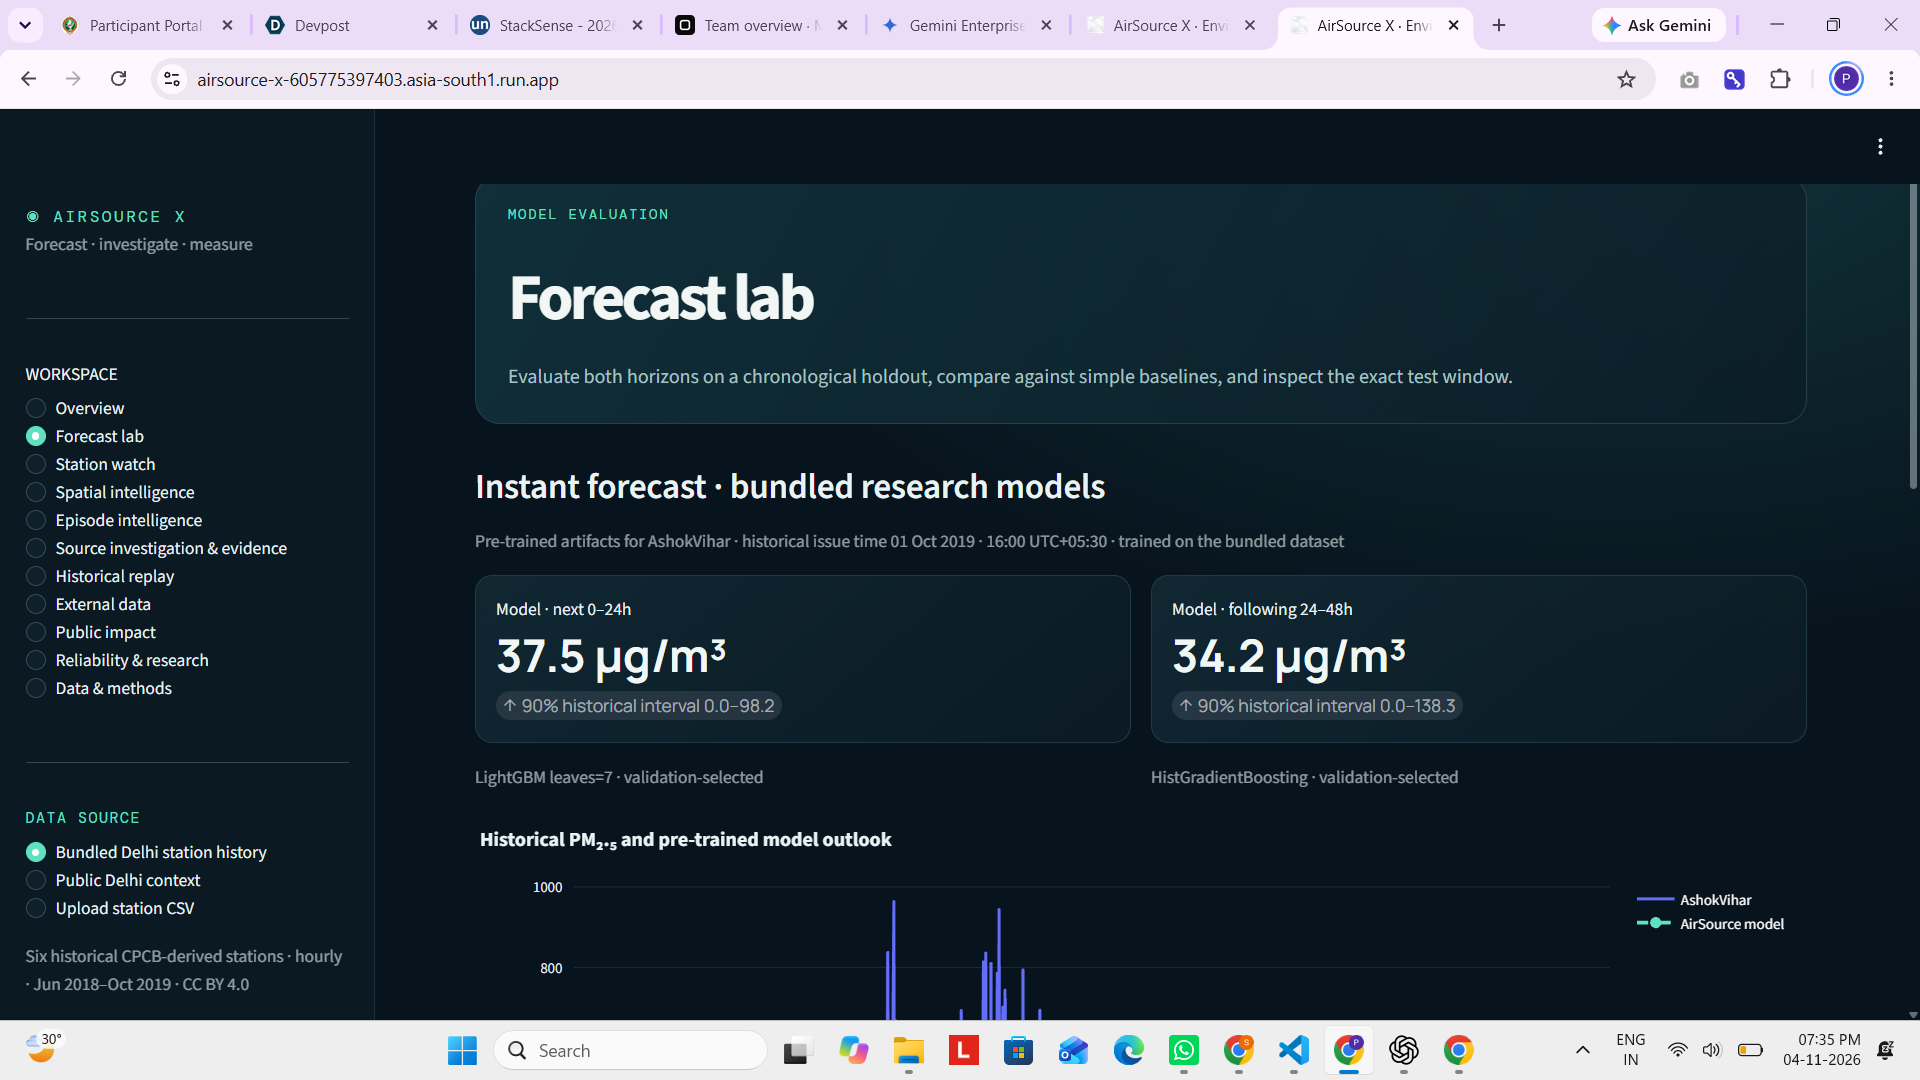
AirSource X is a Delhi-first environmental research prototype. It explores historical station data, compares stations, and displays retrospective PM₂.₅ estimates for two horizons: the next 0–24 hours and 24–48 hours. Its investigation tools surface patterns and evidence gaps; they do not claim to prove a pollution source.
How we built it
The app uses Python, Streamlit, pandas, NumPy, Plotly, LightGBM, and scikit-learn. We trained and evaluated models using chronological data splits and compared them with simple baselines. The public demo runs on Google Cloud Run.
What we learned
Time-aware evaluation matters: randomly mixing timestamps can leak future information into a forecast. Missing data, historical coverage, and uncertainty also affect how results should be interpreted. A nearby road, fire, or monitor reading alone is not proof of a pollution source.
Challenges and limitations
Our bundled dataset covers six Delhi stations from June 2018 to October 2019. The demo is therefore a retrospective research prototype, not a current-air forecast, official AQI service, health alert, or validated source-attribution system.
Built With
- air-quality
- datavisualization
- environmental-monitoring
- github-actions
- google-cloud-run
- lightgbm
- machine-learning
- nasa-firms
- numpy
- open-meteo-api
- openaq
- pandas
- plotly
- python
- scikit-learn
- shap
- streamlit
- time-series-forecasting
