-
-
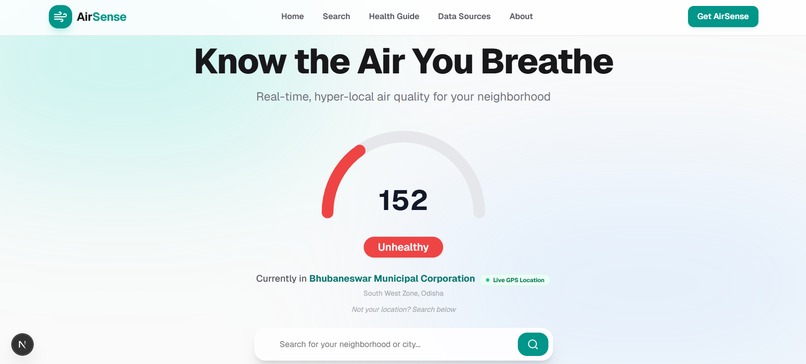
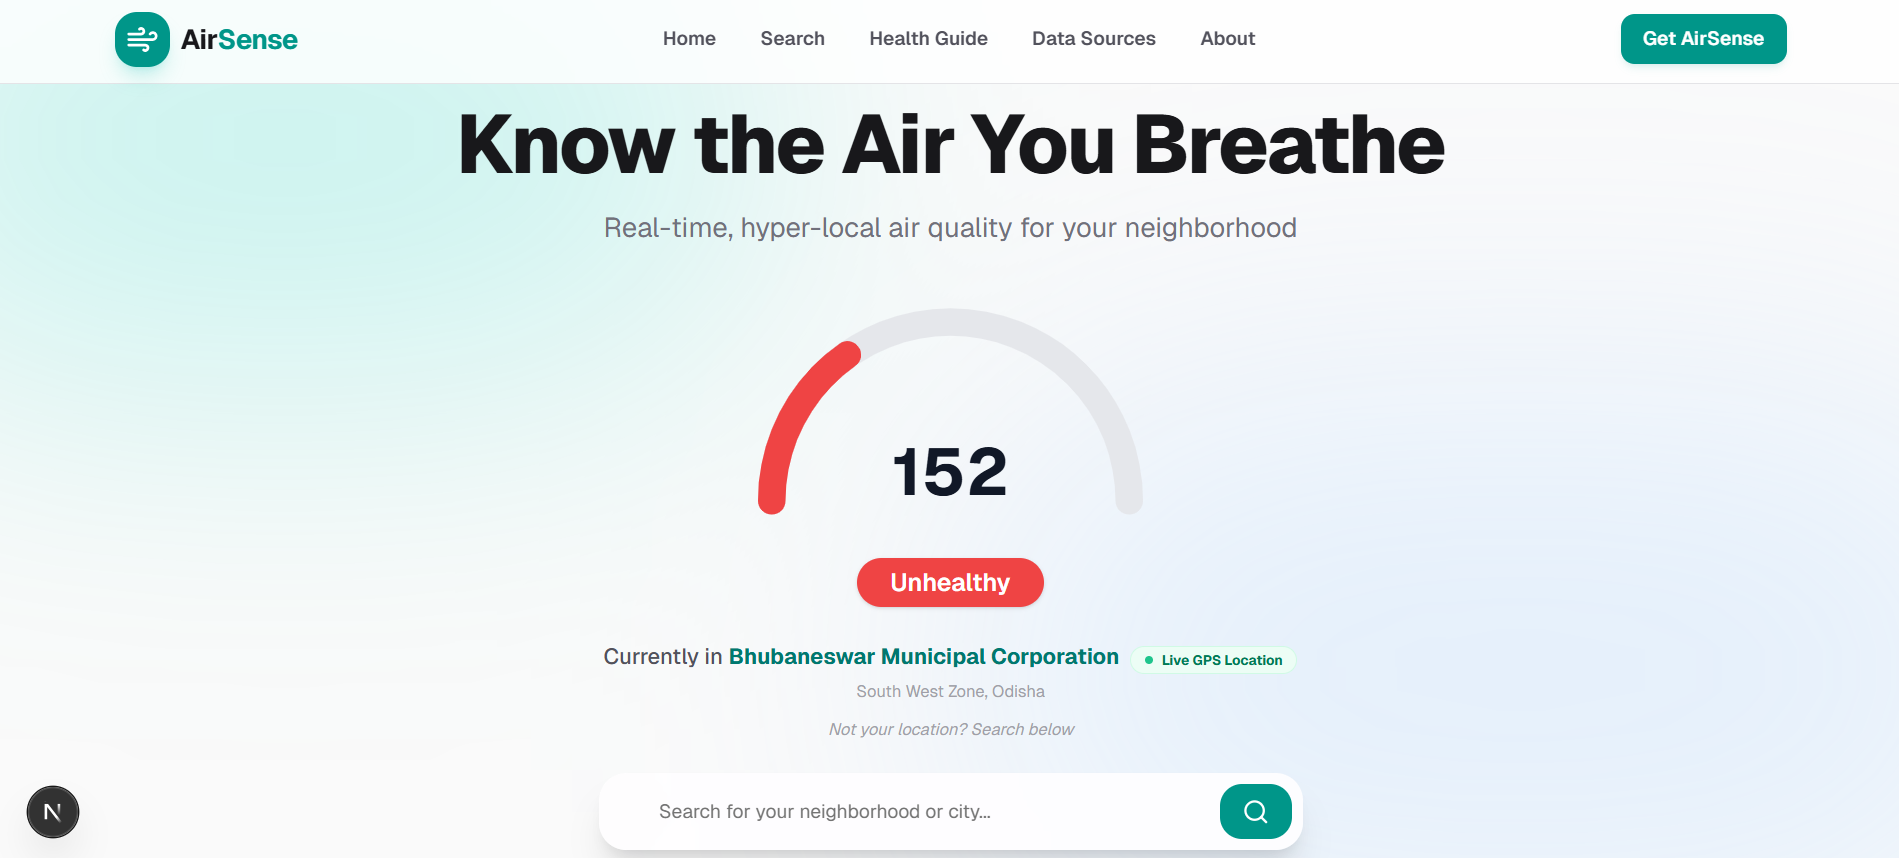
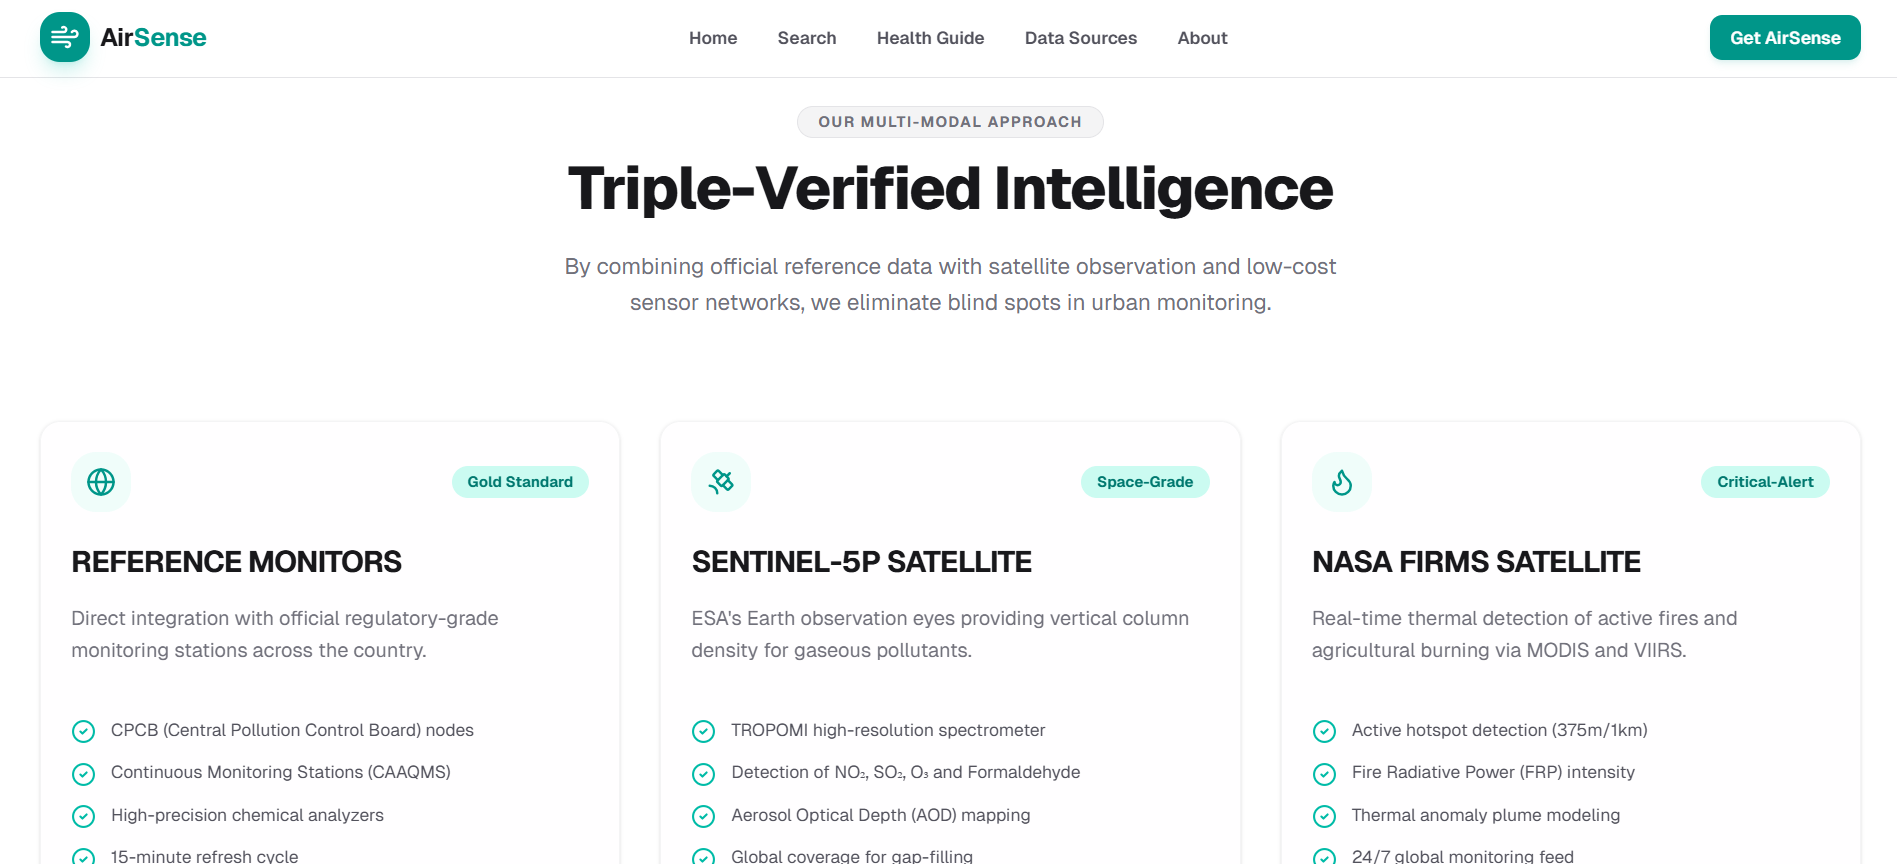
Home Page
-
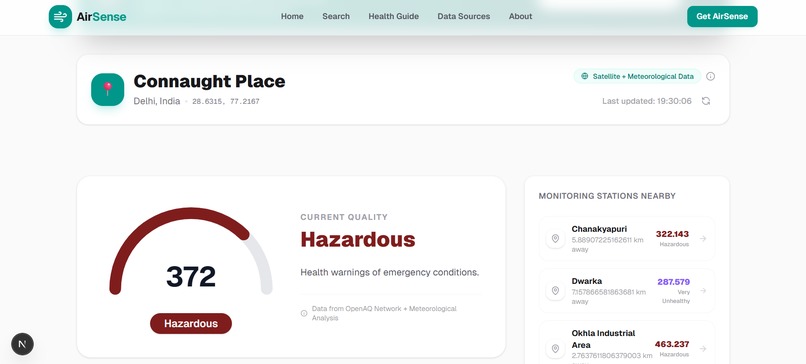
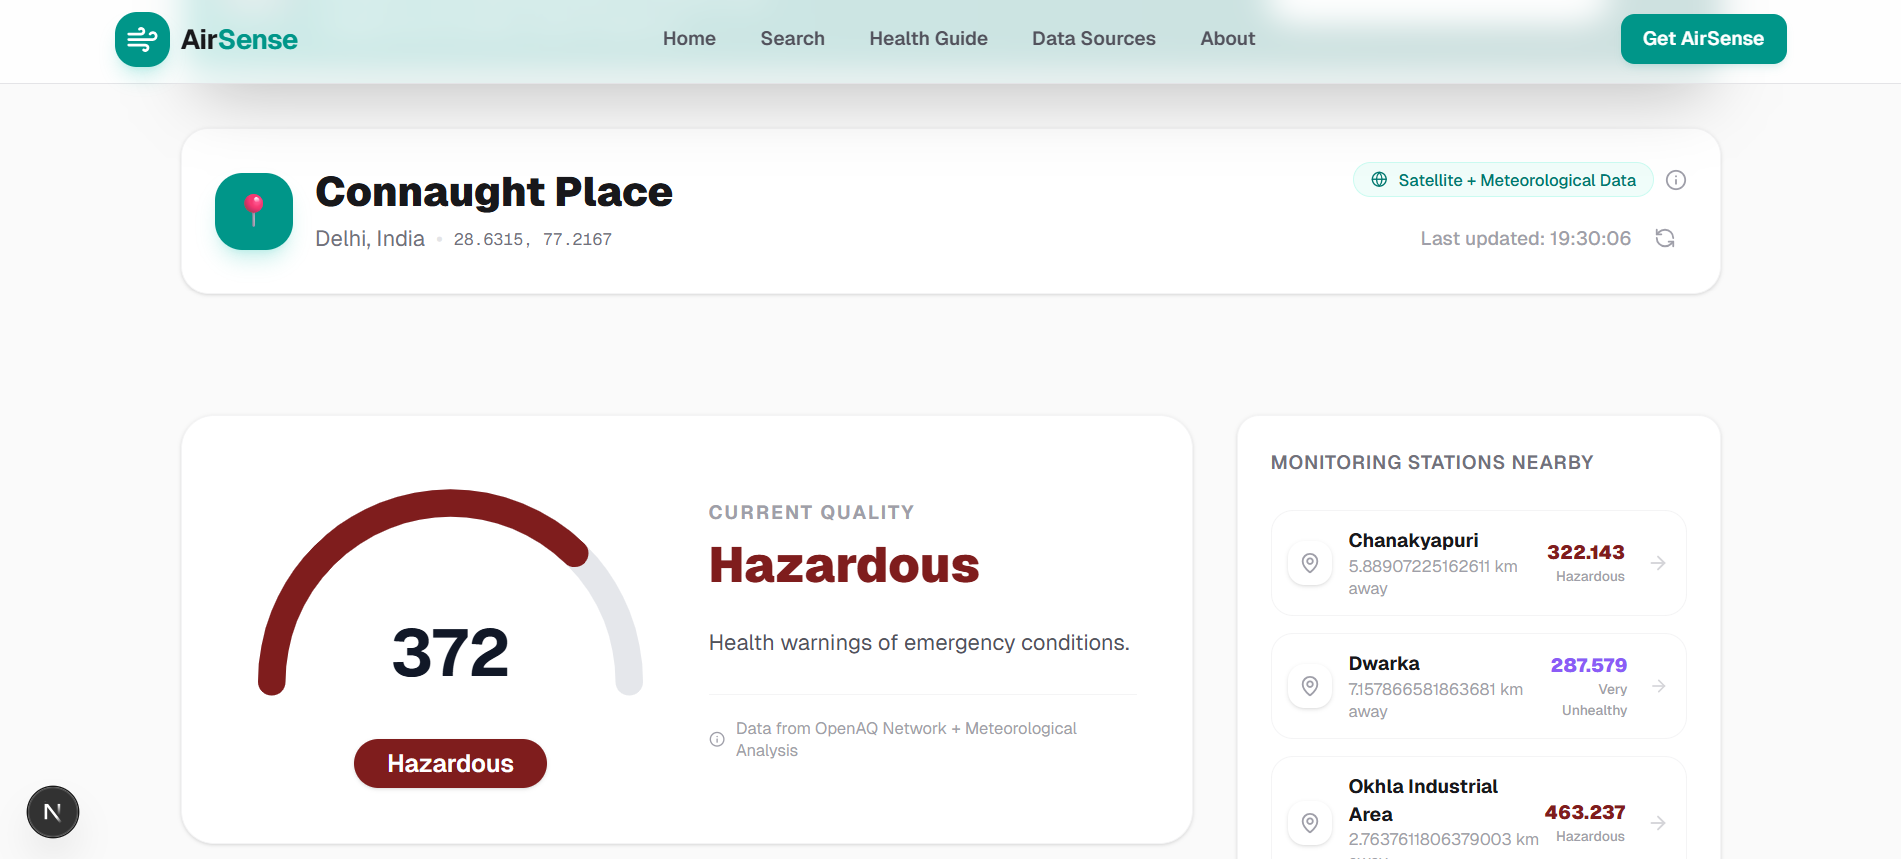
Other City AQI Search Page
-
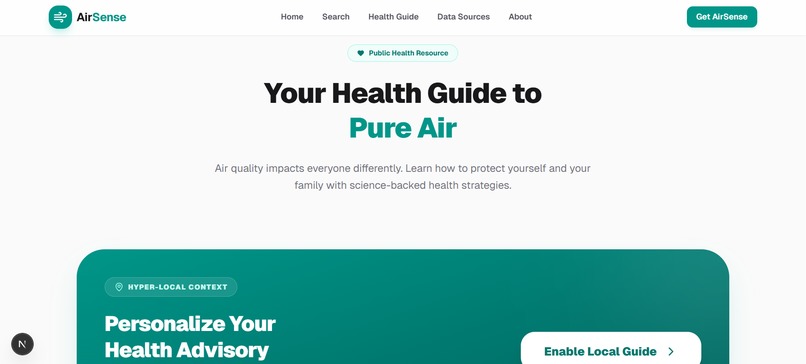
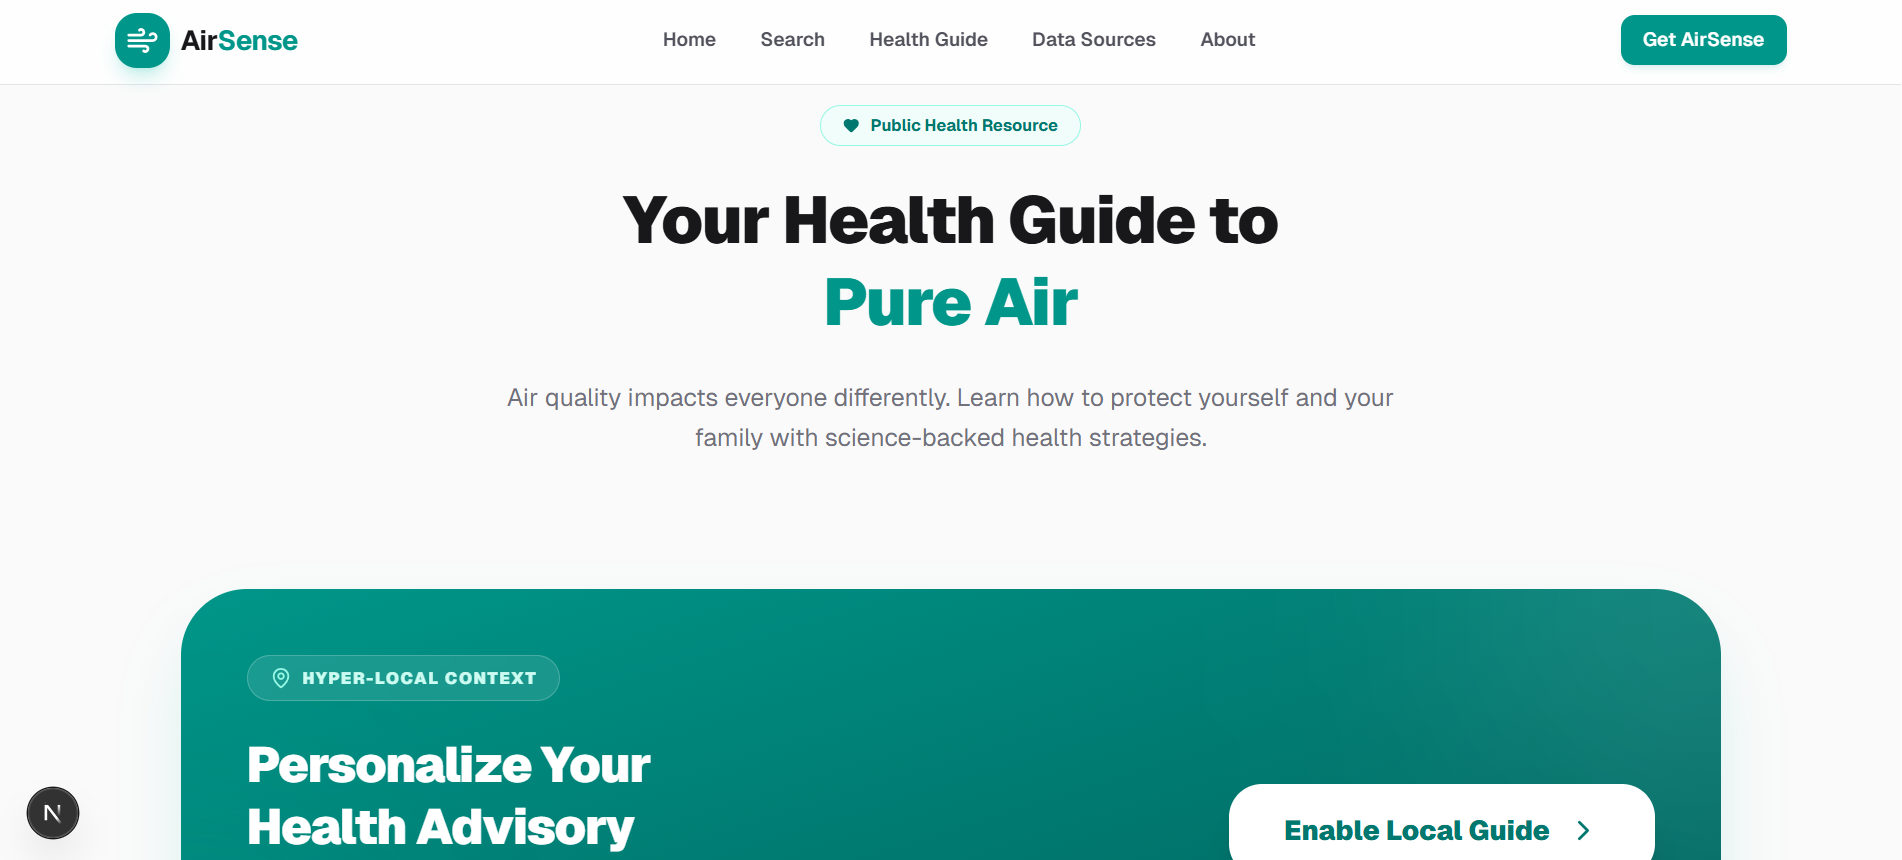
Personalized Health Guide Page
-
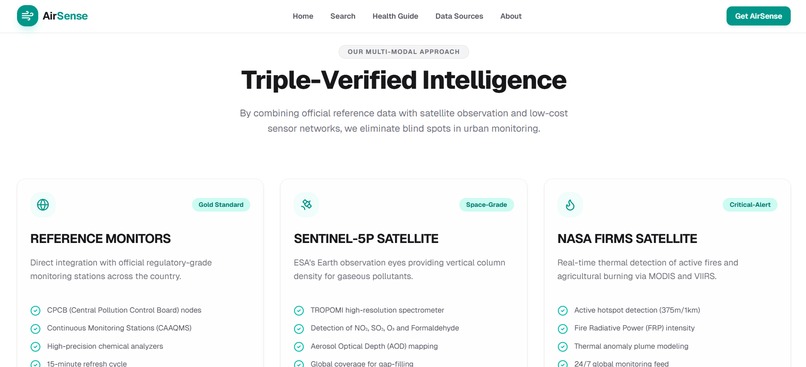
Data Sources Page
-
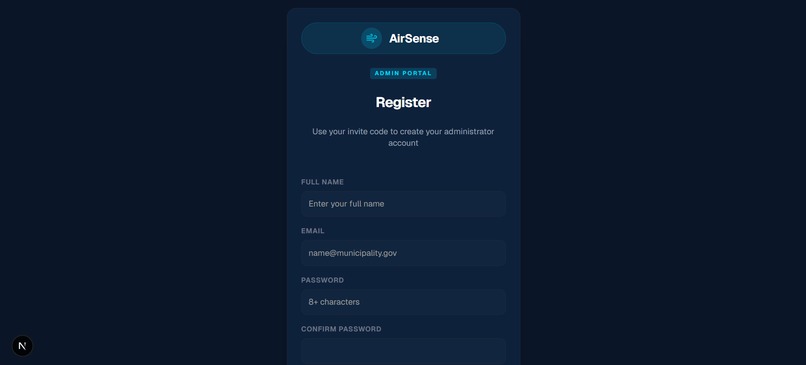
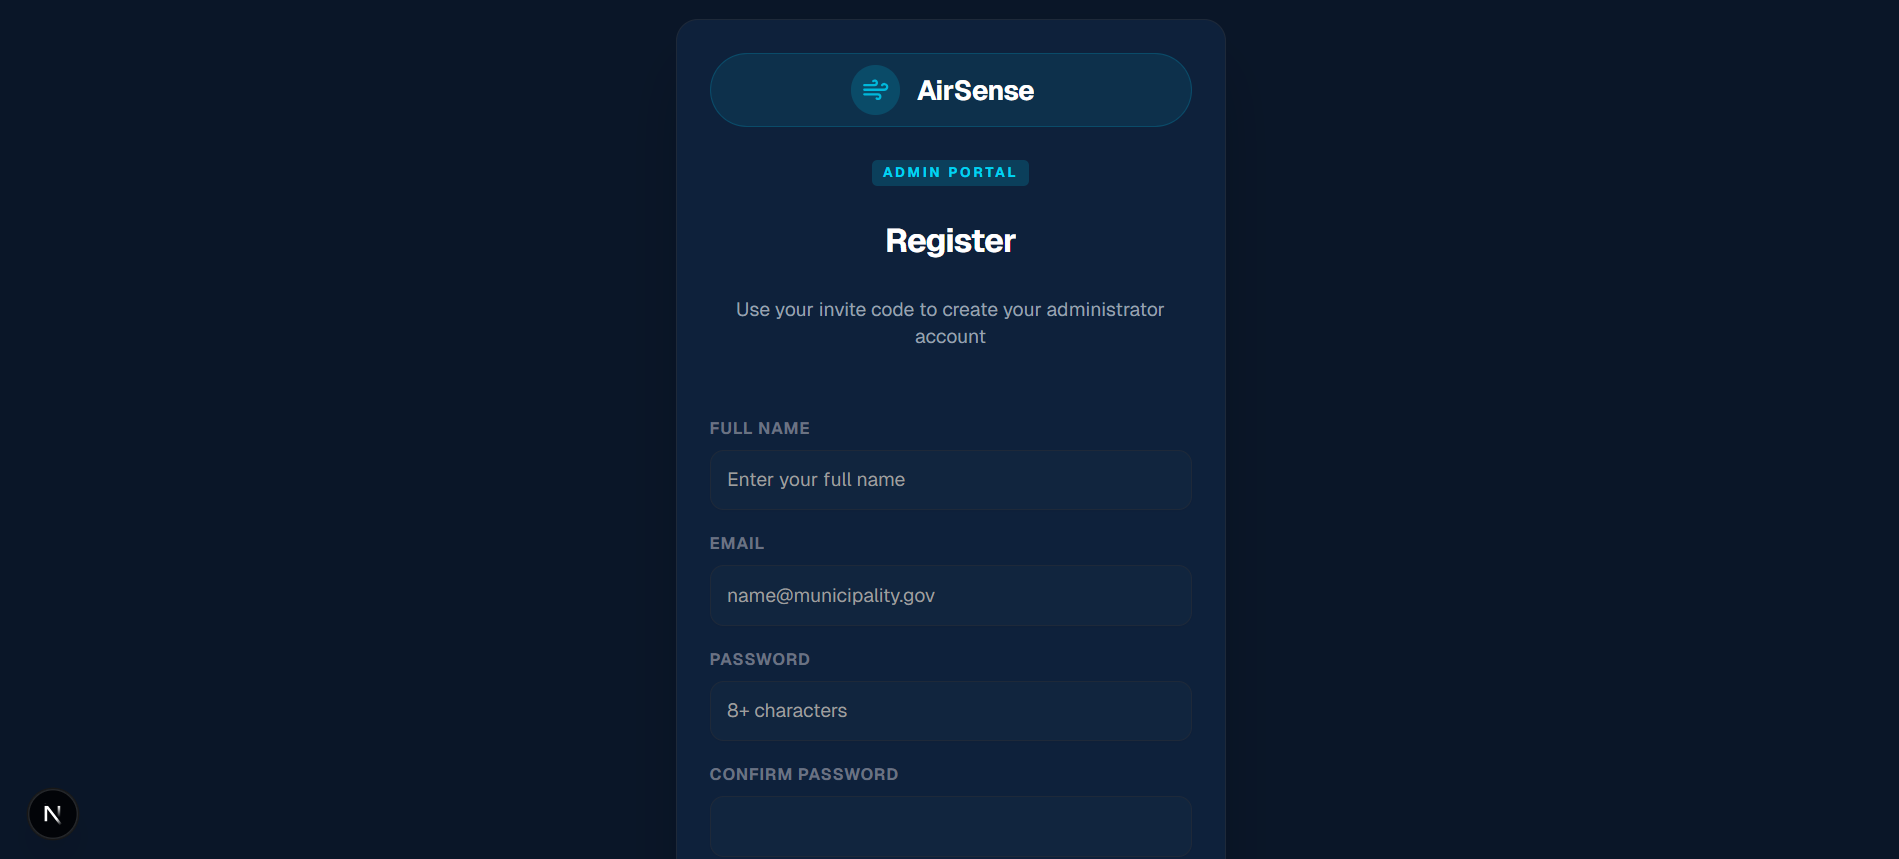
Admin Register Page
-
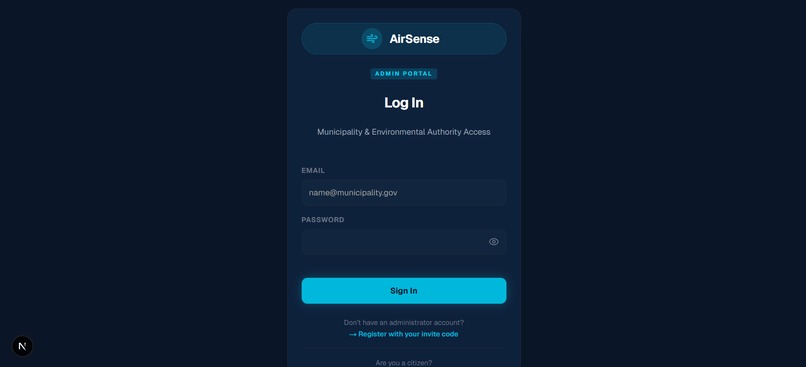
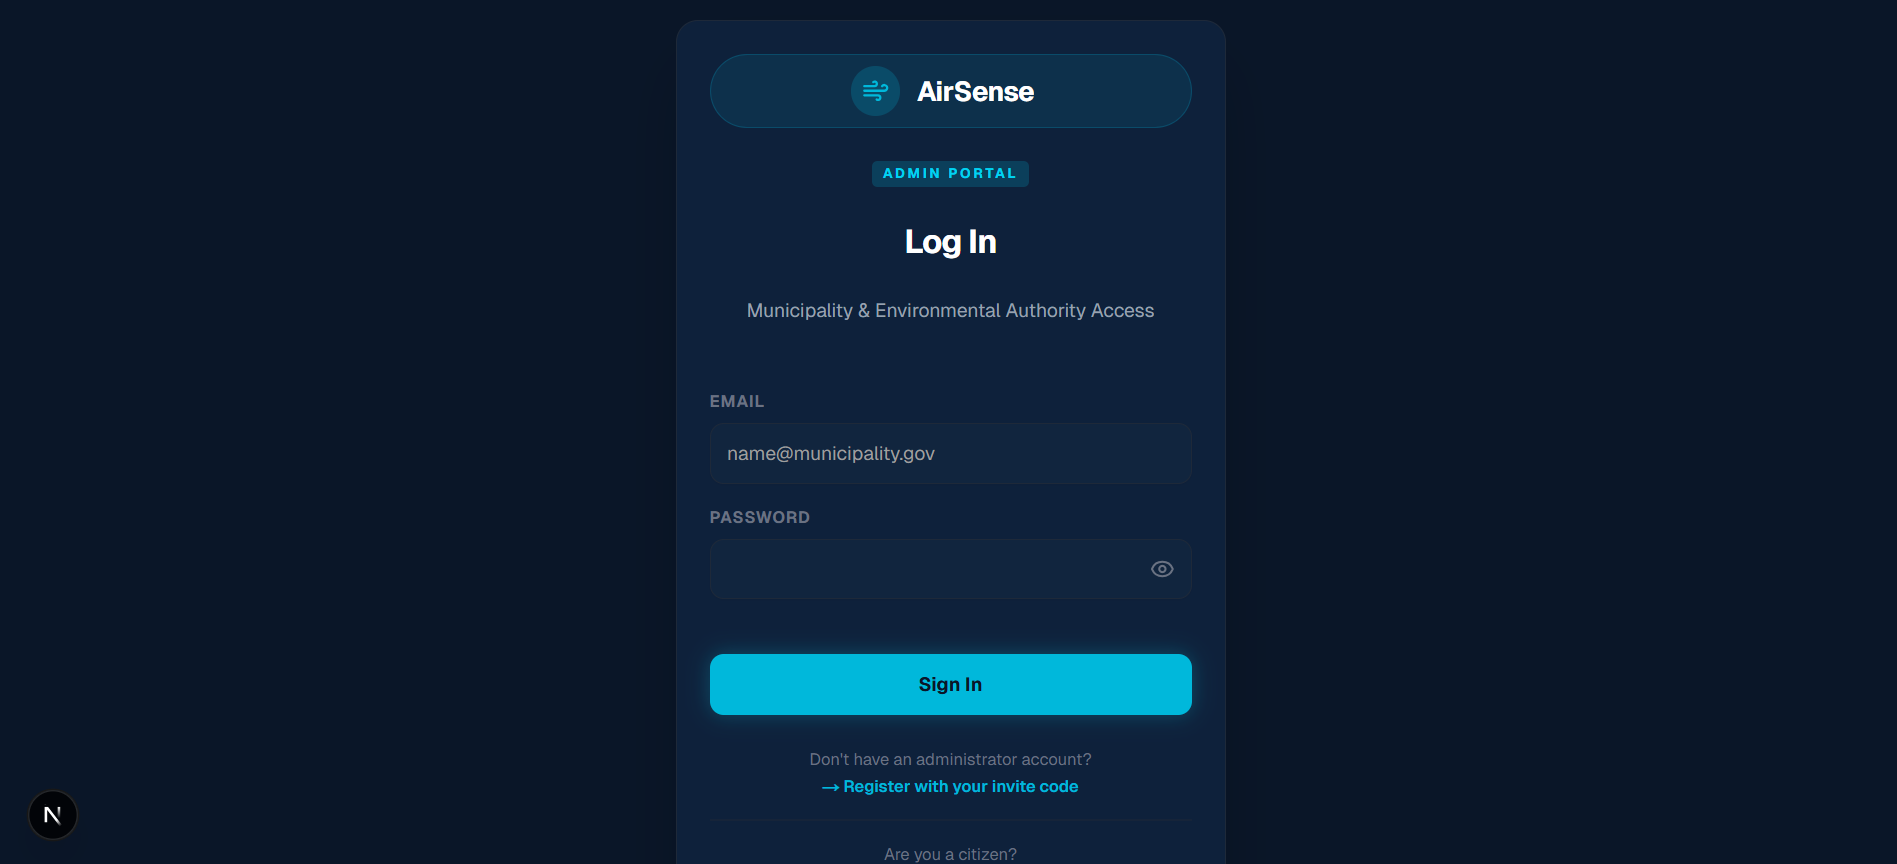
Admin Login Page
-
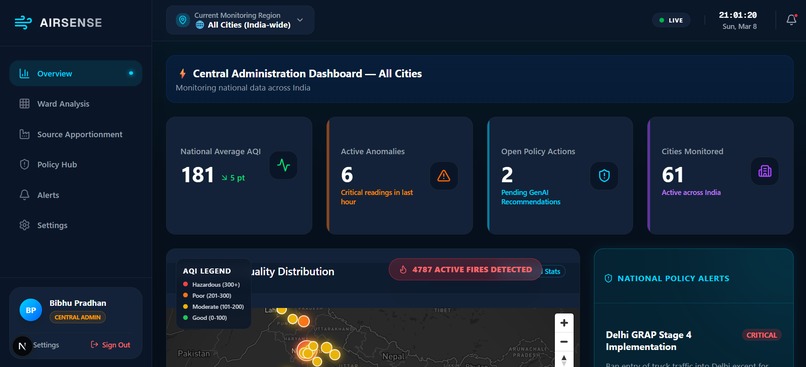
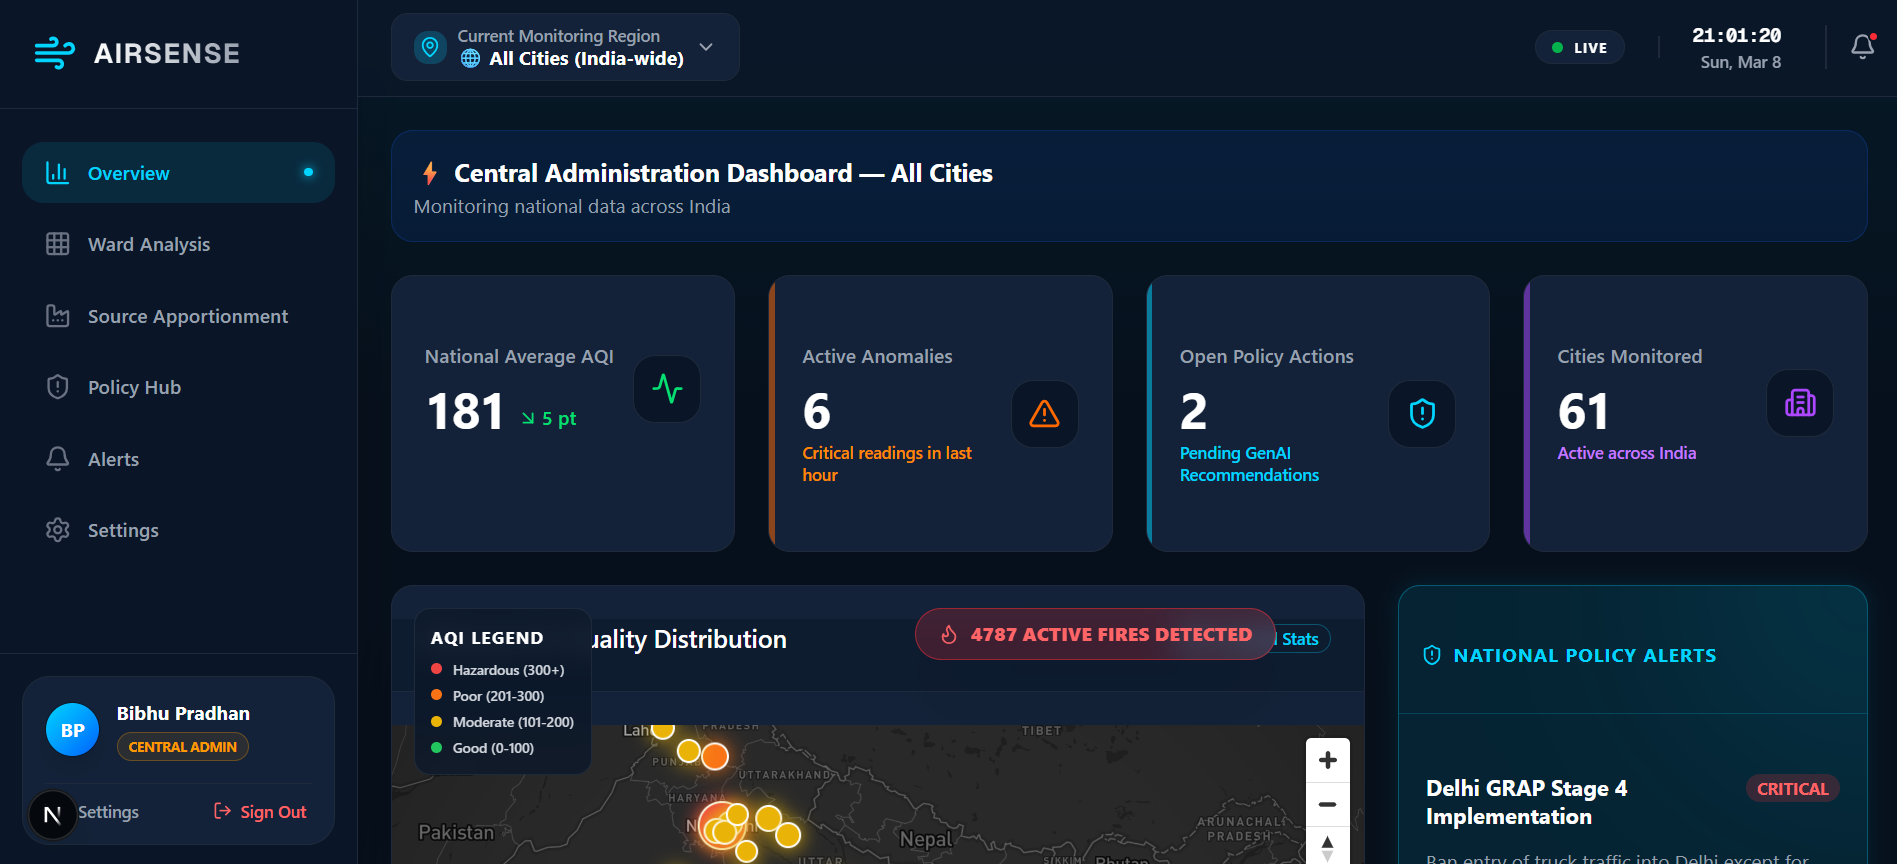
Central Admin Dashboard
-
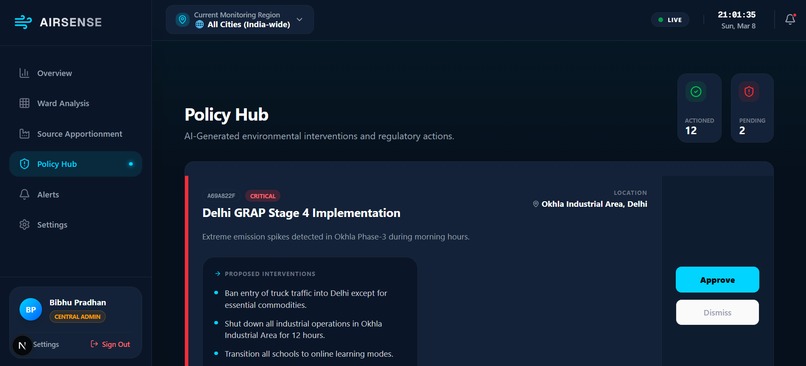
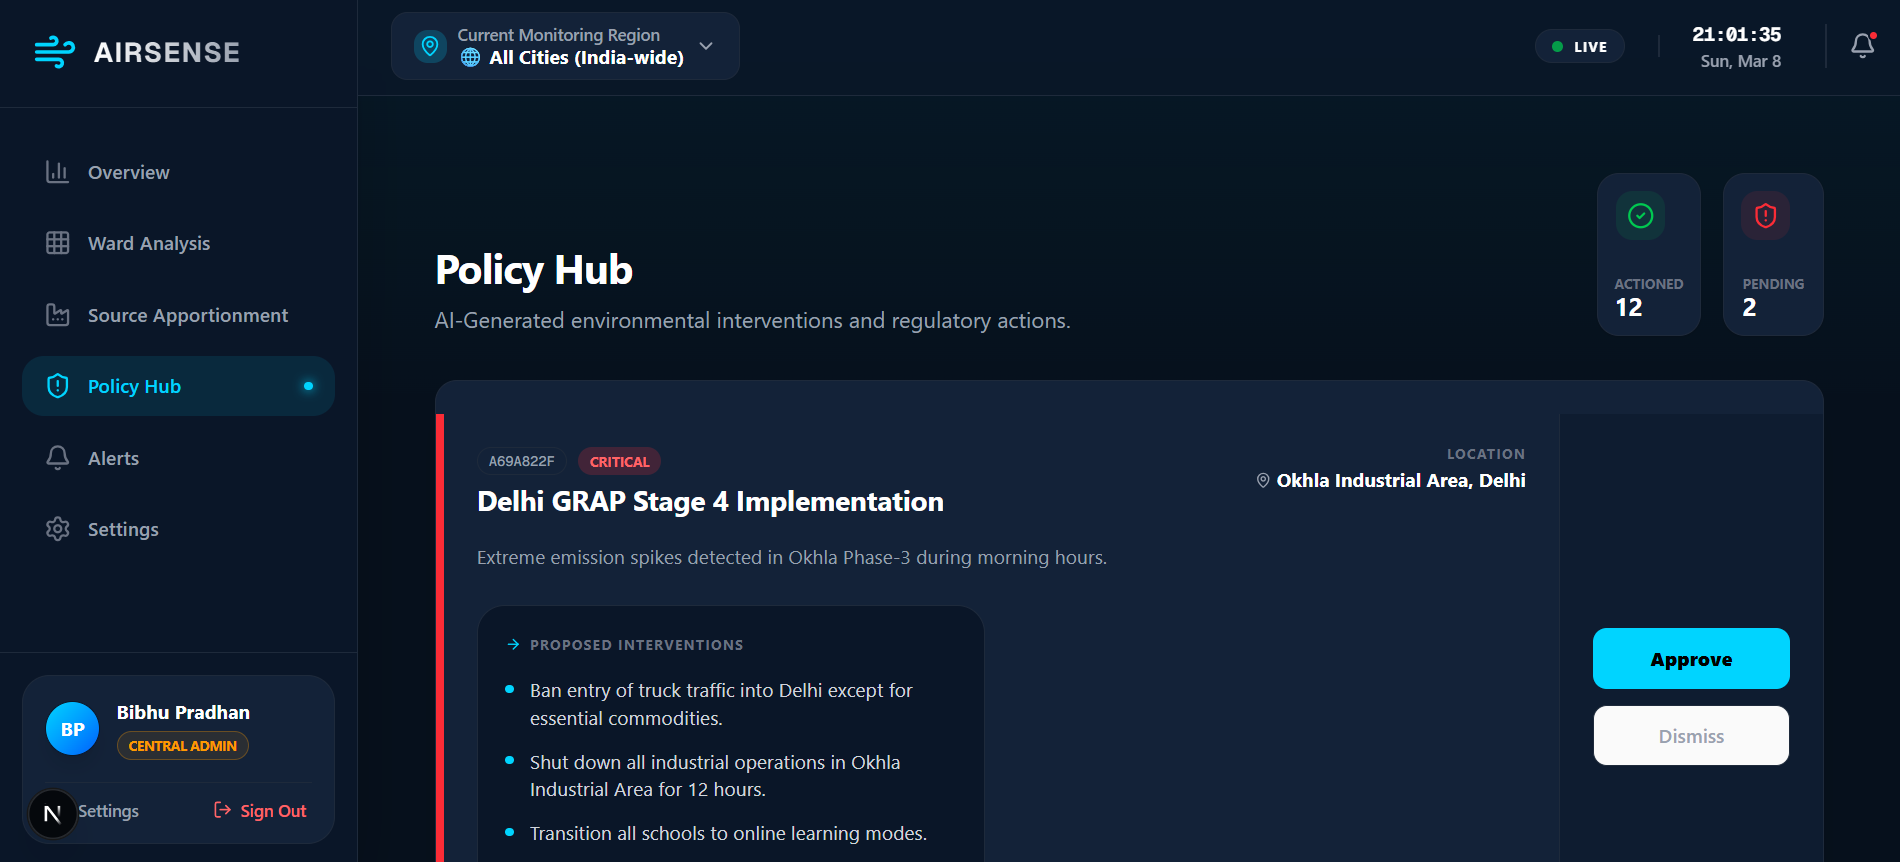
Policy Hub
-
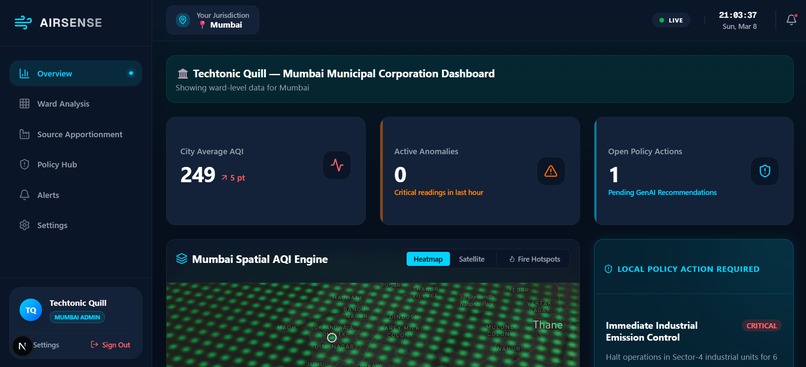
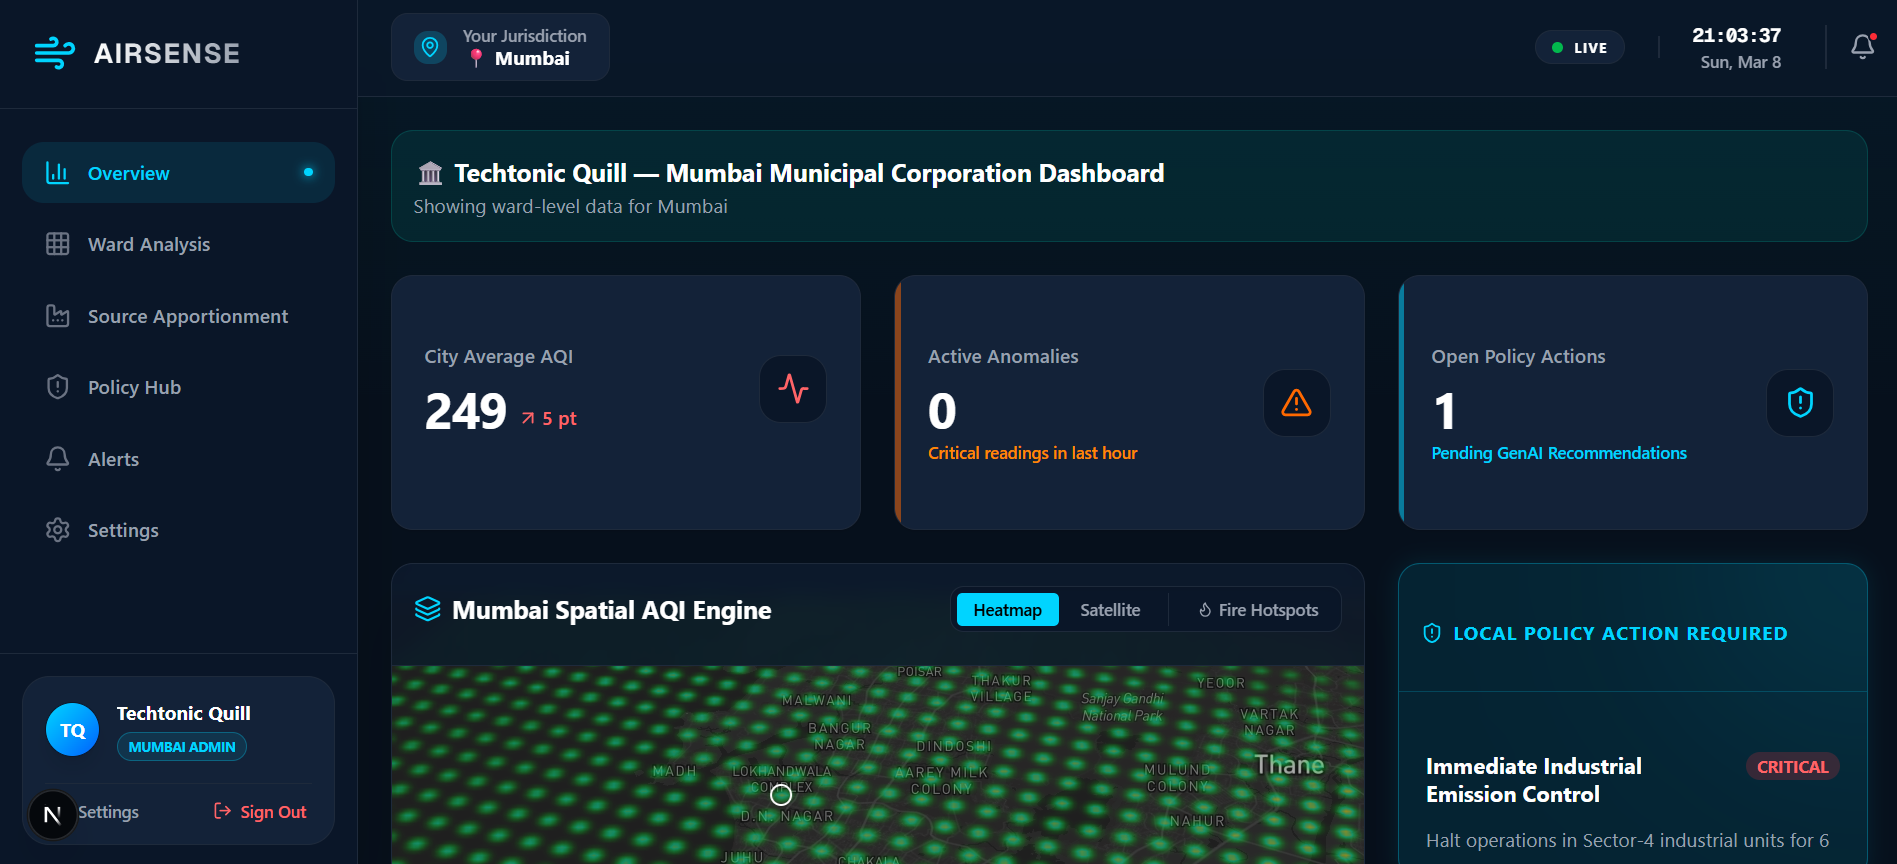
Cityl Admin Dashboard
-

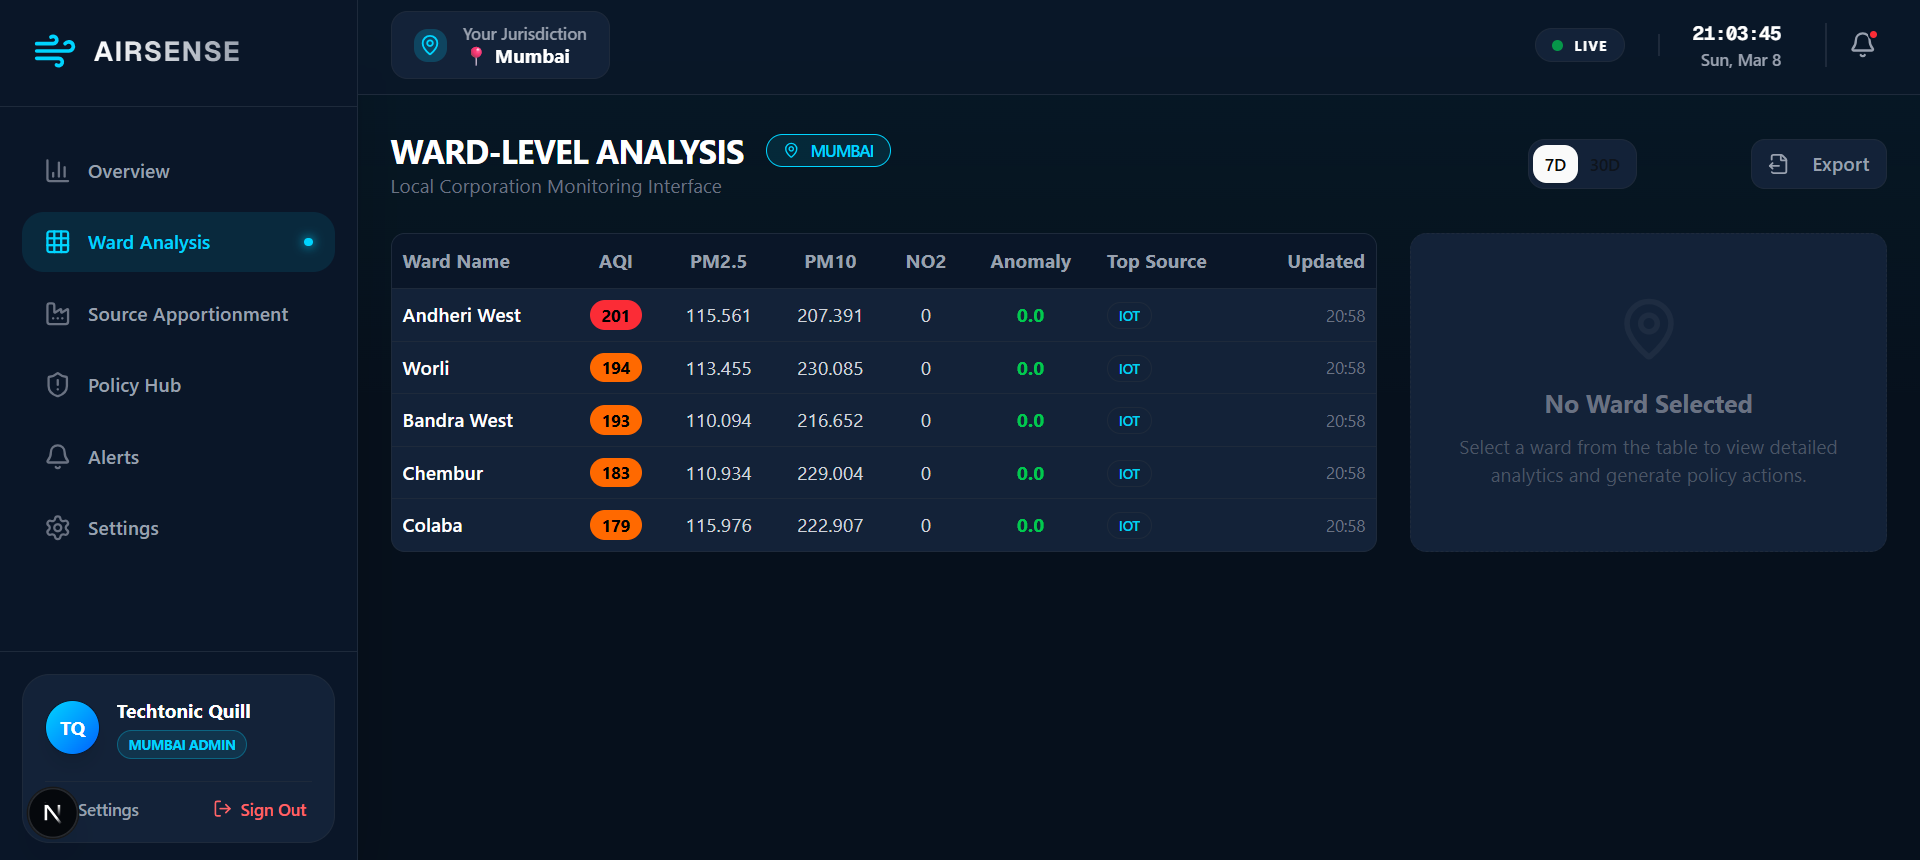
Ward Analysis
Inspiration
Air pollution is a critical, complex issue, particularly in regions that experience dense seasonal smog and varied pollution sources like North India's active crop burning season. Raw Air Quality Index (AQI) numbers often fail to tell the whole story. The inspiration behind AirSense is to go beyond merely displaying data by creating a platform that actually understands the source of the pollution—whether it's morning rush hour traffic, daytime construction dust, or upwind biomass burning. By translating raw meteorological and satellite data into actionable insights, the goal is to empower citizens to protect their health while equipping city administrators with the precise data needed to enact effective mitigation policies.
What it does
AirSense is a high-performance, dual-portal AQI monitoring platform.
- For Citizens: It provides a GPS-first experience with real-time AQI tracking on interactive maps, smart search capabilities, and hyper-local, personalized health advisories based on current conditions.
- For Administrators: It offers secure, role-based dashboards that integrate real-time fire and biomass burning detection using NASA FIRMS and Sentinel Hub satellite imagery.
- Intelligent Source Detection: Using heuristic models, it analyzes PM2.5/PM10 ratios, NO2/SO2 levels, weather context, and satellite fire data to confidently classify pollution sources into categories like traffic, construction, industrial, or biomass burning.
- Smart Policy Retrieval: The platform includes a Retrieval-Augmented Generation (RAG) system that automatically surfaces relevant mitigation policies and emergency protocols based on the detected pollution signatures.
How we built it
- Frontend: The user interface is built with Next.js 15 using the App Router, styled with Tailwind CSS, and enhanced with Framer Motion animations.
- Mapping & Visuals: We implemented Mapbox GL JS for interactive mapping and Recharts for historical trend analysis.
- Backend & Auth: Supabase powers the database, role-based access control, and authentication.
- External APIs: We integrated Sentinel Hub for satellite imagery and NASA FIRMS for real-time active fire tracking.
- AI & Machine Learning: We built custom heuristic algorithms to compute anomaly scores and detect pollution signatures. Additionally, we integrated the @google/generative-ai SDK to power intelligent insights and built a lightweight TF-IDF-inspired RAG system to dynamically retrieve contextual knowledge documents. State management is handled smoothly via Zustand.
Challenges we ran into
- Data Synthesis: Normalizing and correlating highly diverse datasets in real-time, such as combining local chemical sensor readings (PM2.5, NO2) with broad meteorological data (wind speed) and distant satellite telemetry (NASA FIRMS upwind fire counts).
- Algorithmic Accuracy: Designing heuristic ML rules to accurately separate overlapping pollution signatures. For instance, distinguishing construction dust from general pollution required calculating specific fine-to-coarse particle ratios (PM2.5/PM10 < 0.3) mapped against daytime operations and low wind speeds.
- Contextual Search: Building a fast, lightweight RAG retrieval mechanism without relying on a heavy vector database required implementing a custom scoring system that intelligently prioritizes exact tag matches and contextual source types.
Accomplishments that we're proud of
- Satellite Correlation: Successfully integrating NASA FIRMS data to dynamically calculate the distance and fire radiative power (FRP) of upwind fires to confirm biomass burning signatures.
- Dual-Target Architecture: Creating a seamless experience that caters to two entirely different user bases—giving citizens easy-to-digest health metrics while providing administrators with complex policy tools and anomaly detection algorithms.
- Actionable RAG Pipeline: Building the retrieveRelevantDocs function that actively maps detected ML pollution signatures directly to mitigation categories (e.g., mapping a "TRAFFIC" signature to "MITIGATION_TRAFFIC" documents) to instantly suggest solutions.
What we learned
- Environmental Data Science: We gained a deep understanding of how specific chemical fingerprints and weather patterns dictate air quality. We learned how high NO2 during rush hours indicates traffic, while high PM10 with a low fine-particle ratio indicates construction dust.
- Web Ecosystems: We mastered the integration of Next.js 15, Supabase, and mapping libraries to handle dense, real-time data streams efficiently.
What's next for AirSense
- Predictive AI Models: Transitioning from heuristic and statistical anomaly detection to trained neural networks for more accurate forecasting and pollution source prediction.
- Hyper-Local IoT Sensor Integration: Expanding our data pipeline to integrate feeds from low-cost, community-hosted IoT air quality sensors. This will provide unprecedented, street-level granularity to our datasets and significantly enhance the accuracy of our spatial interpolation and hyper-local health advisories.
- Push Notifications: Fully implementing the web-push library infrastructure to send real-time, geolocated emergency health alerts directly to citizens' devices during severe AQI spikes.
- Expanded Regional Coverage: Scaling the administrative tools to support more cities and onboarding more officials via the automated invite system.
Built With
- gemini
- genai
- mapbox
- next.js
- openaq
- openweathermap
- rag
- supabase
- tailwindcss
- zustand


Log in or sign up for Devpost to join the conversation.