Inspiration Air pollution is responsible for over 7 million premature deaths annually. Yet most people have no real-time visibility into the air quality of their city. I wanted to build a simple, accessible tool that anyone with a smartphone can use to make informed decisions about outdoor activities.
What I learned This project deepened my understanding of building complete ETL pipelines on the frontend — extracting data from REST APIs, transforming raw JSON into structured format, and loading into localStorage for persistence. I also learned real-time data visualization with Chart.js and efficient geocoding workflows.
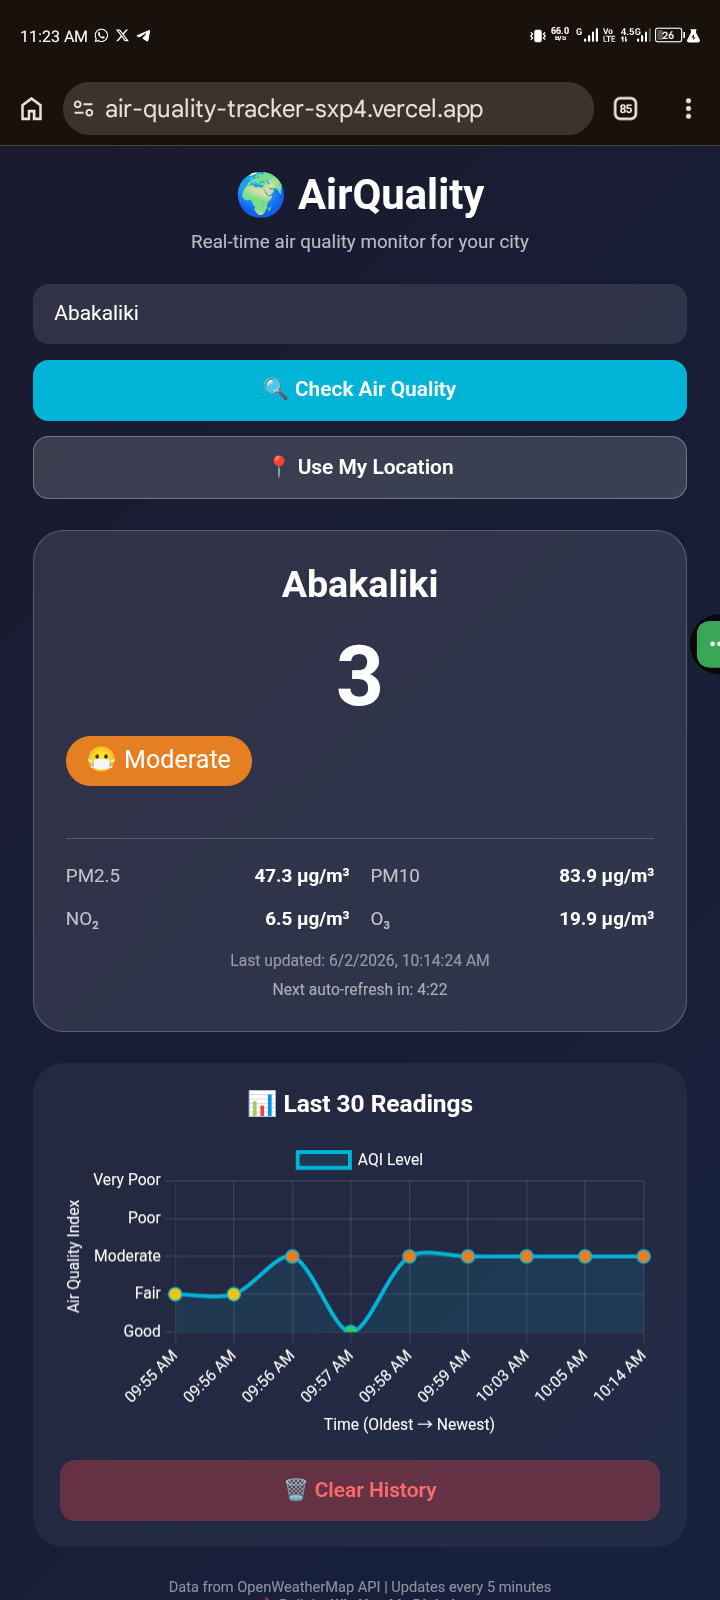
How I built it The app fetches live air quality data from OpenWeatherMap API, geocodes city names to coordinates, processes pollutant levels (PM2.5, PM10, NO₂, O₃), and displays a color-coded AQI from 1 (Good) to 5 (Very Poor). All historical data is stored locally with automatic deduplication. The app auto-refreshes every 5 minutes with a countdown timer, and Chart.js renders trend lines of the last 30 readings.
Challenges faced Rate limiting required smart caching strategies. Duplicate entries during refreshes were solved by timestamp-based deduplication. Reverse geocoding for the "Use My Location" feature needed careful error handling for permission denials and API fallbacks.

Log in or sign up for Devpost to join the conversation.