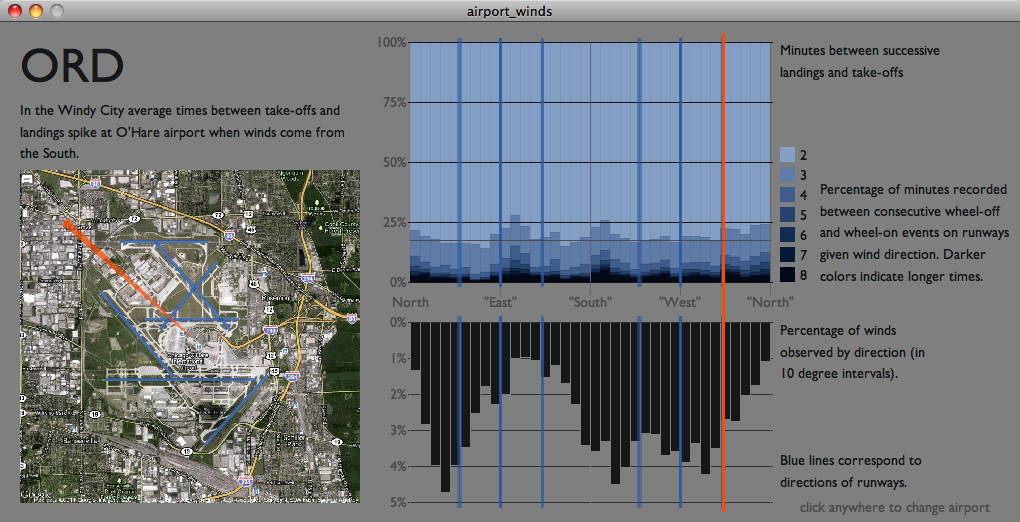
Motivation Airplanes are affected by wind direction and runway orientation during take-off and landing. Landing and departure delays caused by wind can cost a great deal of time and money. Compensating for these troublesome wind directions by reconsidering flight traffic or even adding a runway could benefit an airport immensely. The focus of this analysis is to relate efficiency, measured as the time between consecutive departing and arriving flights, to corresponding wind direction. Data Processing Flight details for airports were aligned with corresponding weather conditions for wheels-on and off times for each flight between January 2009 and July 2011. Wheels-on and wheels-off times were merged into an wheels-event time. We sorted flights according to wheels-event time, and calculated times between events (in minutes). To wnsure that we only analyzed 'regular working hours' at the airport, we only regarded times when airports are consistently busy: 7:00 A.M. -- 12:00 midnight. We also removed times with unusually high wind speeds (above .95 quantile). Wind Efficiency Charts: For each airport there are three plots. The satellite map is overlaid by blue lines highlighting its runways. These runways show up again as vertical blue lines in the other two plots - at the position corresponding to their angle (measured as clockwise degrees from North).The plot on the bottom right shows relative frequencies of observed wind direction (measured in 10 degree differences).The plot on the top gives efficiency at which airport operates (in minutes between wheels-on/off events). Light colors indicate high efficiency (low times between wheel-events), darker colors indicate lower efficiency.Interactions with the chart: mouse movements on the right charts trigger a vertical orange line and an orange circle segment highlights the corresponding wind direction in the satellite image.A faint grey line shows up in the upper right plot to make efficiency comparisons across wind directions easier.Clicking anywhere on the charts displays a popup-menu with choices for other airports. At the moment, charts for Seattle (SEA), O'Hare (ORD), Phoenix (PHX), and Los Angeles (LAX) are available.
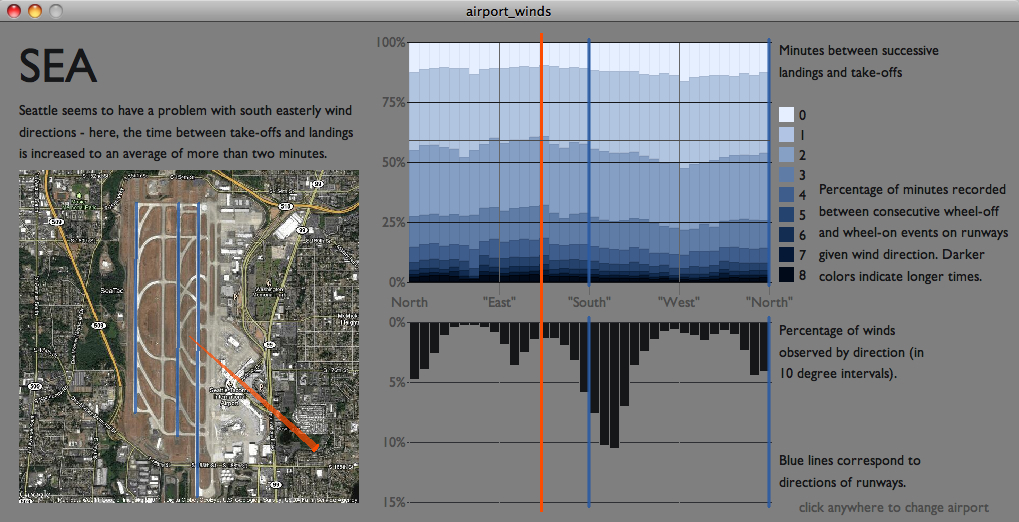
Results SEA - the most prevalent wind directions at SEA are Southerly (SSW) and North. Combined with North-South oriented runways, this reduces the occurrence of unfavorable side winds. However, there are still many times in which winds come from a different direction.From the plot on the upper right, we see that the airport operates the most efficiently under westerly winds, while winds from the East give the most trouble. On average, there are 28 more seconds between flights with easterly than westerly winds. With an average of 114 flights per day with easterly winds, this yields approximately 7,166 extra minutes (≈ 7 work days) between flights per year as a result of easterly winds. Switching runway use to the opposite direction might be benefitting efficiency in this situation.ORD - Chicago O'Hare has 7 runways (but none oriented North-South). With an average of about 770 daily flights (during the time period considered), efficiency is extremely important. The efficiency plot on the upper right shows an interesting pattern: there are several dark spikes, indicating reduced efficiency for these wind directions. These spikes occur between runway directions, while wind directions with a runway oriented in that same direction yield high efficiency. Some of the largest spikes occur for Southerly and Northerly winds. South and North are fairly common wind directions for O'Hare (21% of flights depart or land every day during these wind directions) and it may be beneficial to compensate for this by adding a North-South runway. (Note: for O'Hare's efficiency plot we have removed occurrences of between-wheels-events of 1 minute or less, to zoom in on more problematic areas).

Log in or sign up for Devpost to join the conversation.