-
-
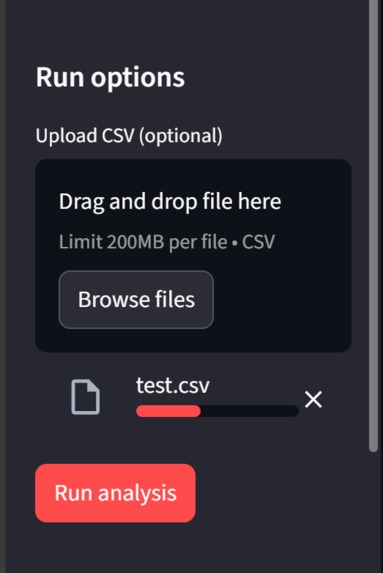
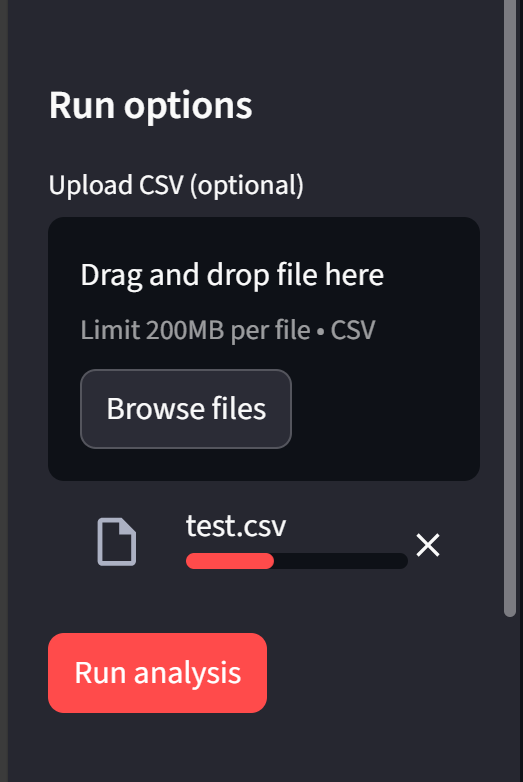
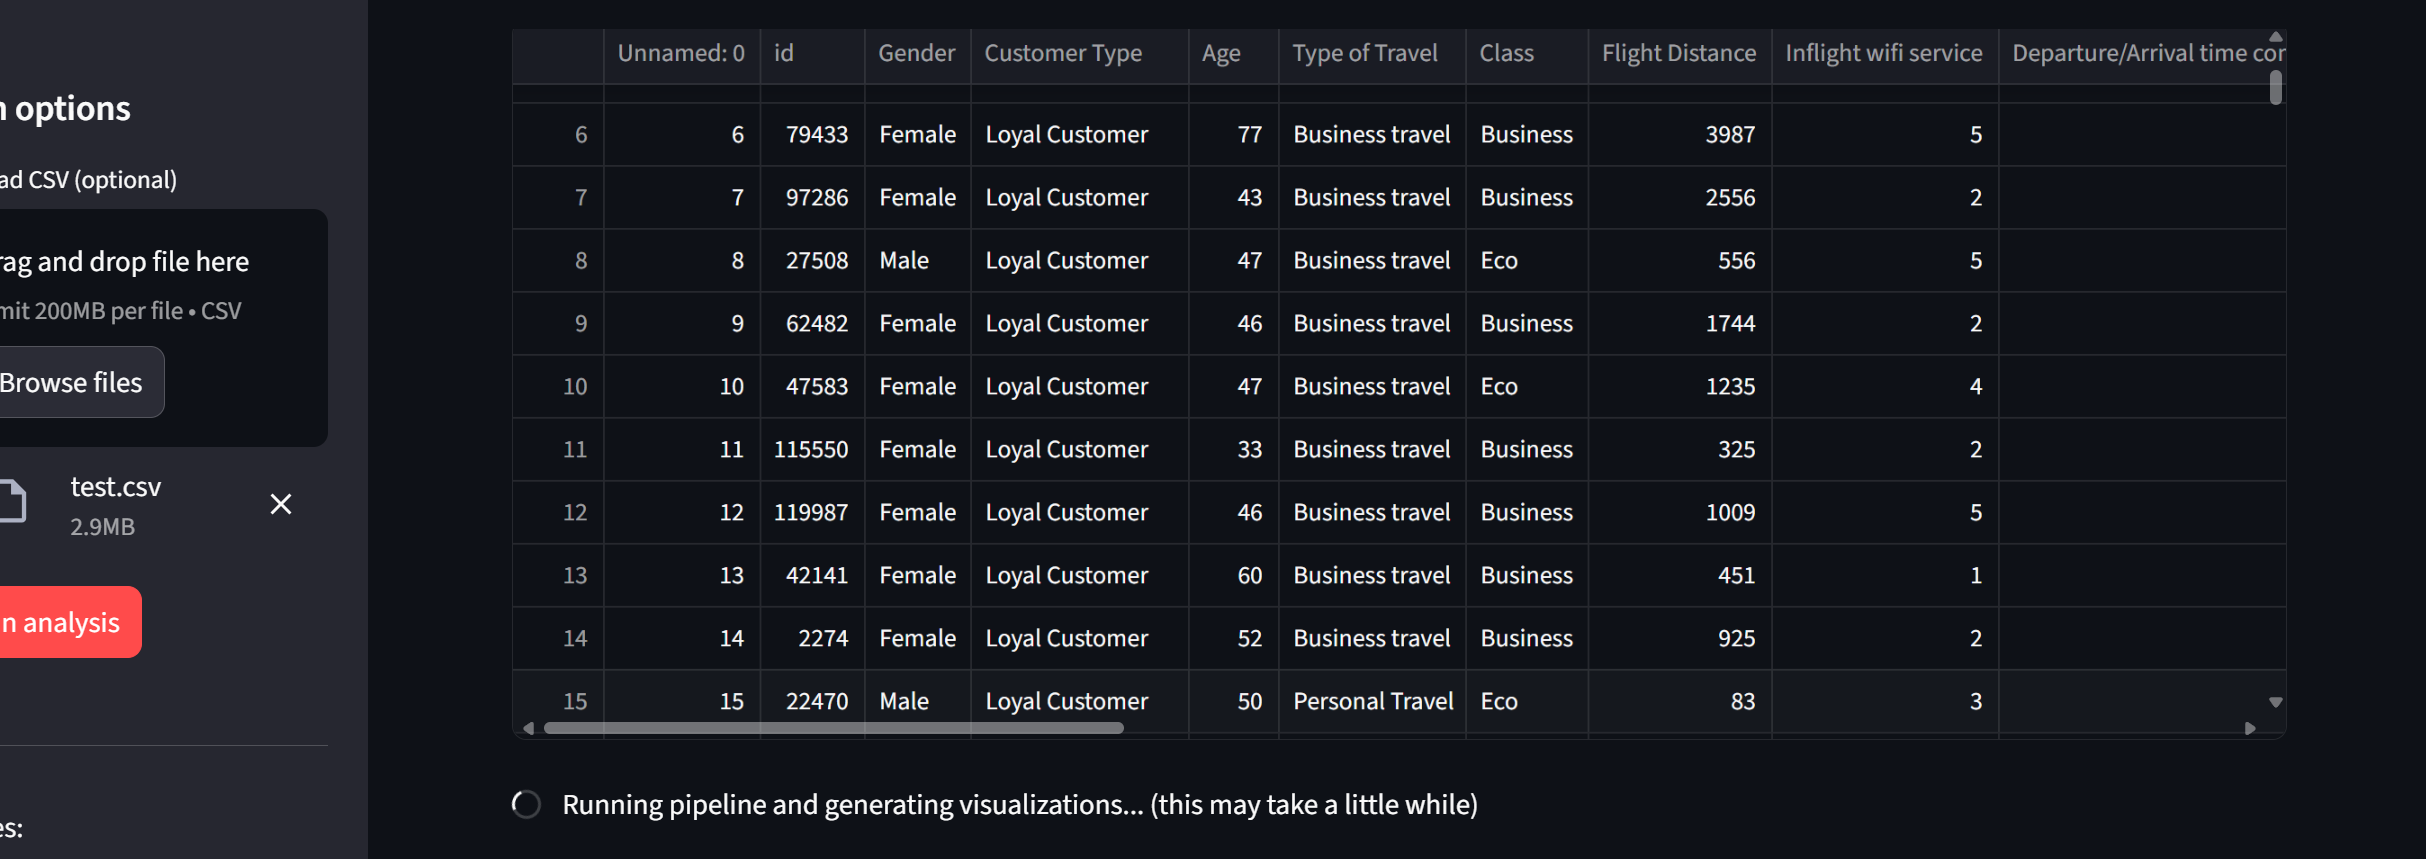
Uploading Csv
-
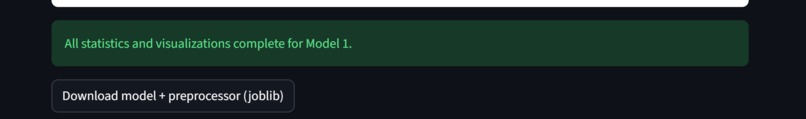
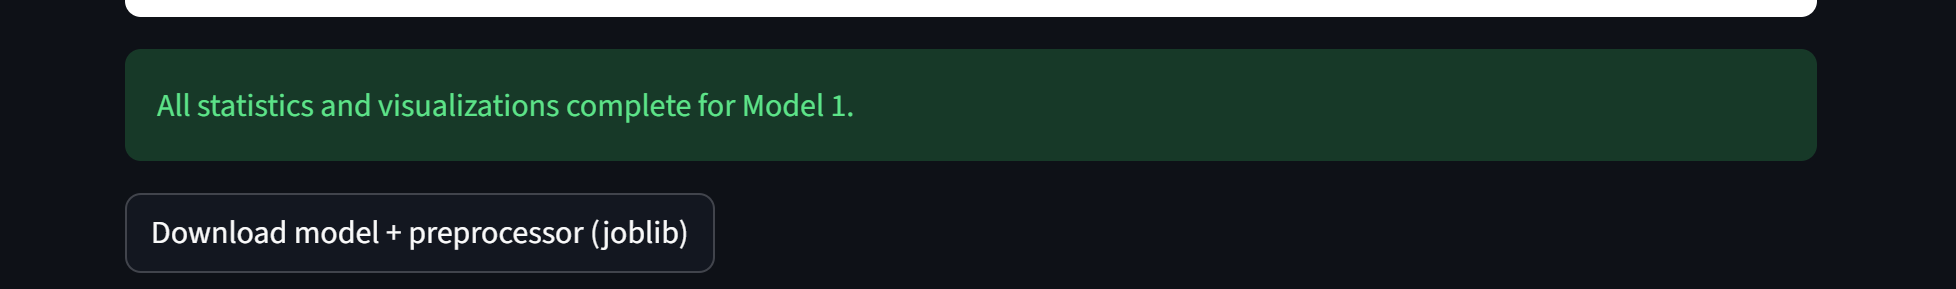
Download Preprocess Model option
-
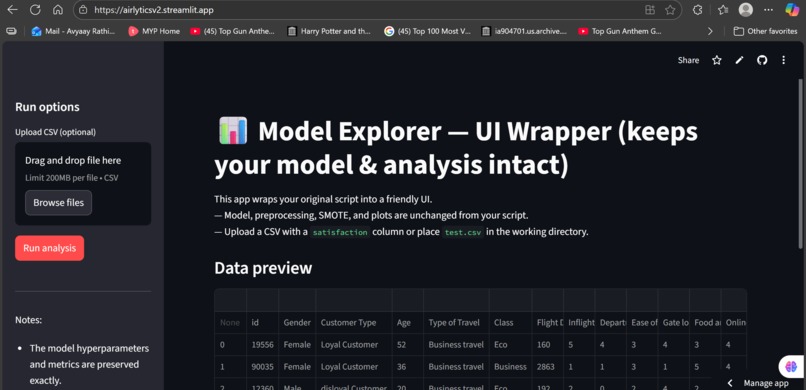
Main Dashboard
-
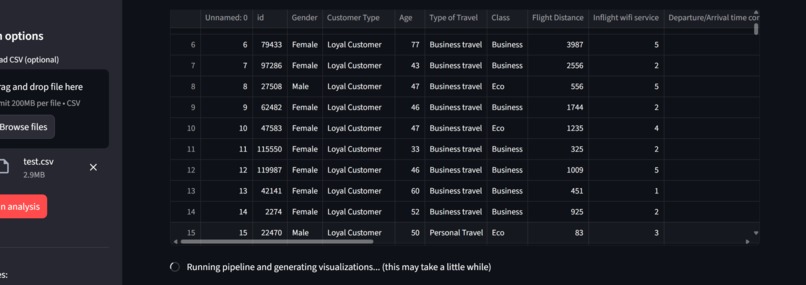
Running Pipeline/Model
-
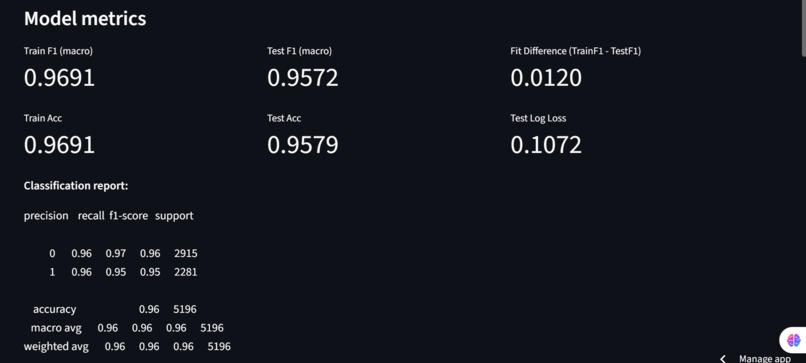
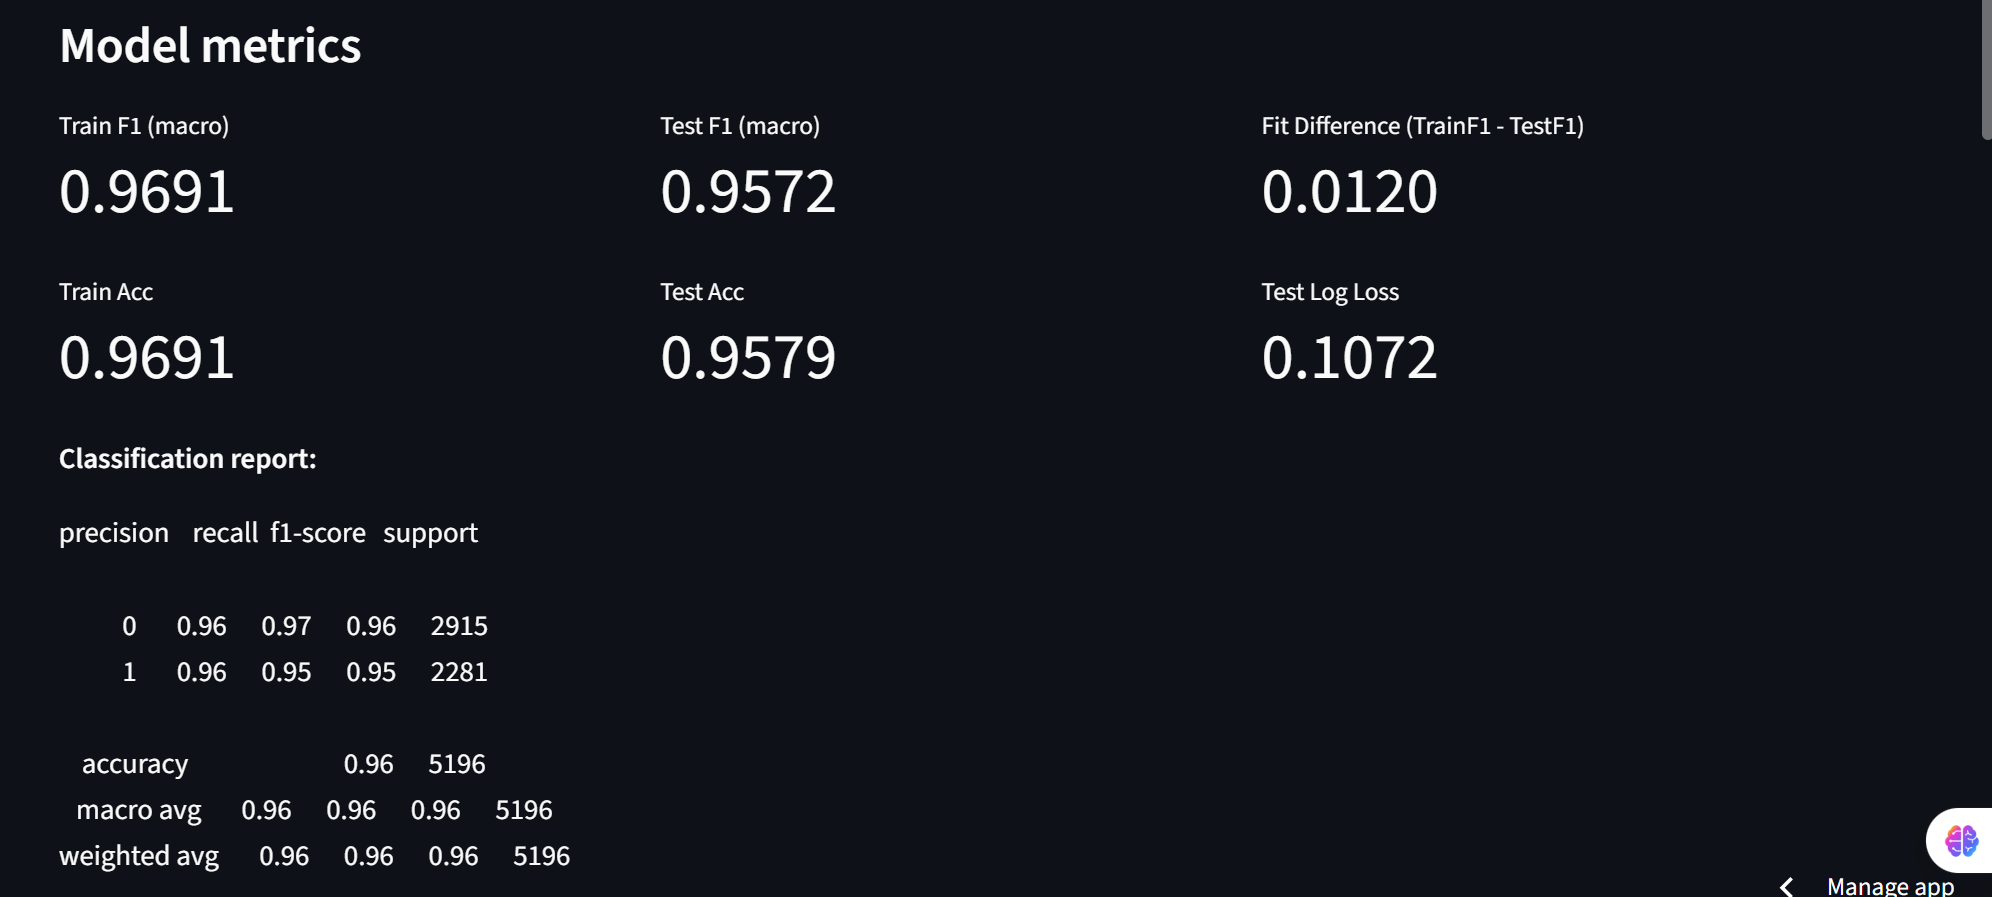
Model Results/Metrics
-
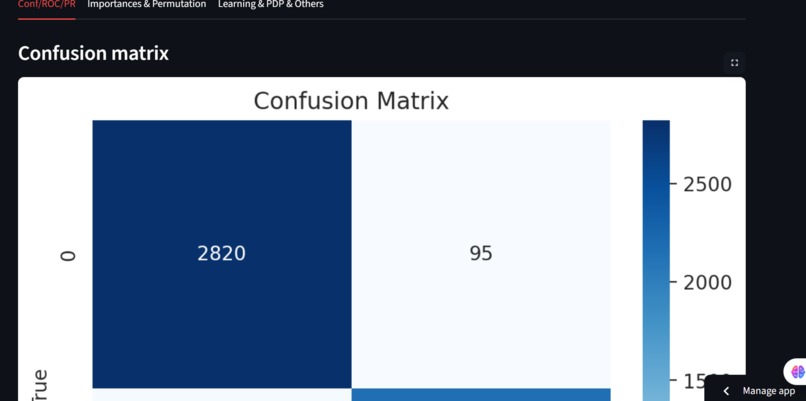
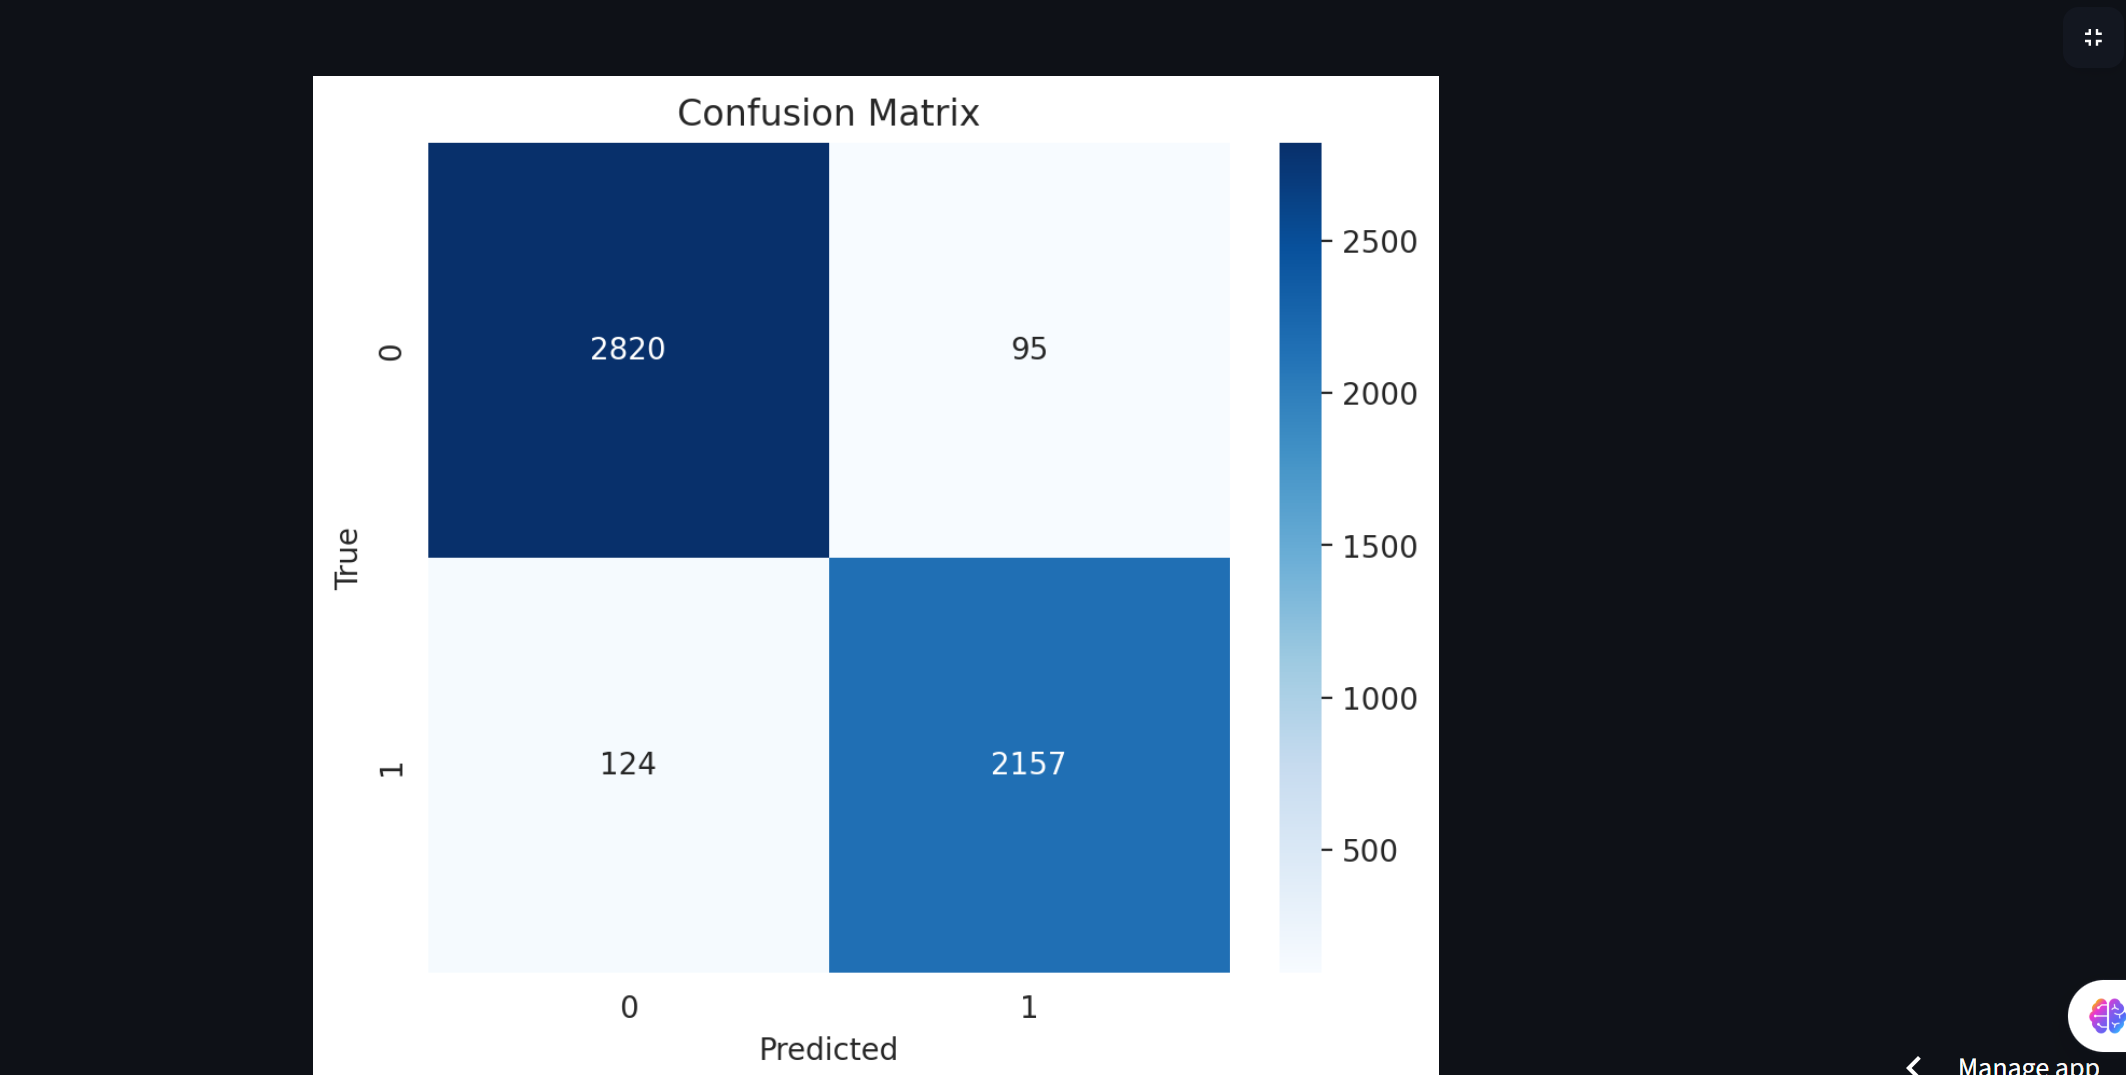
Confusion Matrix
-
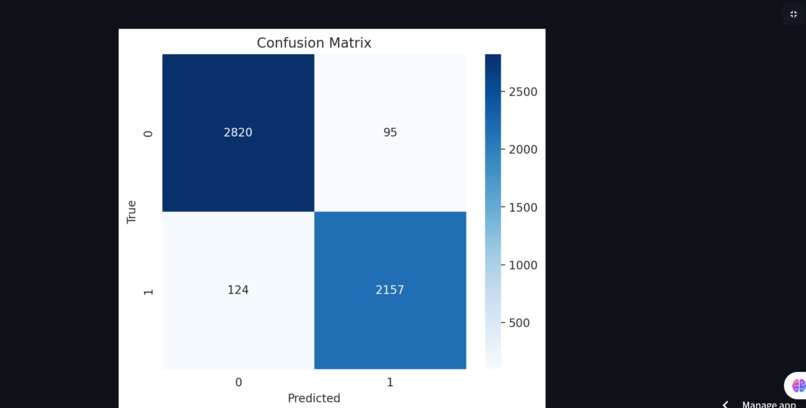
Confusion Matrix
-
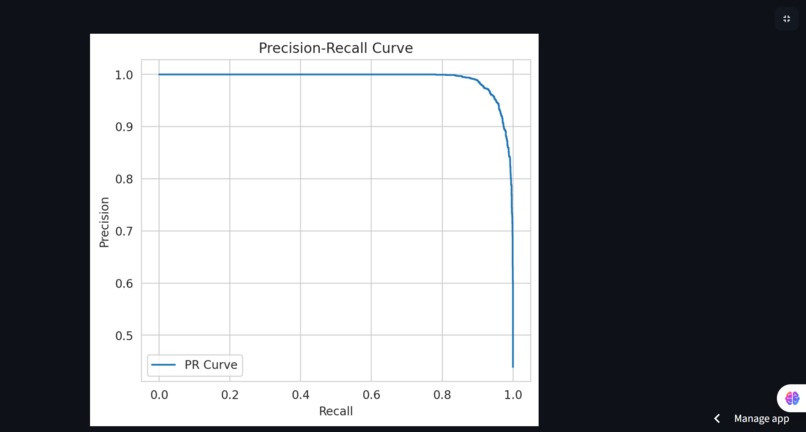
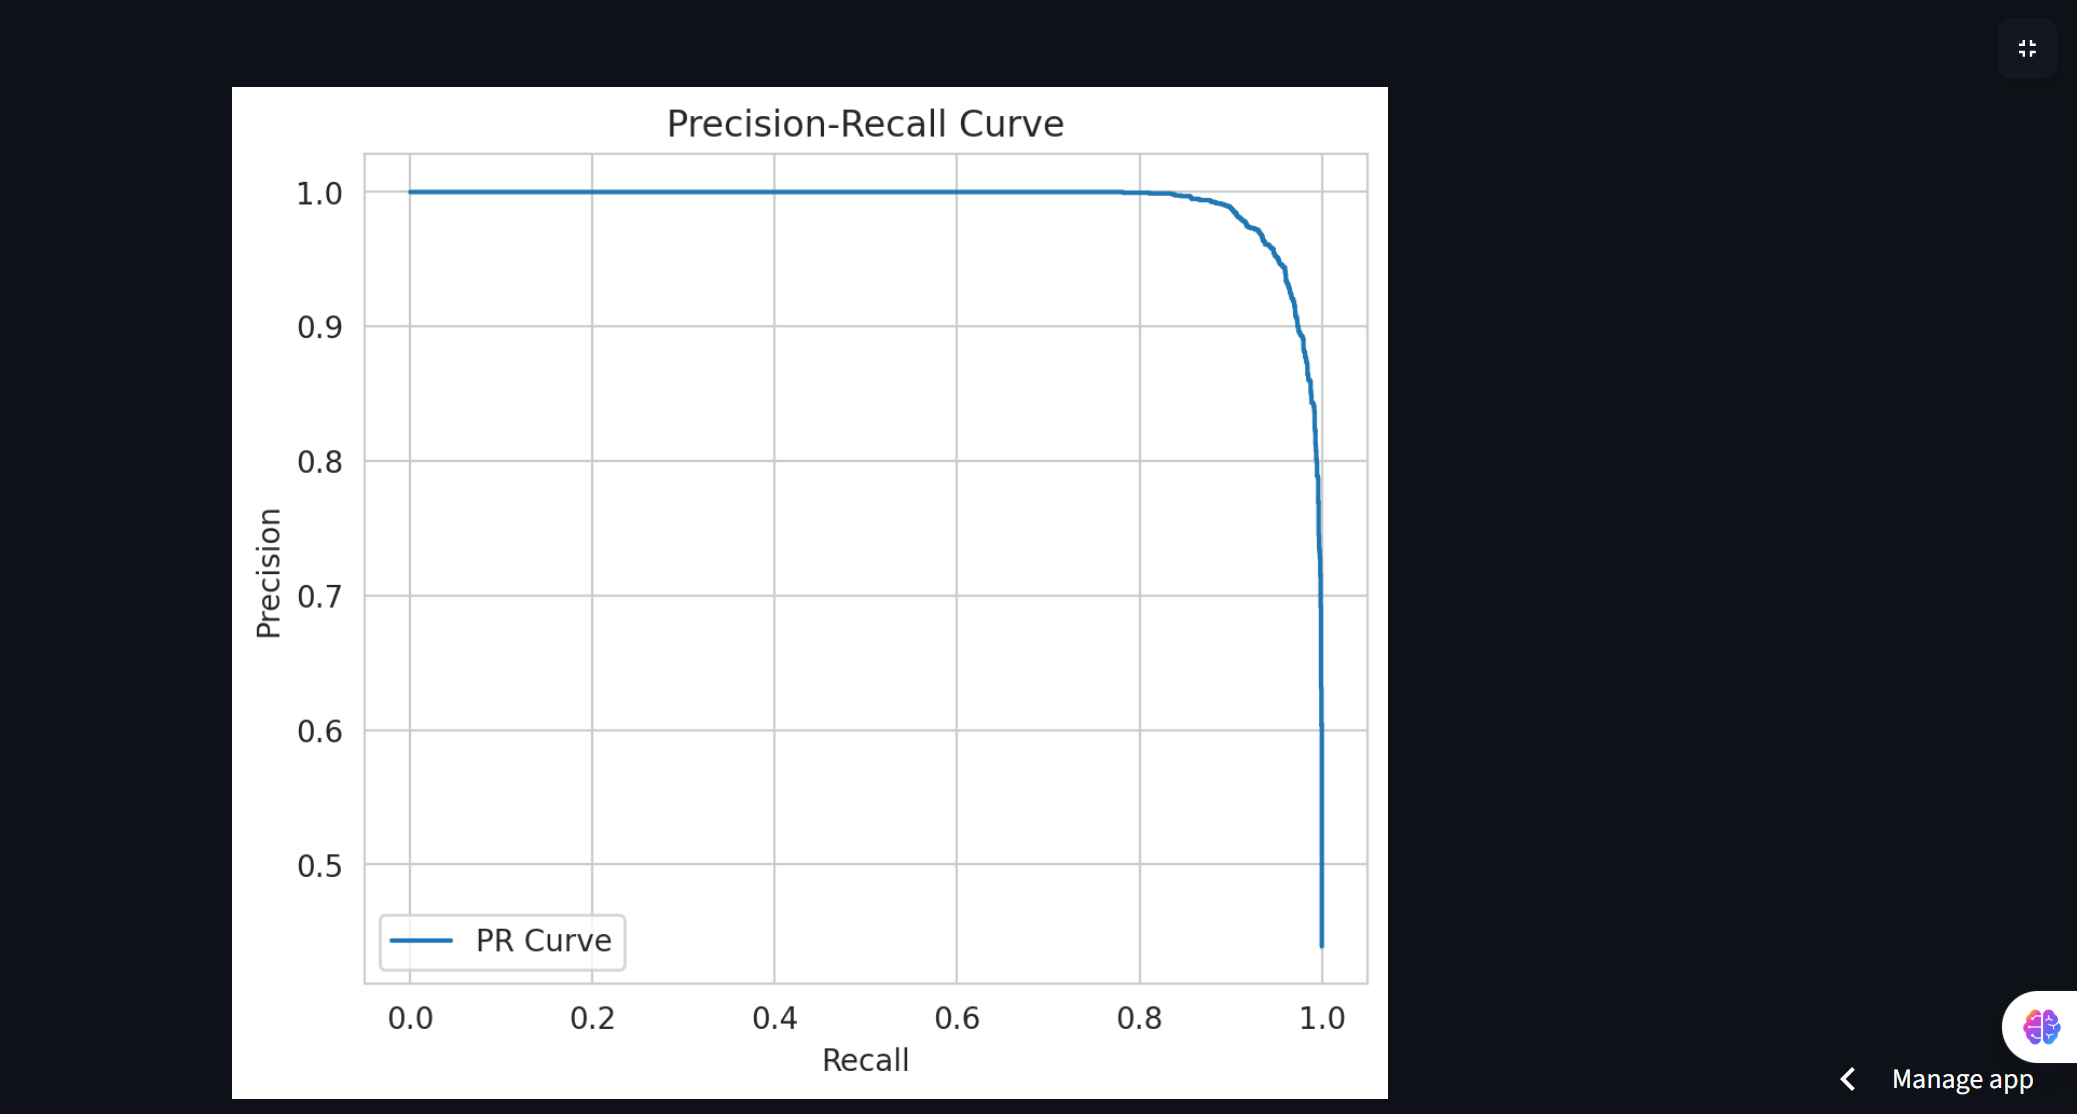
Precision-Recall Curve
-
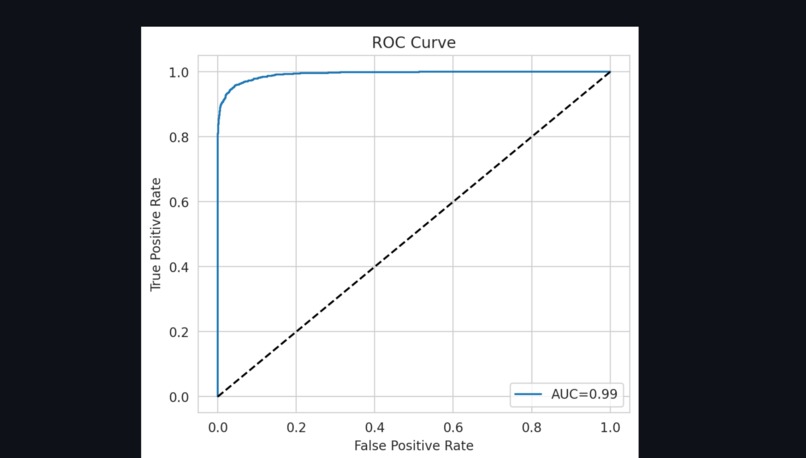
ROC Curve
-
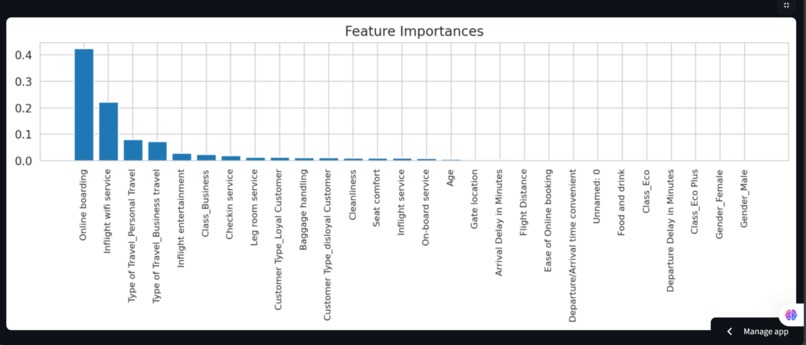
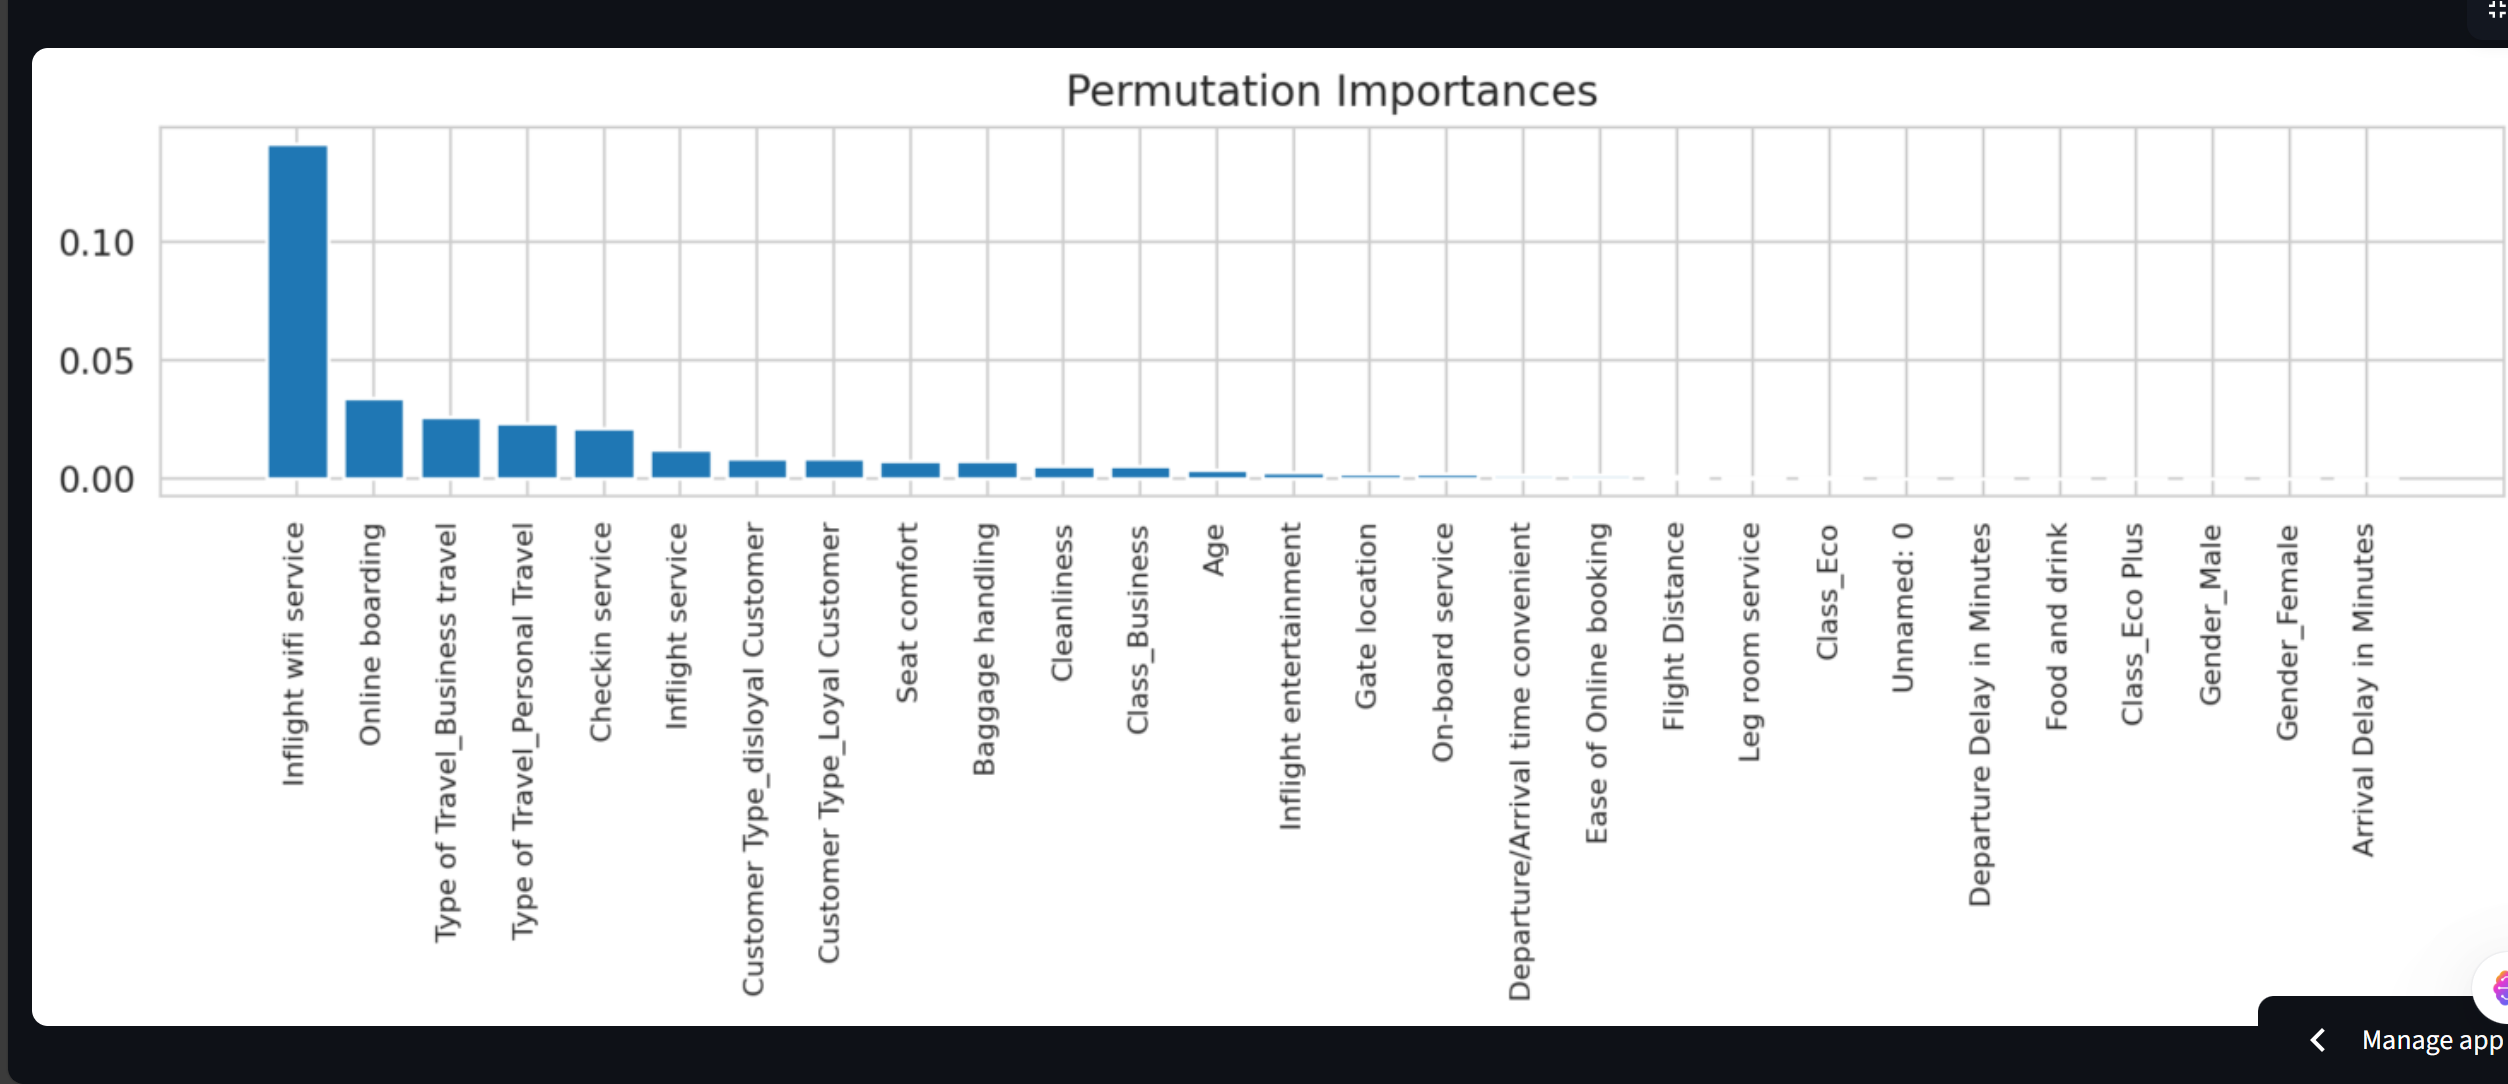
Feature Importance
-
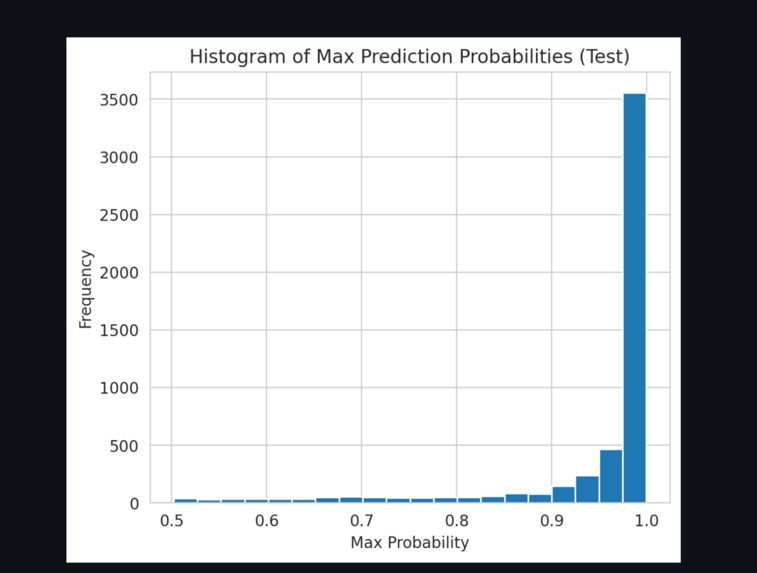
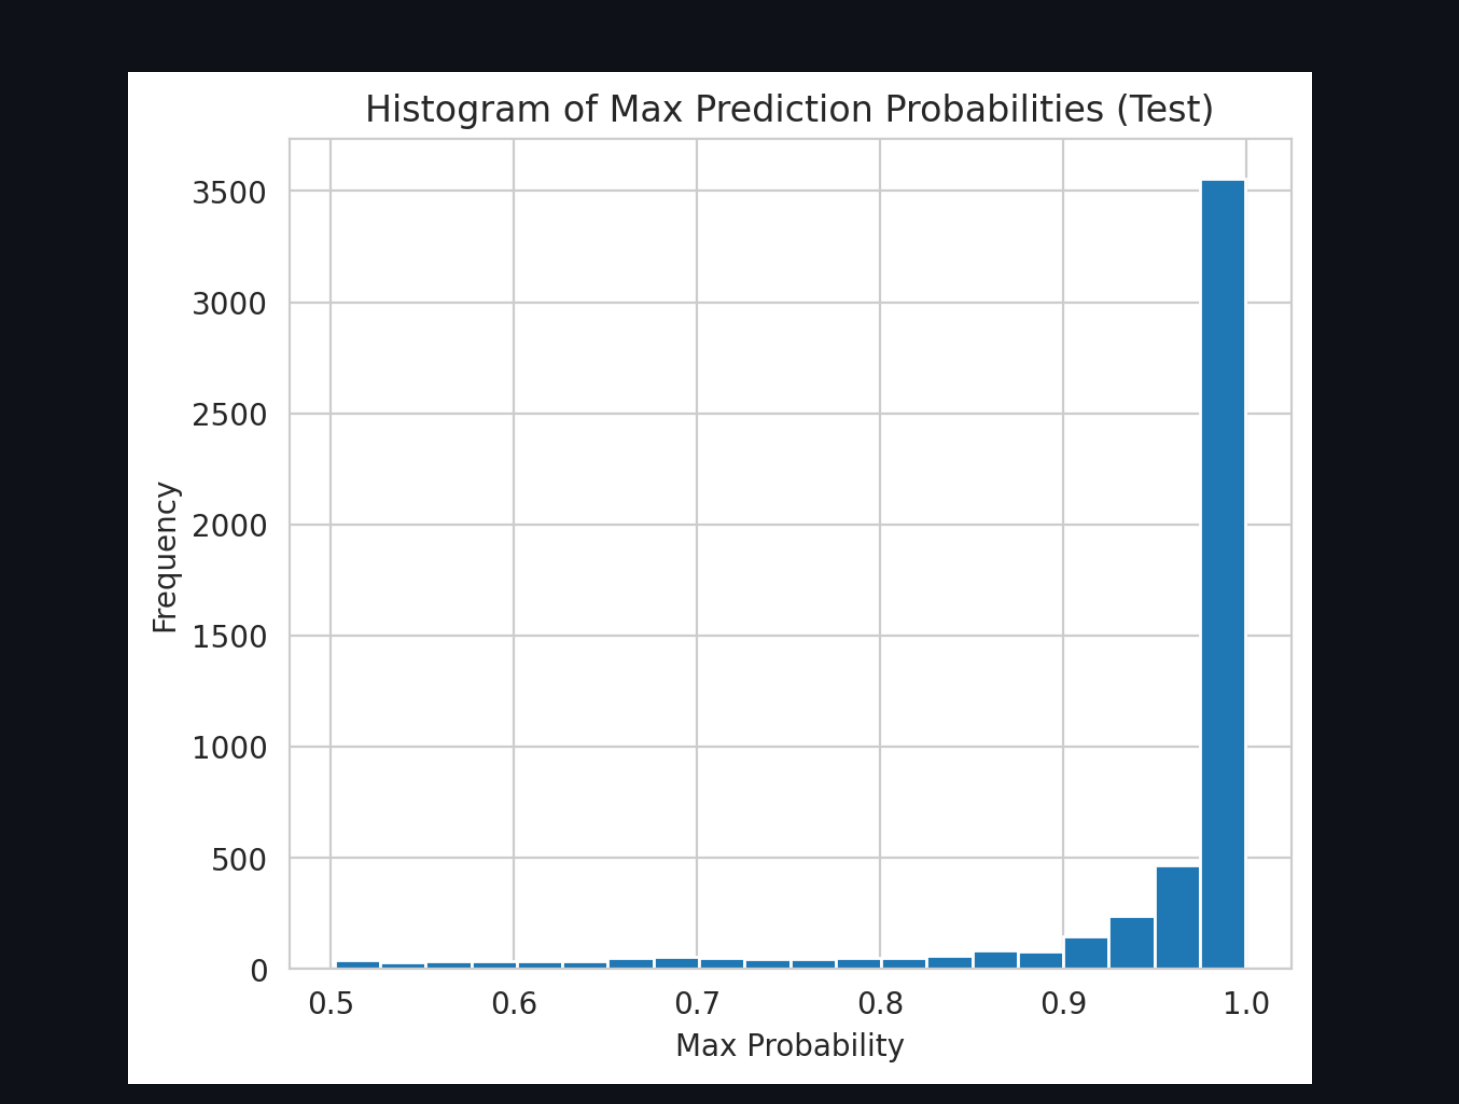
Histogram of Max Prediction Probabilties(test)
-
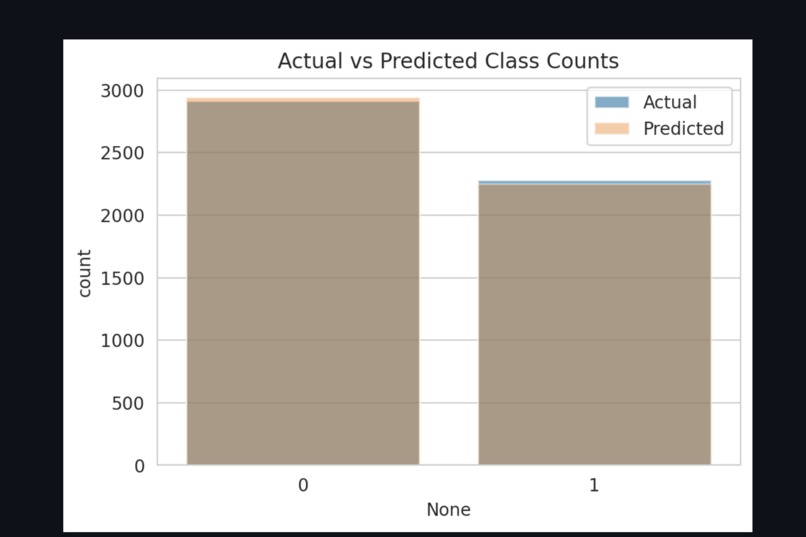
Actual vs Predicted Class Counts
-
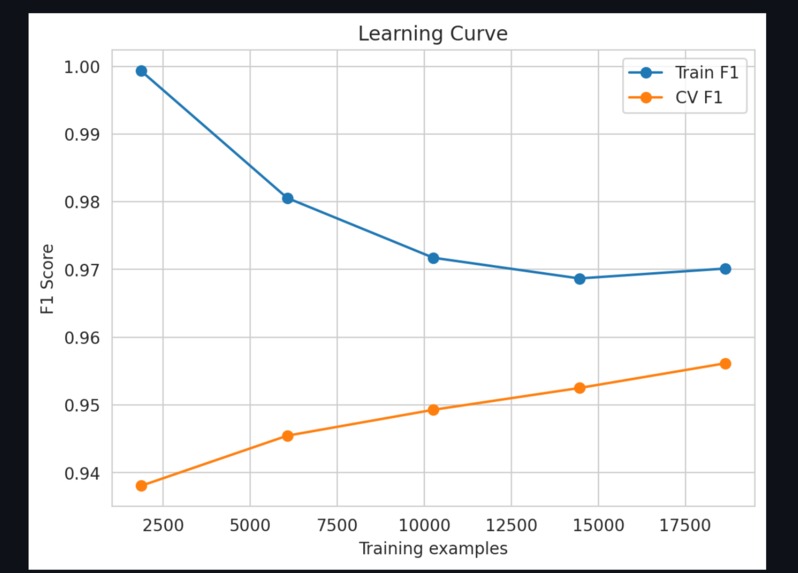
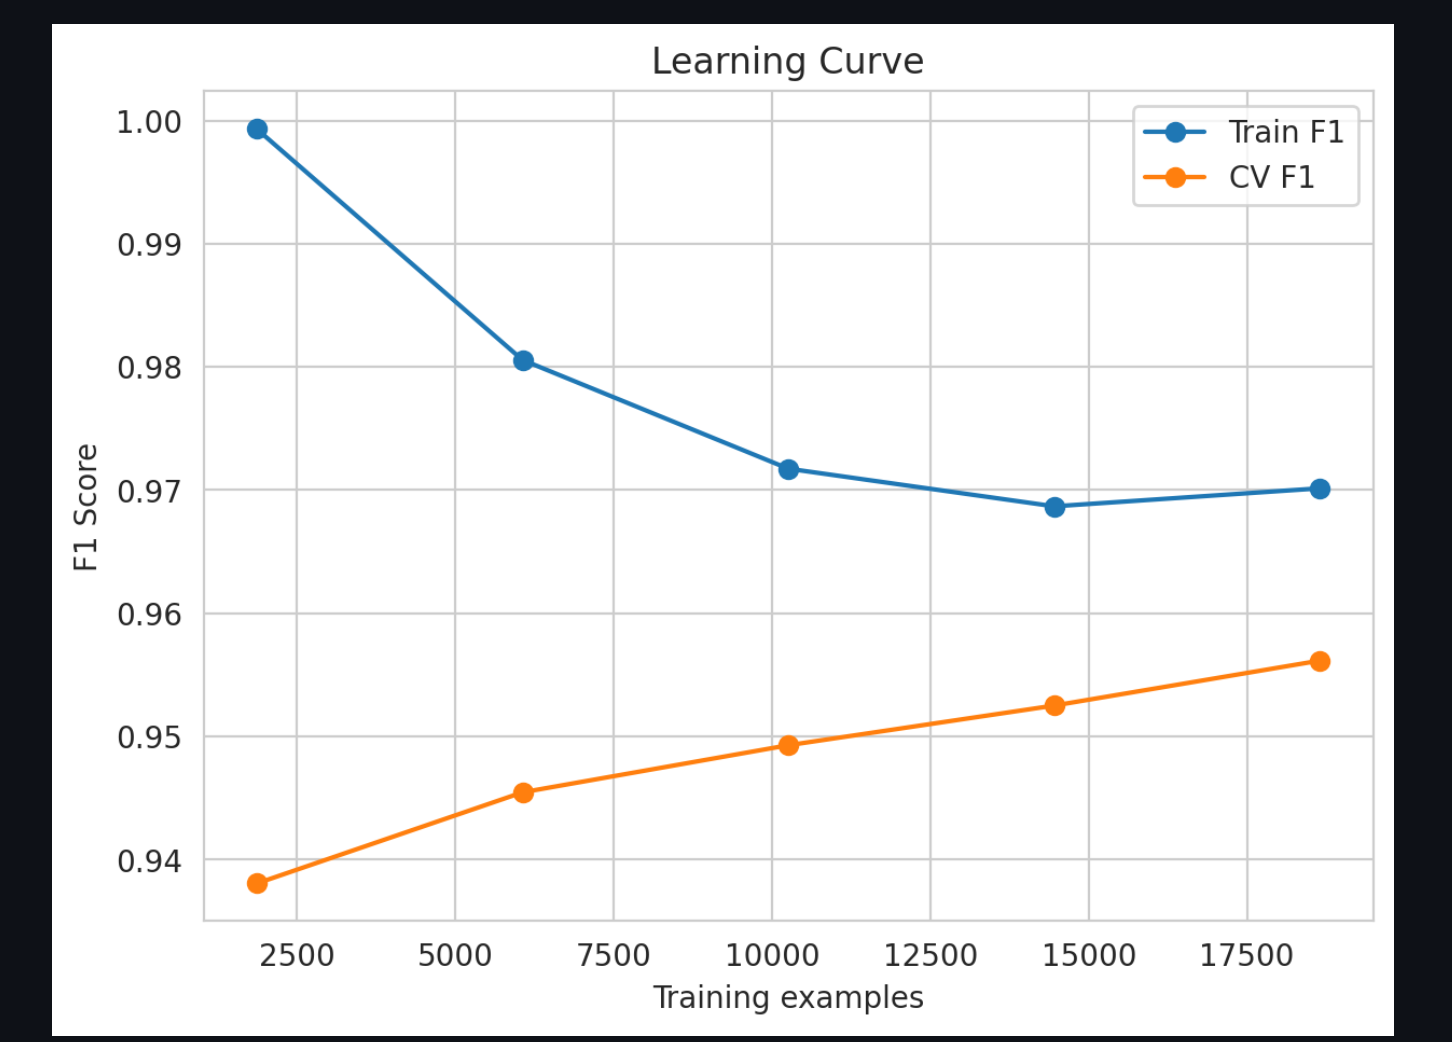
Learning Curve
-
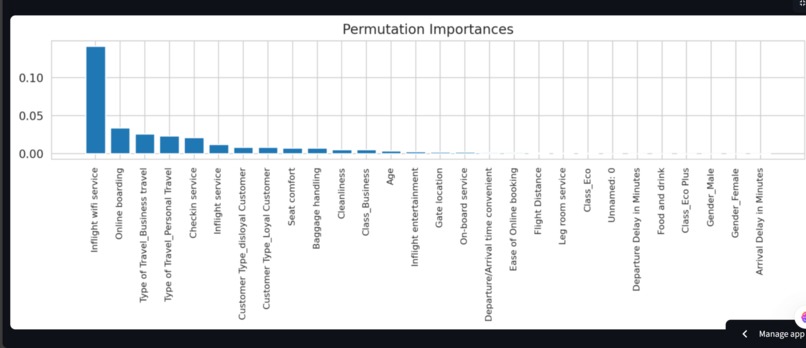
Feature Importance
-

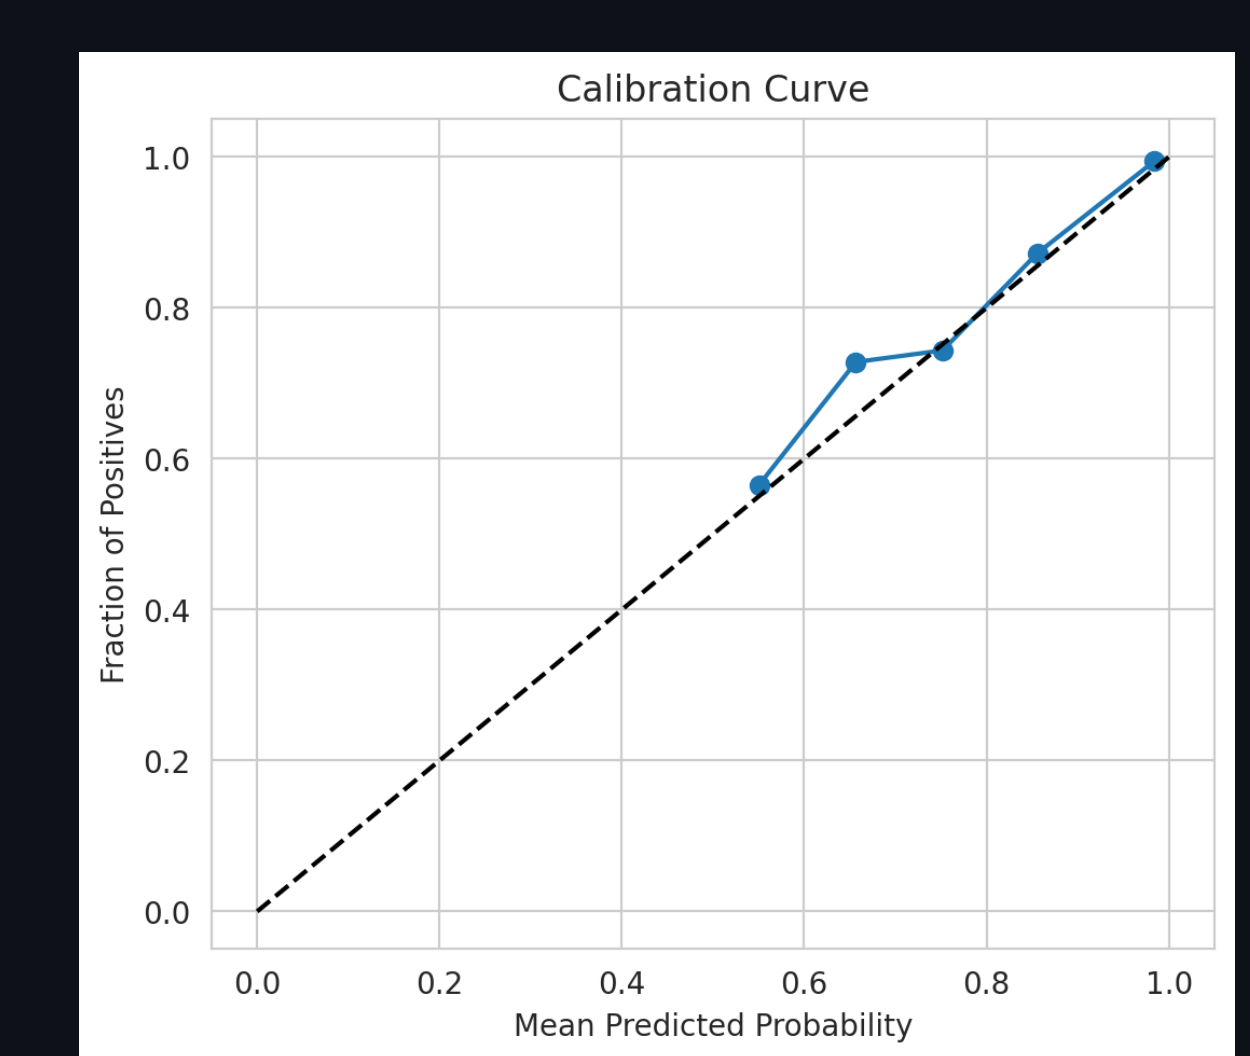
Calibration Curve
-
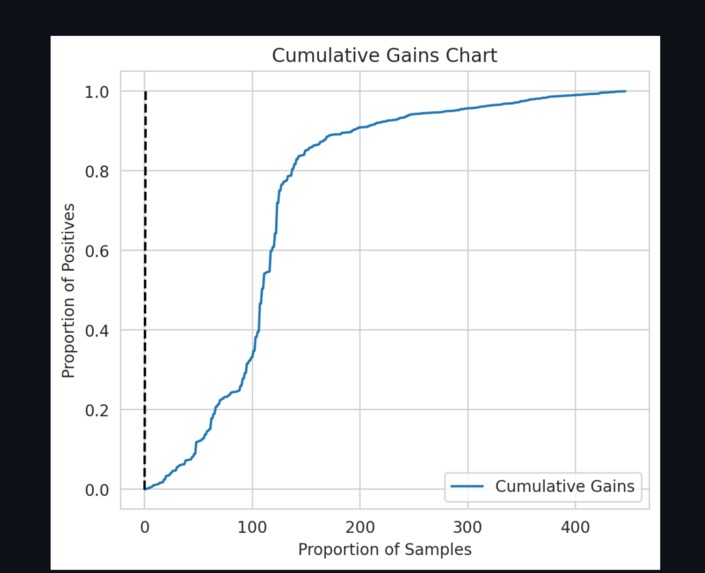
Cumalative Gains Chart


Inspiration Air travel is a vital connector in today’s world, yet many passengers face inconsistent service and high ticket prices. We were inspired to tackle this issue by building a predictive model that empowers airlines to make data-driven decisions—improving customer satisfaction while potentially lowering operational costs. Our goal: make flying more accessible and enjoyable for everyone.
What We Learned This project taught us far more than just machine learning. We dove deep into:
Data preprocessing: mastering techniques like SMOTE to handle severe class imbalance.
Model evaluation: understanding that accuracy alone can be misleading, and learning to use metrics like precision, recall, and confusion matrices.
Tool integration: combining Orange’s visual workflows with Python’s flexibility and Streamlit’s interactivity.
Team collaboration: dividing tasks efficiently while making every decision together.
How We Built It We started with the Airline Passenger Satisfaction dataset and conducted thorough exploratory data analysis to identify trends and anomalies. Preprocessing involved cleaning, encoding, and balancing the data using SMOTE.
We built and tested over 50,000 models using ensemble techniques, including Voting Classifiers and Gradient Boosting, optimizing hyperparameters to find the sweet spot between performance and interpretability.
Our final deployment was done using Streamlit, allowing users to interact with the model and visualize predictions in real time.
Challenges We Faced Class imbalance: Early models were biased toward the majority class. SMOTE helped us balance the dataset.
Tool limitations: Orange lacked a native SMOTE widget, so we had to implement oversampling manually using Python.
Model crashes: Partial dependence plots often failed due to misindexed features.
Hyperparameter tuning: Testing 50,000+ models took over 2 hours and required careful resource management.
Interpretability vs. accuracy: We constantly had to trade off between model complexity and user understanding.
Key Takeaways Model building is just 20%—the real work lies in preprocessing and tuning.
Visualization bridges the gap between technical models and non-technical stakeholders.
Iterate, fail, retry—that’s how great models are built.
Teamwork matters—our success came from shared ownership and collaborative decision-making.
Built With
- geeksforgeeks
- idle
- imbalanced-learn
- jupyternotebook
- kaggle
- orange
- orangedocumentation
- pip
- python
- sckit-learn
- streamlit
- streamlitcloud
- vscode


Log in or sign up for Devpost to join the conversation.