

Inspiration
The global pandemic has caused disruption in many economic sectors but has especially been difficult for the travel industry. We wanted to see how individual companies fared in the face of this challenge and how they are attempting to rebuild.
What it does
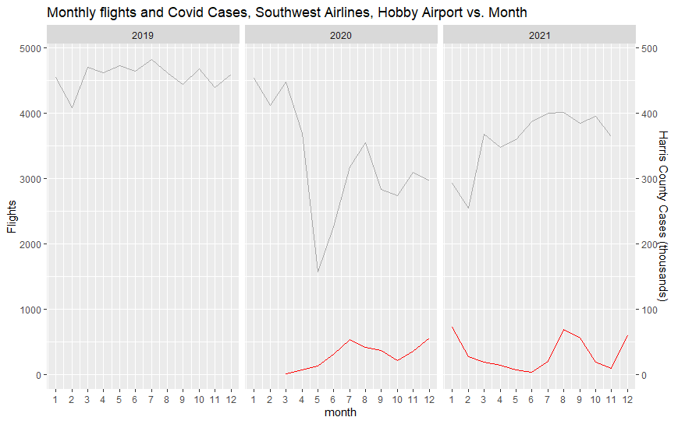
This presentation is a high-level view of trends in the number of flights for four major airlines before and after the pandemic. It is meant to show how these airlines were affected by Covid-19 and how well they are recovering.
How we built it
We used python and R to organize, clean and restructure our data so that it would be useful for our analysis. We then used tableau for visual analysis. We also used Python to create a predictor based on Multivariate Linear Regression to not only predict November and December 2021 values (since they're missing from our data), but also determine how far airline companies and the industry in general have recovered since the COVID pandemic in 2020.
Challenges we ran into
Because this is a rather open-ended challenge, we initially had trouble narrowing down our focus and finding relevant data to answer our questions.
Accomplishments that we're proud of
We are proud that everyone contributed to the project and learned a lot about the topic as well as how to find, manage and analyze our own datasets.
What we learned
When analyzing the data, we found that every airline experienced a steep decline in flights due to the pandemic. While this was expected, we also were surprised to learn that many of the airlines are recovering and appear to have an upward trend in the volume of their flights in late 2021 headed into 2022.


Log in or sign up for Devpost to join the conversation.