-
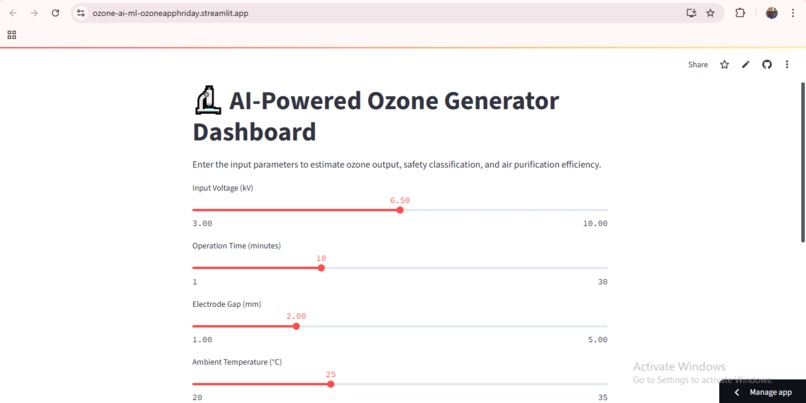
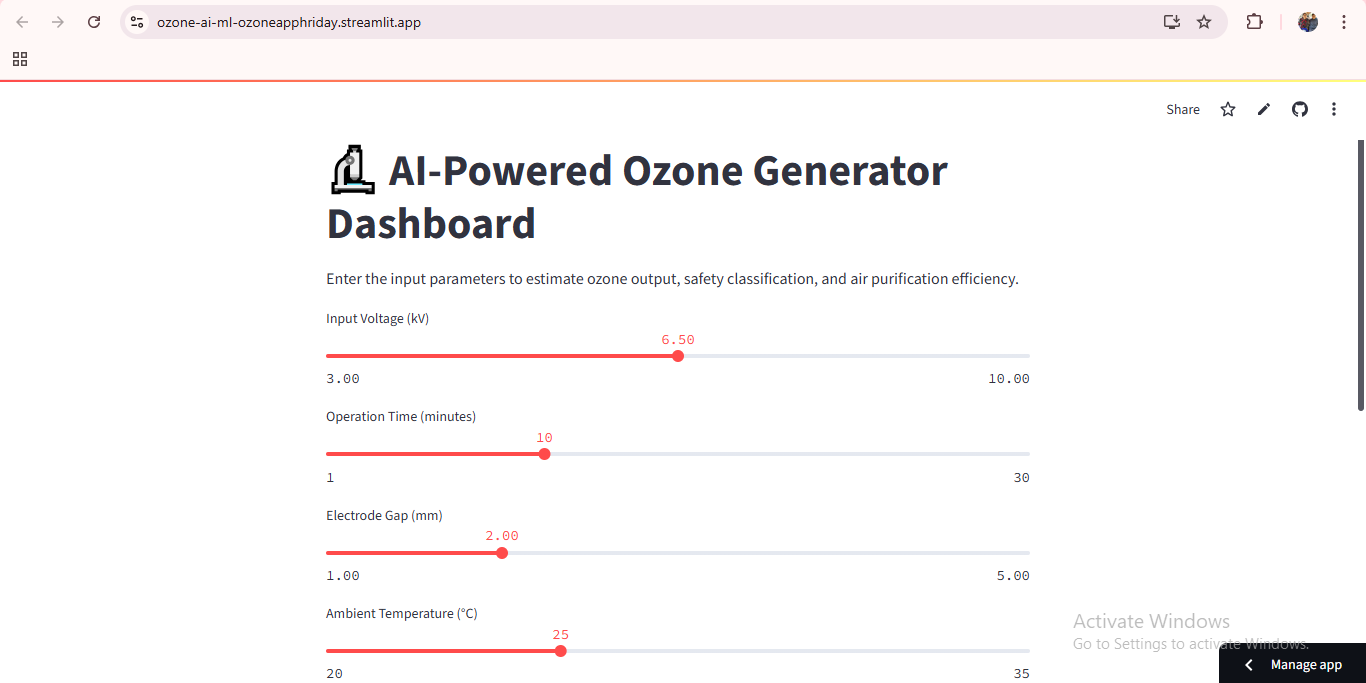
Home Screen / Dashboard View
-
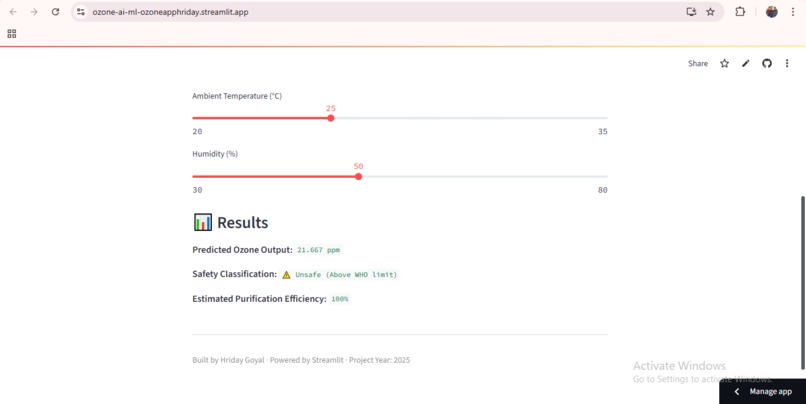
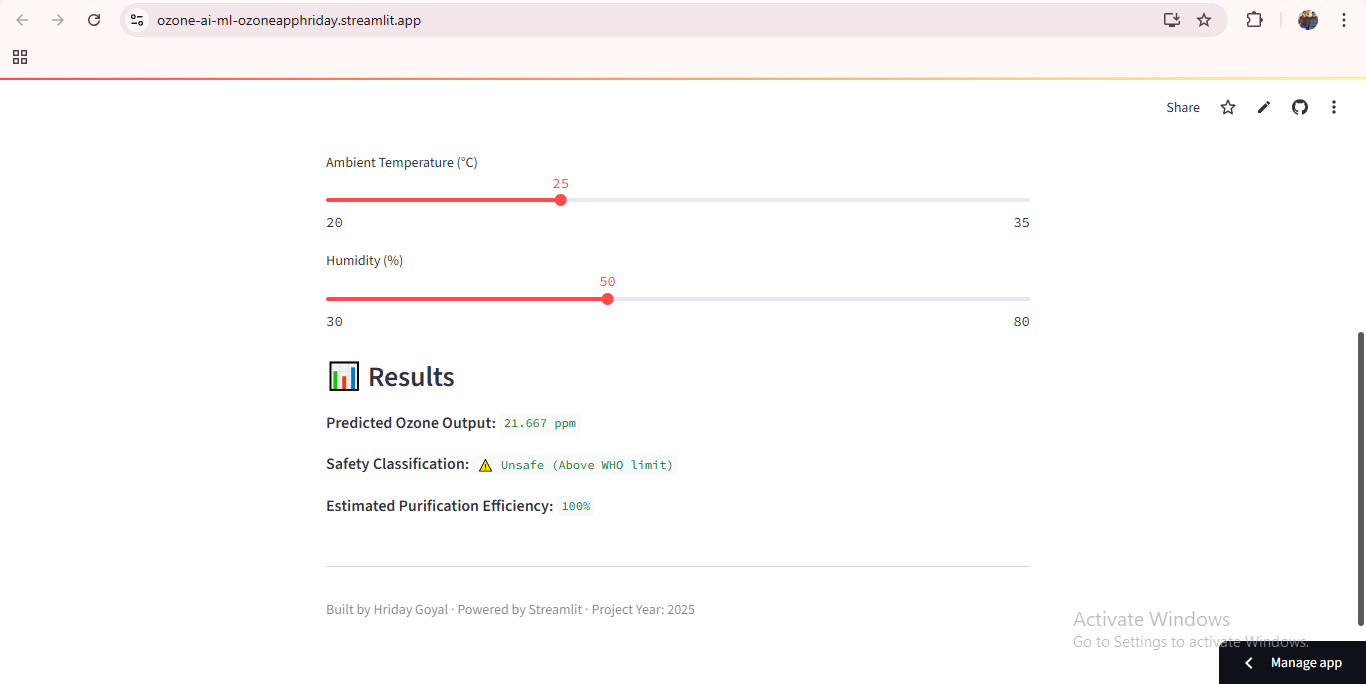
Output / Prediction
Inspiration
People with asthma, COPD, or other respiratory conditions often struggle to monitor air quality in real-time. For those with visual impairments or limited tech access, this challenge can be life-threatening.
AirGuard was built to offer a simple, accessible solution.
What It Does
AirGuard is a live dashboard that:
- Fetches real-time air quality and ozone data
- Uses color-coded safety levels for quick interpretation
- Offers ML-based predictions for air purification efficiency
- Is mobile-friendly and designed with accessibility-first principles
How I Built It
- UI: Streamlit (deployed on Streamlit Cloud)
- Backend: Python scripts for data handling
- ML: scikit-learn-based model to predict ozone output and efficiency
- Design: High-contrast visuals and a simplified layout
- Future-ready: Plans for speech and vibration-based alerts
Challenges I Ran Into
- Balancing functionality with accessibility
- Aligning ML predictions to real-world health use cases
- Finding and integrating reliable AQI/Ozone data sources
Accomplishments That I'm Proud Of
- Developed a fast, clean UI for non-technical users
- Live deployed app with a custom ML model
- Created a socially impactful, accessible tool
- Integrated AI with real-world environmental concerns
What I Learned
- How to align AI/ML with social good
- Accessibility principles in product design
- The real-world value of simple, inclusive interfaces
What's Next
- Add text-to-speech alerts for visually impaired users
- Integrate mobile notifications (Twilio, IFTTT)
- Translate the dashboard into Hindi and regional languages for rural use
Built With
- github
- python
- scikit-learn
- streamlit

Log in or sign up for Devpost to join the conversation.