Inspiration
Airfare is one of the most volatile items in India’s consumer basket, yet it is still tracked largely through manual, periodic price collection. Airlines reprice constantly based on demand, season, and how far ahead you book, so analysts often see a static, delayed picture of a very dynamic market.
Three things pushed us to build AIRA:
A policy gap. MoSPI’s CPI 2024 already uses online airfare sources and expanded the basket from 299 to 358 items (40 → 50 service items). A Parliamentary Committee has also recommended AI-driven real-time tariff analysis and a Pricing Transparency Index. A monitoring gap. DGCA’s existing monitoring covers about 78 routes (~27% of traffic). Automated fare analysis could strengthen it. A research foundation. The Bank of Italy’s airfare inflation nowcasting, the US Bureau of Labor Statistics’ air-travel transaction index, and IIM Ahmedabad’s study of Indian airfare movements showed that a high-frequency airfare index is both feasible and valuable.
We wanted to give statisticians, economists, and RBI policymakers a transparent, real-time airfare signal for inflation analysis.
What it does
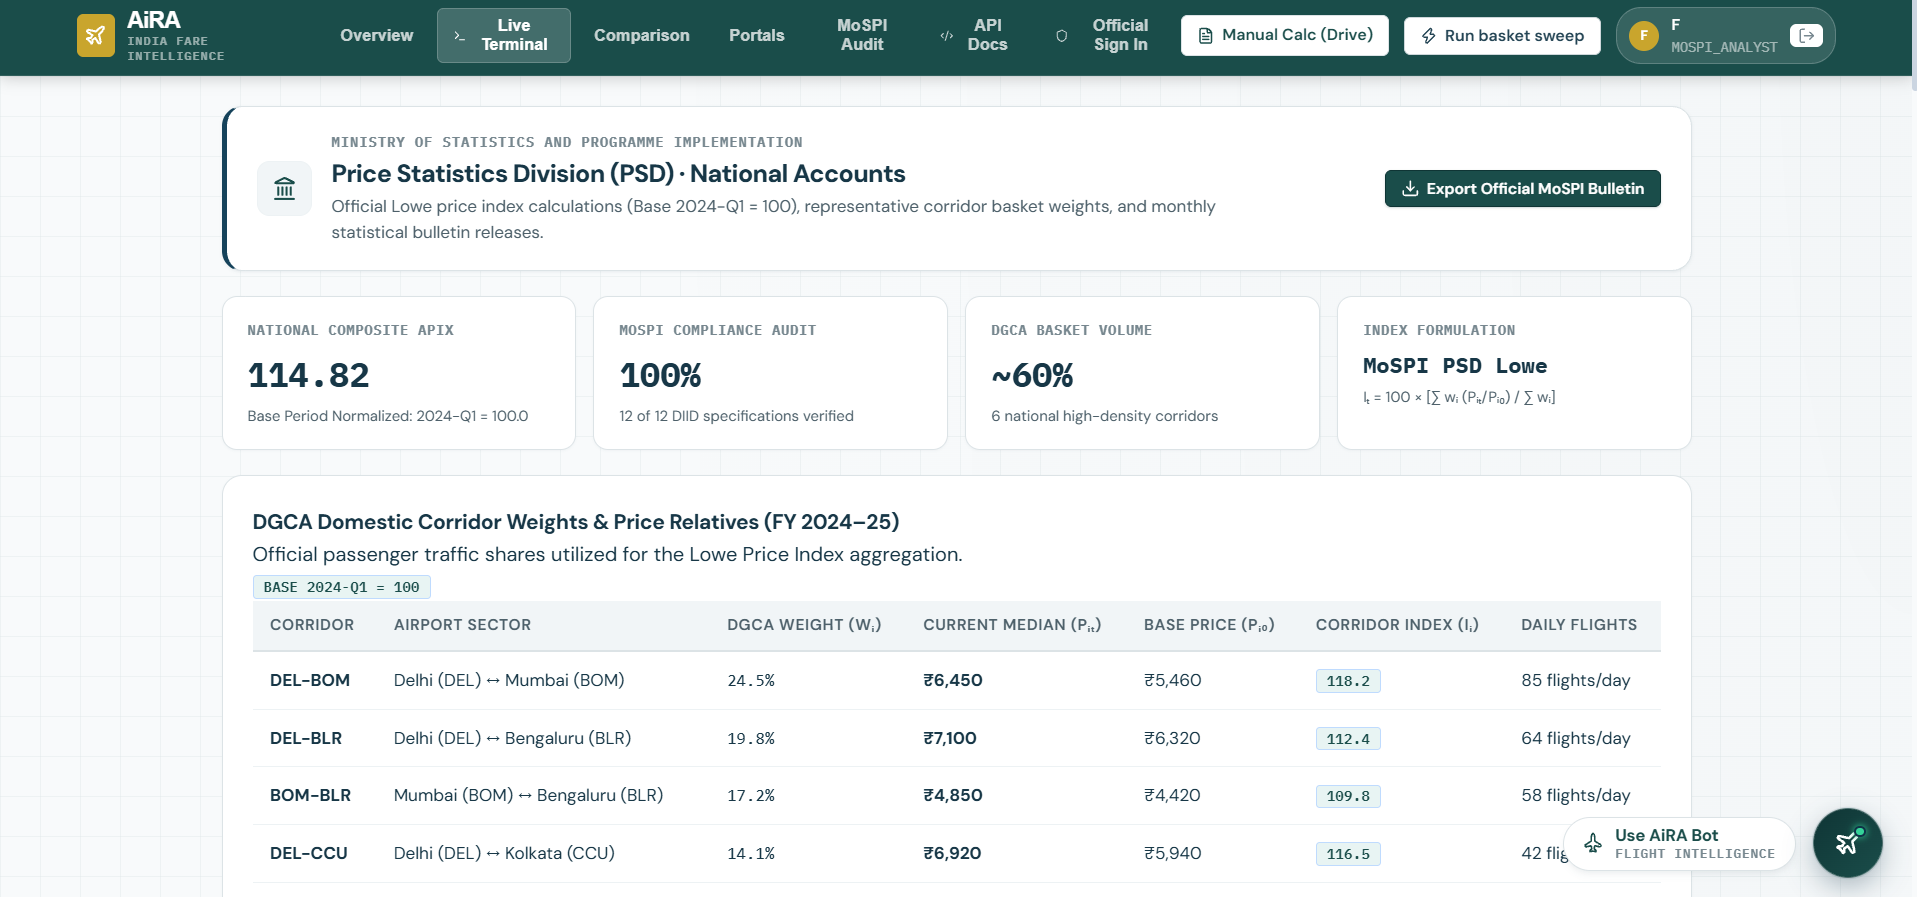
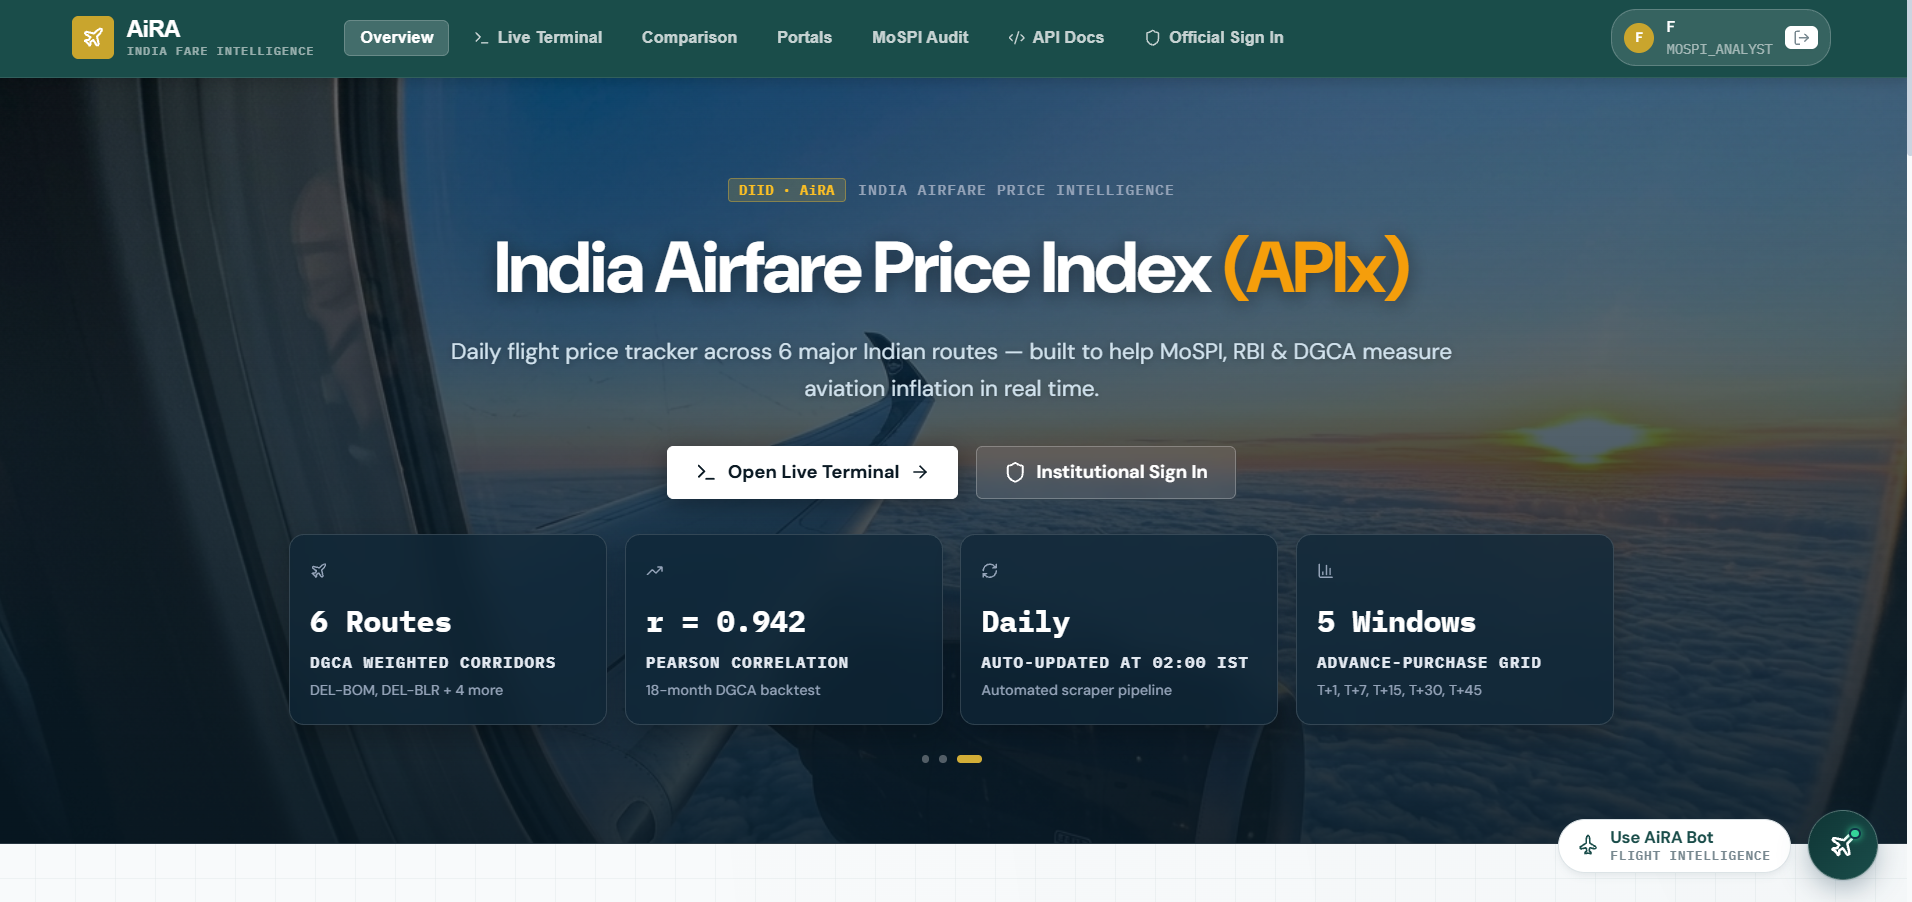
AIRA (Airfare Intelligence & Real time Analytics) automates the collection, cleaning, and analysis of airfare data to produce a Real-time Airfare Price Index (APIx) that can augment the CPI.
Ethically collects fares from airlines (IndiGo, Air India, Air India Express, Akasa Air, SpiceJet) and OTAs (MakeMyTrip, Cleartrip, Goibibo, EaseMyTrip, Yatra and others) Cleans and normalizes fares across booking windows T+1, T+7, T+15, T+30, and T+45 Computes daily, weekly, and monthly APIx with MoM and YoY changes Forecasts future APIx and CPI trends Provides route maps, heatmaps, airline comparisons, and HHI-based competition analysis Raises explainable AI alerts for price spikes and data-quality problems Quantifies how missing data affects index confidence Labels fares as Low, Normal, or High for the public Delivers dashboards, PDF/Excel reports, audit trails, 30-day DGCA backtesting, and role-specific APIs for NSO, MoSPI, and RBI How we built it
Ethical data collection. Each source is checked against robots.txt and Terms of Service first. If access is permitted, Playwright and Scrapy collectors fetch fares on a schedule, using a parent-child architecture for parallel scraping, smart caching, and rate limiting. Responses are validated, retried a limited number of times, and logged and skipped if they keep failing. Celery and Apache Airflow handle scheduling, and Redis caches raw data.
Cleaning and normalization. Pandas and Polars remove duplicates, handle missing values and sold-out flights, and standardize fares into base fare, taxes, and total. Outliers are flagged with the interquartile range:
$$\text{IQR} = Q_3 - Q_1, \qquad \text{outlier if } x < Q_1 - 1.5\,\text{IQR} \ \text{ or } \ x > Q_3 + 1.5\,\text{IQR}$$
Clean data is stored in PostgreSQL with TimescaleDB, and MinIO holds raw snapshots and reports.
- Index construction. For each route $r$, we compute a price relative against the base period (Base = 100):
$$P_{r,t} = \frac{p_{r,t}}{p_{r,0}} \times 100$$
The route-level relatives are then combined using passenger-traffic weights $w_r$ (with $\sum_r w_r = 1$):
$$\text{APIx}t = \sum{r} w_r \, P_{r,t}$$
Month-on-month and year-on-year changes follow directly:
$$\text{MoM}t = \left(\frac{\text{APIx}_t}{\text{APIx}{t-1}} - 1\right) \times 100$$
- Forecasting and validation. Statsmodels and SciPy power the time-series forecasts. We validate against reference data using four measures:
$$ \text{MAE} = \frac{1}{n}\sum_{i=1}^{n}|y_i - \hat{y}i|, \qquad \text{RMSE} = \sqrt{\frac{1}{n}\sum{i=1}^{n}(y_i - \hat{y}i)^2} $$ $$\text{MAPE} = \frac{100}{n}\sum{i=1}^{n}\left|\frac{y_i - \hat{y}_i}{y_i}\right|$$
along with Pearson’s $r$ for correlation. Route competition is measured with the Herfindahl–Hirschman Index, where $s_i$ is airline $i$’s share on a route:
$$\text{HHI} = \sum_{i} s_i^2$$
- Backend, frontend, and operations. FastAPI, Pydantic, and JWT provide secure, role-based APIs. The React and TypeScript dashboard uses ECharts for charts and MapLibre for route maps, organized in an Nx monorepo. Docker with CI/CD handles deployment, Pytest handles testing, and Prometheus and Grafana monitor system health. The index engine is versioned: any methodology change goes through recalculation, backtesting, expert approval, deployment, and rollback if needed.
Challenges we ran into Dynamic, JavaScript-heavy sites. Plain HTTP requests returned no fares, so we moved to Playwright with modular, source-specific collectors. Access restrictions. We respect robots.txt and ToS, apply rate limits, and fall back to approved or public sources when access is limited. This creates coverage gaps, which is why we built missing-data impact analysis. Messy fare data. Fare components, route names, and airline names differed across sources, so we built an automated standardization pipeline. Outliers and sold-out flights. These distorted early index values until we added IQR-based detection and cleaning. Constantly changing prices. We capture fares at scheduled intervals and keep timestamped history. Validation. Reference data is less granular than our collection, so we relied on multiple error measures and 30-day backtesting. Scope. We started with the top 10 DGCA routes and 5 booking windows, with plans to scale. What we learned Airfare pricing depends heavily on lead time. In one empirical airline-pricing study, advance-purchase discounts explained about 83% of within-flight price dispersion, so booking windows are part of the index design, not an afterthought. Data quality drives credibility. Showing coverage and confidence for each published value matters as much as the value itself. Ethical scraping takes real engineering: ToS checks, rate limiting, and fallbacks. Policy tools need explainability, audit trails, and versioning as much as accuracy. Simple statistics like percentiles, IQR, and coefficient of variation make complex fare behaviour understandable to the public, airlines, and policymakers. What’s next Scale from the top 10 routes to 50 and beyond, with 6-hour refreshes in peak seasons Extend to international routes using the same collection, fare-correction, and indexing framework Integrate more deeply with NSO, MoSPI, and RBI systems, and support DGCA/MoCA and a Pricing Transparency Index Improve forecasting, anomaly detection, and explainable insights Add fare-position tools for travellers and revenue-management insights for airlines and OTAs Pursue official data-sharing agreements to reduce dependence on scraping
Built With
- apache
- docker
- grafana
- playwright
- postgresql
- python
- statsmodels
- timescaledb
- typescript

Log in or sign up for Devpost to join the conversation.