
AIR2DNA 🧬🌫️
From the air we breathe to the biology inside us.
We can measure air pollution.
We can see haze.
We can track PM₂.₅ on a dashboard.
But there is a deeper question:
What happens after polluted air interacts with our biology?
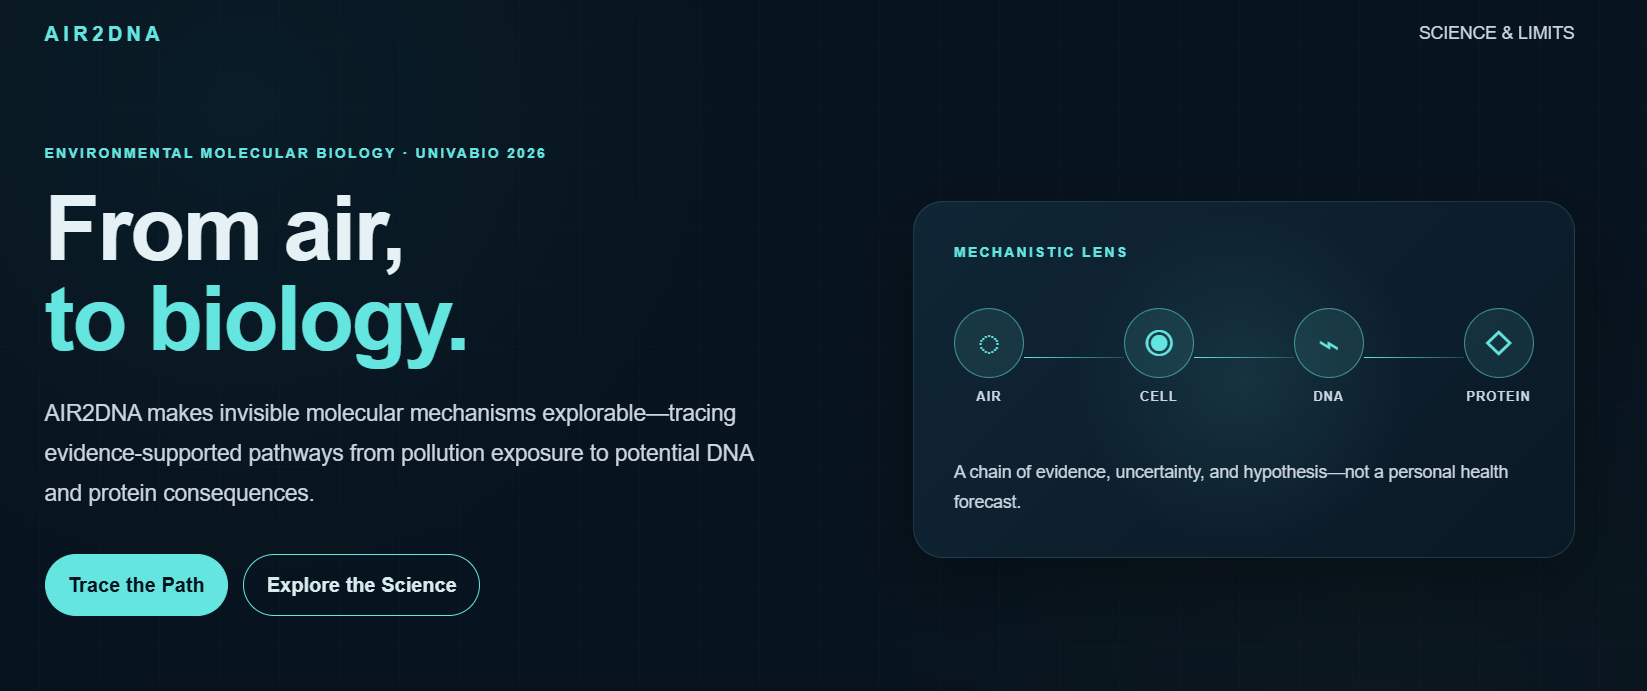
AIR2DNA is an interactive computational biology platform that explores how air-pollution exposure can propagate through biological mechanisms toward DNA damage and potential mutation consequences.
Instead of stopping at an air-quality number, AIR2DNA lets users trace the biological pathway:
$$ \text{Air Pollution} \rightarrow \text{Cellular Stress} \rightarrow \text{DNA Damage} \rightarrow \text{DNA Repair} \rightarrow \text{Potential Mutation} \rightarrow \text{Protein} $$
🌫️ The Problem
Air-quality applications usually stop at measurements:
PM₂.₅ = 150 μg/m³
But a number alone doesn't explain what is happening inside a cell.
Air pollution is a complex mixture of particles and chemicals. Research has associated particulate exposure with oxidative stress and oxidative DNA damage, while combustion-related compounds such as polycyclic aromatic hydrocarbons (PAHs) can form DNA adducts that interfere with DNA replication and repair.
These molecular processes are difficult to visualize and even harder to understand.
We wanted to build a bridge between two worlds:
Environmental data 🌫️
and
Molecular biology 🧬
💡 Our Solution
AIR2DNA
AIR2DNA transforms an environmental exposure scenario into an interactive biological journey.
A user can enter an exposure scenario such as:
- Location: Singapore
- Scenario: Haze episode
- PM₂.₅: 150 μg/m³
- Exposure duration: 8 hours
AIR2DNA then allows the user to explore a biological pathway:
PM₂.₅ / Pollutants
        ↓
 Cellular Stress
        ↓
Reactive Oxygen Species
        ↓
   DNA Damage
        ↓
    DNA Repair
        ↓
Potential Mutation
        ↓
Protein Consequence
Instead of simply producing a risk score, AIR2DNA lets the user trace the mechanism.
🔬 Trace the Path
The central feature of AIR2DNA is Trace the Path.
The user starts with an environmental exposure and follows the biological cascade step by step.
For example:
PM₂.₅
↓
Oxidative stress
↓
Reactive oxygen species
↓
Oxidative DNA damage
↓
8-oxo-dG
↓
DNA repair / replication
↓
Potential mutation
At each stage, users can inspect:
- What is happening biologically?
- Why does it matter?
- What evidence supports the mechanism?
- What is experimentally established?
- What is computationally modeled?
- What are the limitations?
This makes the biological process transparent rather than hiding it behind a single number.
🧬 From DNA Damage to Mutation
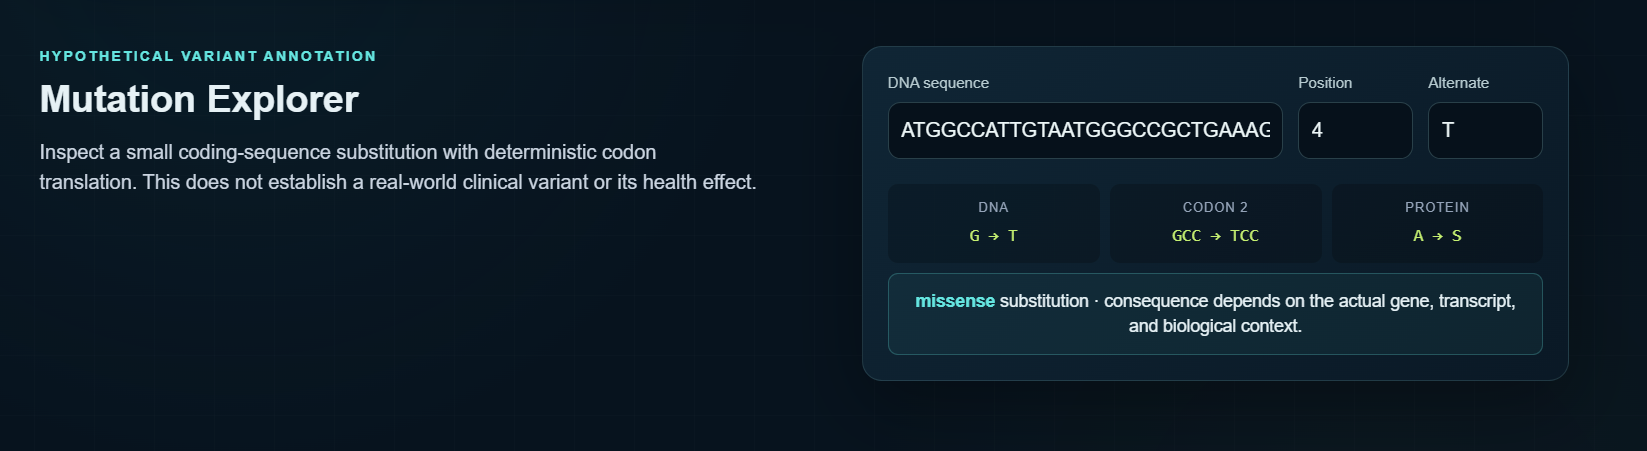
AIR2DNA also includes an interactive Mutation Explorer.
Users can explore how a nucleotide change propagates through biological information:
$$ \text{DNA} \rightarrow \text{Codon} \rightarrow \text{Amino Acid} \rightarrow \text{Protein} \rightarrow \text{Potential Functional Consequence} $$
For example, a single nucleotide substitution can alter a codon and potentially change the amino acid encoded by that codon.
Where structural information is available, AIR2DNA can visualize the affected residue within a 3D protein structure.
This connects something microscopic and abstract — a single nucleotide — to something users can actually see and explore.
🤖 AI + Computational Biology
AIR2DNA is not simply an LLM wrapped around an air-quality dashboard.
We use computation and AI where they provide genuine value.
The platform combines:
- Exposure modelling
- Biological pathway modelling
- DNA sequence analysis
- Mutation classification
- Protein structure visualization
- Evidence-grounded scientific explanations
- Machine-learning components where appropriate datasets support them
The system distinguishes between three levels of certainty:
🟢 Evidence-supported
Biological mechanisms supported by published research.
🟡 Modelled
Computational representations of biological relationships.
⚪ Hypothetical
Possible downstream consequences that should not be interpreted as predictions for an individual.
This distinction is fundamental to AIR2DNA.
🌏 Why Haze?
We chose haze as our initial real-world scenario because it makes the environmental-to-biological connection tangible.
During a haze event, people can see that air quality has deteriorated.
They can see the PM₂.₅ number.
But they cannot see:
$$ \text{Particles} \rightarrow \text{Cellular Stress} \rightarrow \text{DNA Damage} $$
AIR2DNA attempts to make that invisible chain visible and explorable.
The platform can also incorporate public air-quality data to recreate historical exposure scenarios and explore how environmental conditions influence the modeled biological pathway.
🧪 Why This Matters
We did not want to build another:
- ❌ AQI dashboard
- ❌ Generic symptom checker
- ❌ Health chatbot
- ❌ "AI predicts your disease" application
Instead, AIR2DNA asks:
Can technology help people understand how an environmental exposure can propagate through biology at the molecular level?
The result is an interactive bridge between:
🌫️ Environmental Science
🧪 Cell Biology
🧬 Genetics
🤖 Artificial Intelligence
💻 Computational Biology
🔎 Scientific Responsibility
AIR2DNA does not diagnose disease.
It does not predict whether an individual will develop cancer.
It does not claim that a particular pollution exposure will cause a specific mutation in a person.
Instead, it explores biological mechanisms supported by scientific literature and clearly communicates uncertainty.
Our goal is not to turn complex biology into a misleading percentage.
Our goal is to make the complexity:
Understandable. Inspectable. Interactive.
🛠️ How We Built It
Frontend
- Next.js
- TypeScript
- Tailwind CSS
- Interactive data visualization
- Molecular visualization
Backend
- Python
- FastAPI
- Computational biology services
Scientific Computing
- Python
- Biopython
- NumPy
- pandas
- scikit-learn
Biological & Environmental Data
- Public air-quality datasets
- Peer-reviewed scientific literature
- Public genomic resources
- Public protein/structural databases
Molecular Visualization
- Browser-based protein structure visualization
The architecture is modular, allowing additional pollutants, biological pathways, genes, mutations, and datasets to be incorporated in future versions.
🚀 What's Next?
AIR2DNA is the beginning of a broader idea:
What if environmental health data could be connected all the way down to molecular biology?
Future versions could incorporate:
- Additional pollutants
- More detailed exposure histories
- Additional DNA-damage mechanisms
- Larger biological datasets
- More genes and protein structures
- Improved computational models
- Experimental validation using safe biological model systems
Ultimately, we envision AIR2DNA as a platform for exploring the hidden biological consequences of the environments we live in.
🌍 The Bigger Picture
Pollution is often represented as a number.
Biology is often represented as a diagram.
Genetics is often represented as a sequence of letters.
AIR2DNA connects them.
$$ \boxed{ \text{Air} \rightarrow \text{Cell} \rightarrow \text{DNA} \rightarrow \text{Protein} } $$
Because sometimes the most important part of a problem isn't the number we can measure.
It's what happens after the number enters the biology.
AIR2DNA
From the air you breathe to the biology inside you.
Built With
- fastapi
- next.js
- python
- python-package-index
- tailwind-css
- typescript

Log in or sign up for Devpost to join the conversation.