Inspiration
Helping those who are affected by a preventable pollution situation.
What it does
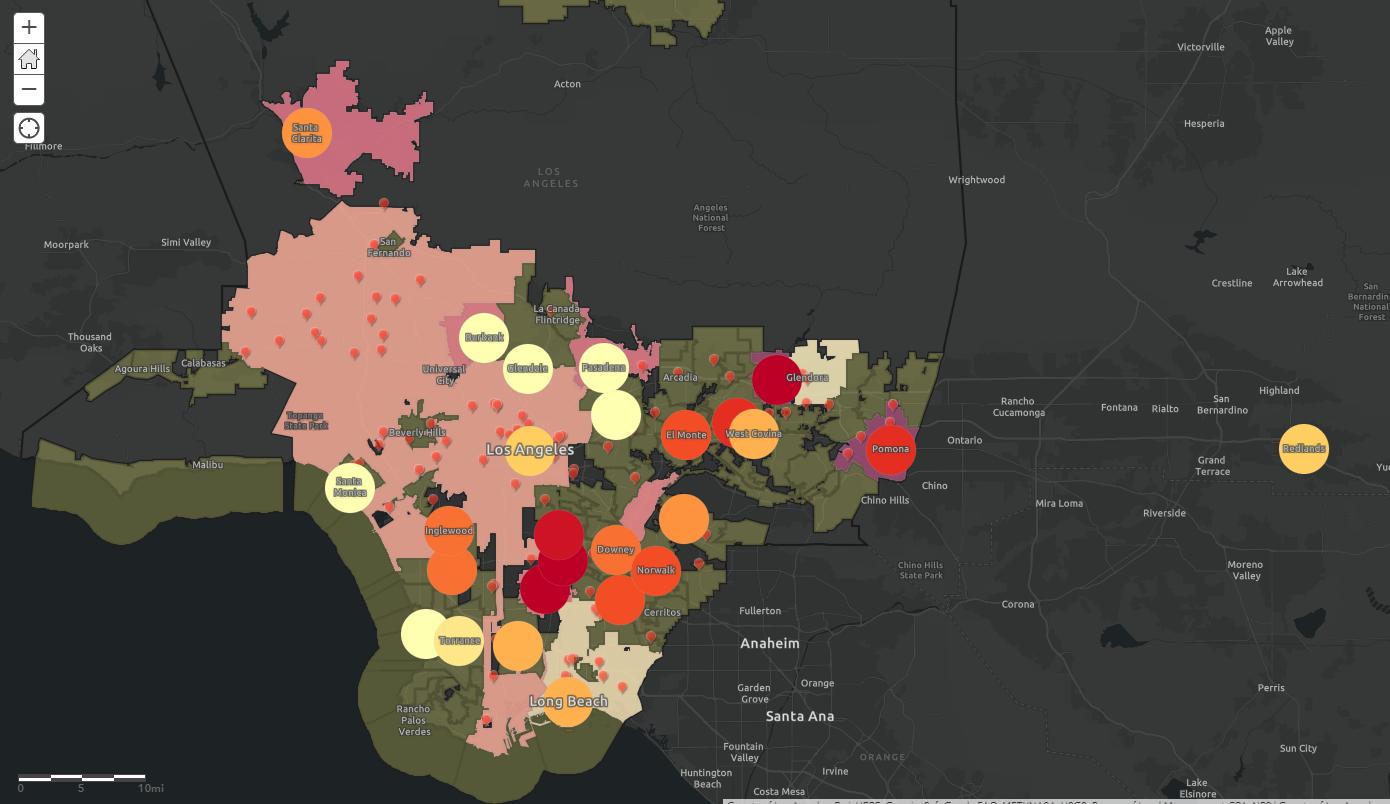
An interactive map that identifies and provides data for high risk air polluted cities along with Asthma diagnoses. Hospital locations are shown per city to show the density and count relative to the air pollution data.
How we built it
Using ArcGIS Online and finding independent data sets.
Challenges we ran into
Incomplete data sets. Building functionality quickly. Researching a field that we are not experts in.
Accomplishments that we're proud of
Complexity of the map and proof of concept of the tool. The problem it attempts to solve.
What we learned
Learned a lot about the ArcGIS platform, a lot about air quality data and the outcomes of different pollutants, as well as how important robust data sets are in creating quality answers and tools.
What's next for Disease Site Finder
Expanding data set and capabilities for any city that has AQI data (toggling between yearly, all-time data, etc.) -- Listing most critical regions using data sets
Using suitability analysis in Business Analyst along with predictive analytics can help health care providers find the best sites for new facilities
Mobile app that tracks and logs your location to determine how long you have been exposed to certain pollutants and how that might affect your health in the long-term
Provides more in-depth data on what regulations are helping to improve local/national air pollution
Notes
Sources: Asthma Data: https://carteehdata.org/library/webapp/trap-asthma-usa AQI Data: https://www.epa.gov/outdoor-air-quality-data/air-data-daily-air-quality-tracker Our GitHub link is code we were working with, but didn't include in the final submission.
Built With
- arcgisonline
- esri
- webappbuilder


Log in or sign up for Devpost to join the conversation.