Inspiration
Having precise air quality predictions is essential with growing emissions and harmful substances being released into the air. Current resources for air quality data typically provide information only for larger regions, with limited availability for smaller, localized areas. That’s why we came up with the idea of predicting NO₂ levels for specific terrain types in small, targeted regions.
What it does
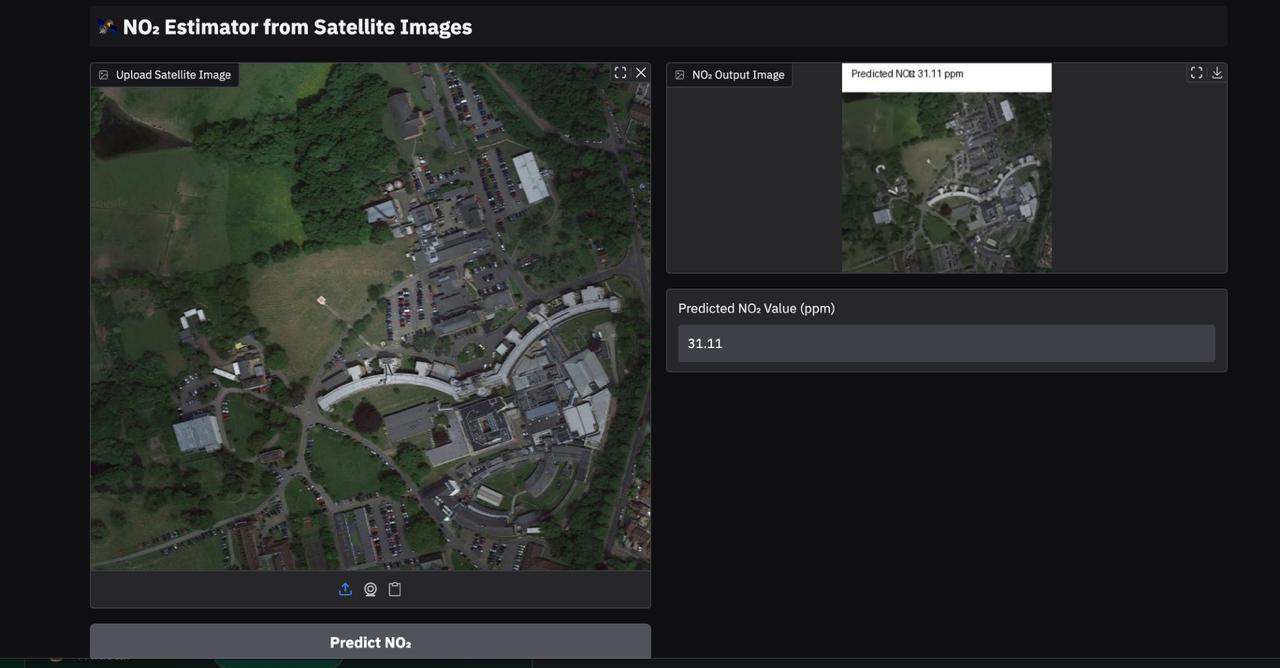
The model takes in an image of a small region and predicts the NO₂ levels of that area in ppm. It is a CNN-based model, trained on several images of various terrains along with their NO₂ values and validated against their corresponding ground data. The model reads the input image and its features to provide an accurate NO₂ level prediction. It gives accurate prediction for 15-56 ppm and with 15 different classes.
How we built it
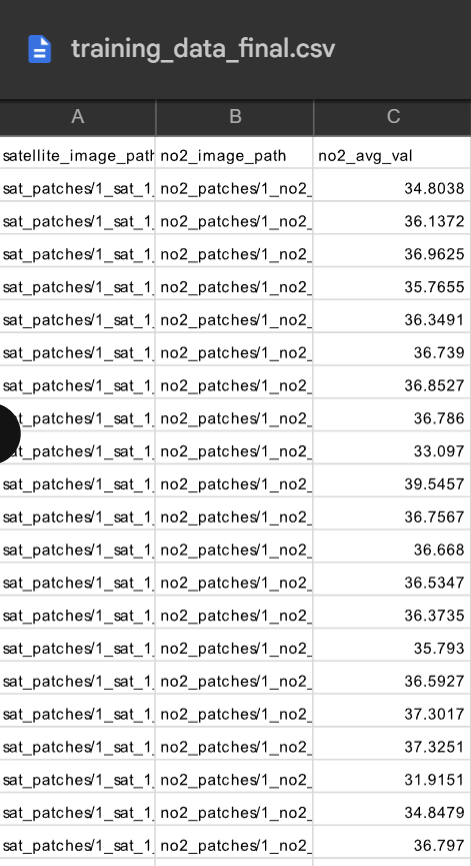
1) Building the dataset - For the initial NO2 values we obtained a 15 class NO2 map for the region of London from official air map available (London air) and the satellite images were accurately mapped using the sentinel 2.0 satellite imaging available at NASA. 2) Splitting images - The London NO2 map geographically ranges between 6 different kinds(around developed areas, roads, forests and various terrains) Since the ranges are limited we decided to split each image obtained into 100 images each (10x10 grid) to generate a more precise value and correspondingly the satellite images were also split to match their NO2 maps. 3) Generating avg NO2 value - From these 500 images generated for each NO2 map we mapped each pixel to the 15 classes available from our London air dataset generated an avg value from the NO2 map. 4) Training - this dataset was split into training and cross validation data set 80:20 ratio. This data was passed through a pretrained VGG model. 5) Testing - A sample image was passed through this model we obtained a 87.6% accuracy for an epoch value set to 20.
Challenges we ran into
The satellite data available for NO₂ values is typically provided as mapped data with a single value for a large region, while the public ground air quality data offers only a number for a specific area, which was still too large for a CNN to capture specific features. The NO2 map was only available for the region of London. Hence categorical NO2 maps were scarce and the model could have been biased towards these region specific features, but the final results worked out properly without any overfitting.
We needed mapped data in the form of small-region images linked to NO₂ values. So, we created the dataset ourselves by dividing images into grids and mapping NO₂ values from a aggregated data set. Finding the right model for this task was challenging, so we explored similar research papers and tested various models before selecting VGG as the best fit.
Accomplishments that we're proud of
Creating the dataset manually was a major challenge—we generated around 500 aggregated samples using a separate script. After testing multiple models, we refined and optimized VGG extensively to ensure accurate predictions, even on cloudy satellite images.
What we learned
We learned to create this new aggregated data set to cater to our model specifically, and selecting VGG for its adaptability to CNN based problems.
What's next for Air Quality (NO2) estimation using CNNs
Extend the model beyond NO₂ to simultaneously predict pollutants like PM₂.₅, O₃, SO₂, and CO using multi-output CNNs, while integrating time-series data (hourly, daily, seasonal) through LSTM-CNN hybrids to capture both spatial and temporal air quality patt


Log in or sign up for Devpost to join the conversation.