-
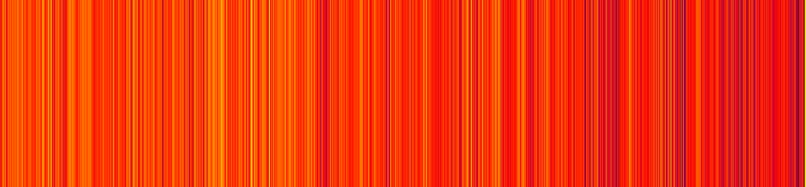
Beijing Air Quality over the years

Inspiration
"When worlds collide" -> we wanted to take 2 opposite things and combine them, art and numbers.
What it does
Transforms data into an art piece, specifically air pollution data
How we built it
Pre-process the data, calculate the Air Quality index, assign colours and create the image
import pandas as pd
import numpy as np
from PIL import Image

# -----------------------
# 1. Load & clean dataset
# -----------------------
df = pd.read_csv("beijing-air-quality.csv")
df.columns = df.columns.str.strip().str.lower()
# Replace missing blank strings with NaN
df = df.replace(r"^\s*$", np.nan, regex=True)

# Convert pollutant columns to numeric
for col in ["pm25", "pm10", "o3", "no2", "so2", "co"]:
    df[col] = pd.to_numeric(df[col], errors="coerce")

# -----------------------
# 2. AQI Breakpoints
# -----------------------
breakpoints = {
    "pm25": [
        (0, 12, 0, 50),
        (12.1, 35.4, 51, 100),
        (35.5, 55.4, 101, 150),
        (55.5, 150.4, 151, 200),
        (150.5, 250.4, 201, 300),
        (250.5, 350.4, 301, 400),
        (350.5, 500.4, 401, 500)
    ],
    "pm10": [
        (0, 54, 0, 50),
        (55, 154, 51, 100),
        (155, 254, 101, 150),
        (255, 354, 151, 200),
        (355, 424, 201, 300),
        (425, 504, 301, 400),
        (505, 604, 401, 500),
    ],
    # You can define: o3, no2, so2, co similarly
}

def compute_individual_aqi(C, species):
    if pd.isna(C):
        return np.nan
    for (Clow, Chigh, Ilow, Ihigh) in breakpoints.get(species, []):
        if Clow <= C <= Chigh:
            return ((Ihigh - Ilow) / (Chigh - Clow)) * (C - Clow) + Ilow
    return np.nan

# -----------------------
# 3. Compute AQI for each pollutant
# -----------------------
for sp in ["pm25", "pm10"]:
    df[f"AQI_{sp}"] = df[sp].apply(lambda x: compute_individual_aqi(x, sp))

# -----------------------
# 4. Final AQI = max of pollutants
# -----------------------
df["AQI"] = df[[col for col in df.columns if col.startswith("AQI_")]].max(axis=1)

# Drop rows with no AQI
df = df.dropna(subset=["AQI"])

# -----------------------
# 5. Turn AQI values into colors
# -----------------------
# def aqi_to_color(aqi):
#     if aqi <= 50: return (0, 255, 0)          # Good (green)
#     if aqi <= 100: return (255, 255, 0)       # Moderate (yellow)
#     if aqi <= 150: return (255, 165, 0)       # Unhealthy SG (orange)
#     if aqi <= 200: return (255, 0, 0)         # Unhealthy (red)
#     if aqi <= 300: return (128, 0, 128)       # Very Unhealthy (purple)
#     return (128, 0, 0)                        # Hazardous (maroon)

def gradient_color(aqi):
    # Clamp between 0 and 500
    aqi = max(0, min(500, aqi))

    # Define control points (aqi, (R,G,B))
    points = [
        (0,   (0, 255, 0)),      # green
        (50,  (255, 255, 0)),    # yellow
        (100, (255, 165, 0)),    # orange
        (150, (255, 80, 0)),     # deep orange
        (200, (255, 0, 0)),      # red
        (300, (128, 0, 128)),    # purple
        (500, (80, 0, 0))        # dark maroon
    ]

    # Find the two control points we’re between
    for i in range(len(points)-1):
        aqi1, c1 = points[i]
        aqi2, c2 = points[i+1]
        if aqi1 <= aqi <= aqi2:
            ratio = (aqi - aqi1) / (aqi2 - aqi1)
            r = int(c1[0] + ratio * (c2[0] - c1[0]))
            g = int(c1[1] + ratio * (c2[1] - c1[1]))
            b = int(c1[2] + ratio * (c2[2] - c1[2]))
            return (r, g, b)

    return (0, 0, 0)  # fallback


colors = df["AQI"].apply(gradient_color).tolist()

# -----------------------
# 6. Build an image
# -----------------------
width = len(colors)
height = 1000

img = Image.new("RGB", (width, height))

for x, color in enumerate(colors):
    for y in range(height):
        img.putpixel((x, y), color)

img.save("aqi_visual.png")
print("Saved image as aqi_visual.png")```


Log in or sign up for Devpost to join the conversation.