AILens
Bringing clarity to AI harm research through a reproducible, fully documented framework built for researchers, regulators, and analysts.
Inspiration
AI is not a future risk. It is a present one.
When we first encountered the AI Incident Database, we saw something rare: a publicly available, editorially reviewed catalogue of 1,365 confirmed real-world AI failures — from fatal autopilot crashes to deepfake scams, from algorithmic discrimination to radicalisation pipelines. The evidence of AI harm, painstakingly collected over years, was sitting in a public repository.
But nobody could use it.
The data arrived as five disconnected CSV files. Deployer names were stored as raw JSON arrays. Dates came in two incompatible formats. Up to 86% of columns in the worst files were empty. The year field — one of the most basic variables for trend analysis — was only filled for 16% of incidents.
We kept thinking: if the evidence exists and still can't be used, what is it actually worth?
That question is what built AILens.
What It Does
AILens is a reproducible research framework that transforms the raw AI Incident Database into a unified, analysis-ready resource. It does three things:
1. Builds the master dataset. AILens merges five raw AIID source files and three independent taxonomies — MIT, GMF, and CSET — into a single master dataset of 1,365 incidents and 45 clean, documented columns. Every incident is included, even the 125 with no taxonomy classification, because real incidents should not be silently dropped.
2. Makes it self-explanatory. The output is a three-sheet Excel workbook. The first sheet is the master dataset, colour-coded by source taxonomy. The second is a full Data Dictionary documenting every column with its source, fill rate, and plain-English description. The third is a Coverage Map that tells any user exactly what analysis is possible given the taxonomy intersections:
| Coverage level | Incidents | Share | What it enables |
|---|---|---|---|
| MIT only | 870 | 63.7% | Risk trends, intent, timing |
| MIT + GMF | 157 | 11.5% | Above + technical failures |
| MIT + GMF + CSET | 168 | 12.3% | Full picture — all three lenses |
| MIT + CSET | 45 | 3.3% | Risk + sector, lives lost |
| No taxonomy | 125 | 9.2% | Identity only |
3. Delivers policy-ready visualisations. Three analytical charts designed for two audiences — researchers and policymakers — rendered directly inside the notebook and exportable as high-resolution images. A Streamlit dashboard makes the same insights available to non-technical users through click-through filters and a Gemini-powered natural language query interface.
How We Built It
Architecture
incidents.csv, classifications_MIT.csv, classifications_GMF.csv, classifications_CSETv1.csv -> AIID_Master_Builder.ipynb -> AIID_Master_Dataset.xlsx
The Eight Steps
Step 1 — Load & Verify All five source files are loaded and validated before any transformation begins. If a file is missing, the notebook halts and identifies exactly which file is absent.
Step 2 — Clean Incidents Three core transformations:
- Duplicate removal using
duplicates.csv - Report count extraction: the
reportscolumn stores a JSON list of report IDs. We parse this to produce a scalarreport_countvariable - Deployer/developer/harmed fields converted from
["youtube"]slug format to readable strings
Step 3 — Clean MIT
Minimal transformation. The primary change is stripping numeric prefixes from domain labels so that "1. Discrimination and Toxicity" becomes "Discrimination and Toxicity" — necessary for consistent chart labelling.
Step 4 — Clean GMF The GMF file arrives with 21 columns. We retain 4 (incident ID + 3 confirmed classification columns) and drop 17:
- 3 raw article snippet columns
- 3 annotator discussion columns
- 11 speculative
Potentialclassification columns (median fill rate < 1%)
Step 5 — Clean CSET The largest cleanup. CSET arrives with 65 columns. We drop 28:
- 8 workflow admin columns (Annotator, Peer Reviewer, Annotation Status, Quality Control)
- 7 free-text Notes columns
- 4 columns with fill rate < 25%
- 9 duplicate or derivable columns
Retained columns: 37
Step 6 — Build Master Four left joins, with incidents as the spine:
Master = Incidents LEFT JOIN MIT LEFT JOIN GMF LEFT JOIN CSET
The left join guarantees that all 1,365 incidents are preserved regardless of taxonomy coverage. A new derived column Data Sources flags which taxonomies classify each row.
Step 7 — Validate
| Check | Threshold |
|---|---|
| Row count | ≥ 1,300 |
| Duplicate incident IDs | 0 |
| Core column fill rate | 100% |
| MIT coverage | ≥ 85% |
| Year range | 1979 ≤ year ≤ 2026 |
| No row explosion from joins | 1,365 rows |
| Data Sources column populated | 100% |
If any check fails, the notebook halts with a descriptive error before producing output.
Step 8 — Export A three-sheet Excel workbook:
- Master Dataset — 1,365 rows × 45 columns, colour-coded by source taxonomy
- Data Dictionary — all 45 columns documented with source, fill rate, description, and caveats
- Coverage Map — what analysis is possible at each level of taxonomy intersection
Visualisations
Visualisation 1 — Intent × Responsibility Matrix
Every MIT-classified incident mapped across two axes:
- X-axis: Intent (Intentional / Unintentional)
- Y-axis: Responsible Entity (AI / Human)
Quadrant distribution:
- Unintentional AI: 49%
- Intentional Human: 29%
- Intentional AI: 18%
- Unintentional Human: 4%
Visualisation 2 — The Accountability Gap
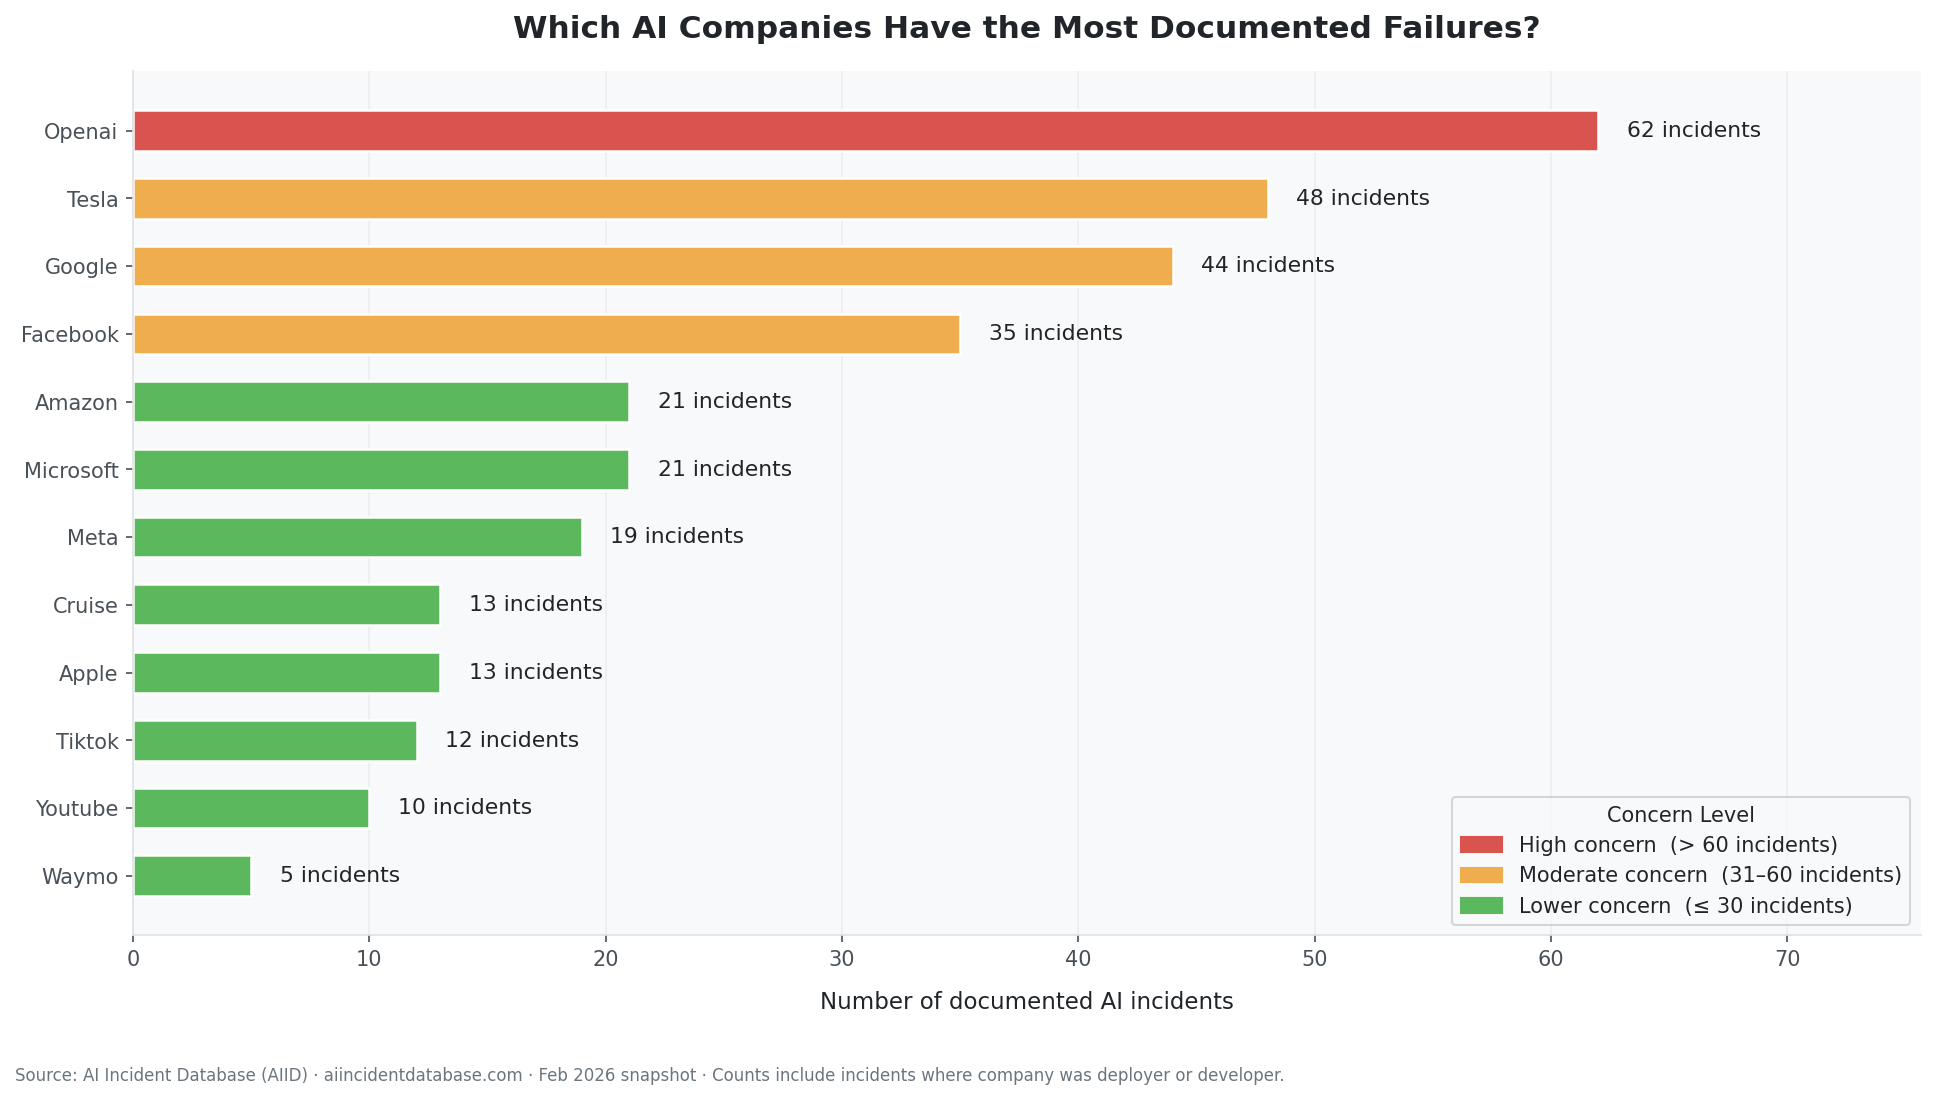
Stacked area chart tracking the ratio of anonymous to identifiable deployers from 2015 to 2025, alongside a ranked bar chart of the top 12 deployers.
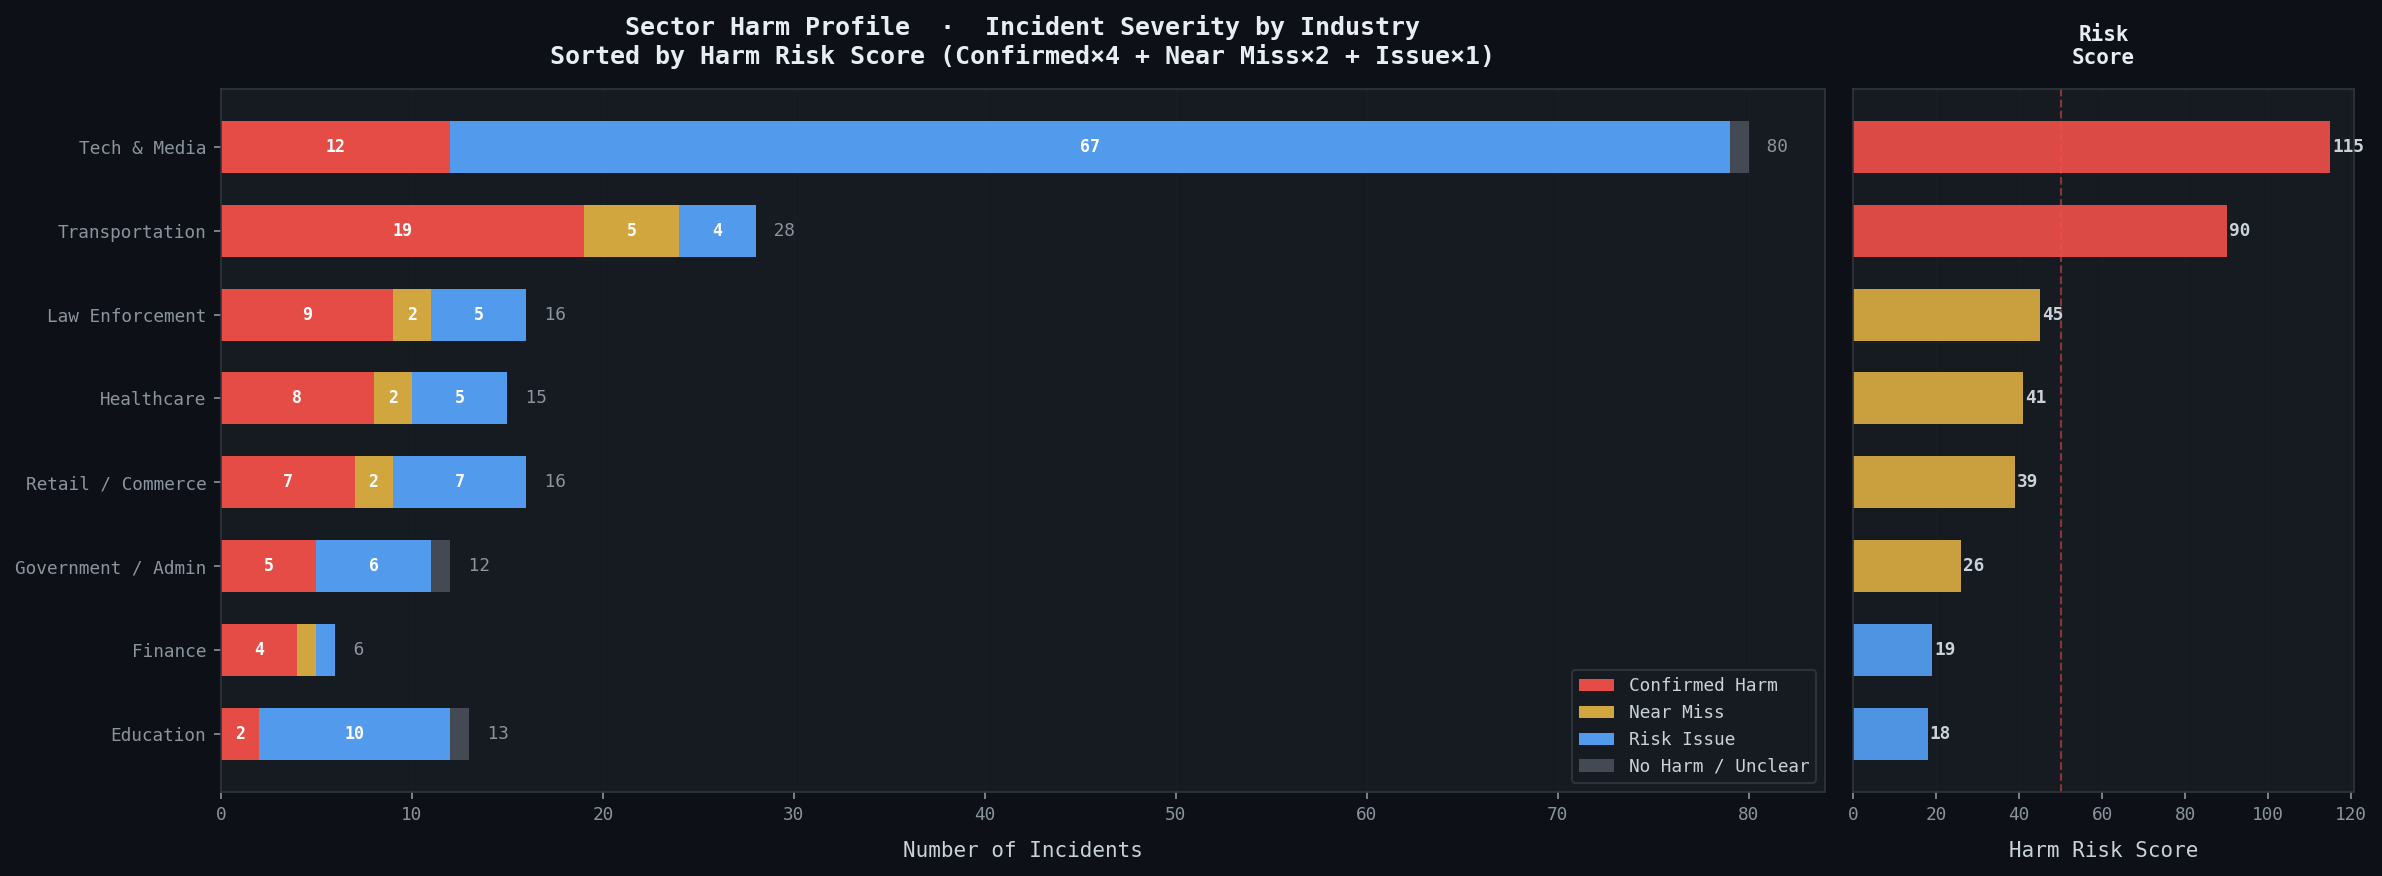
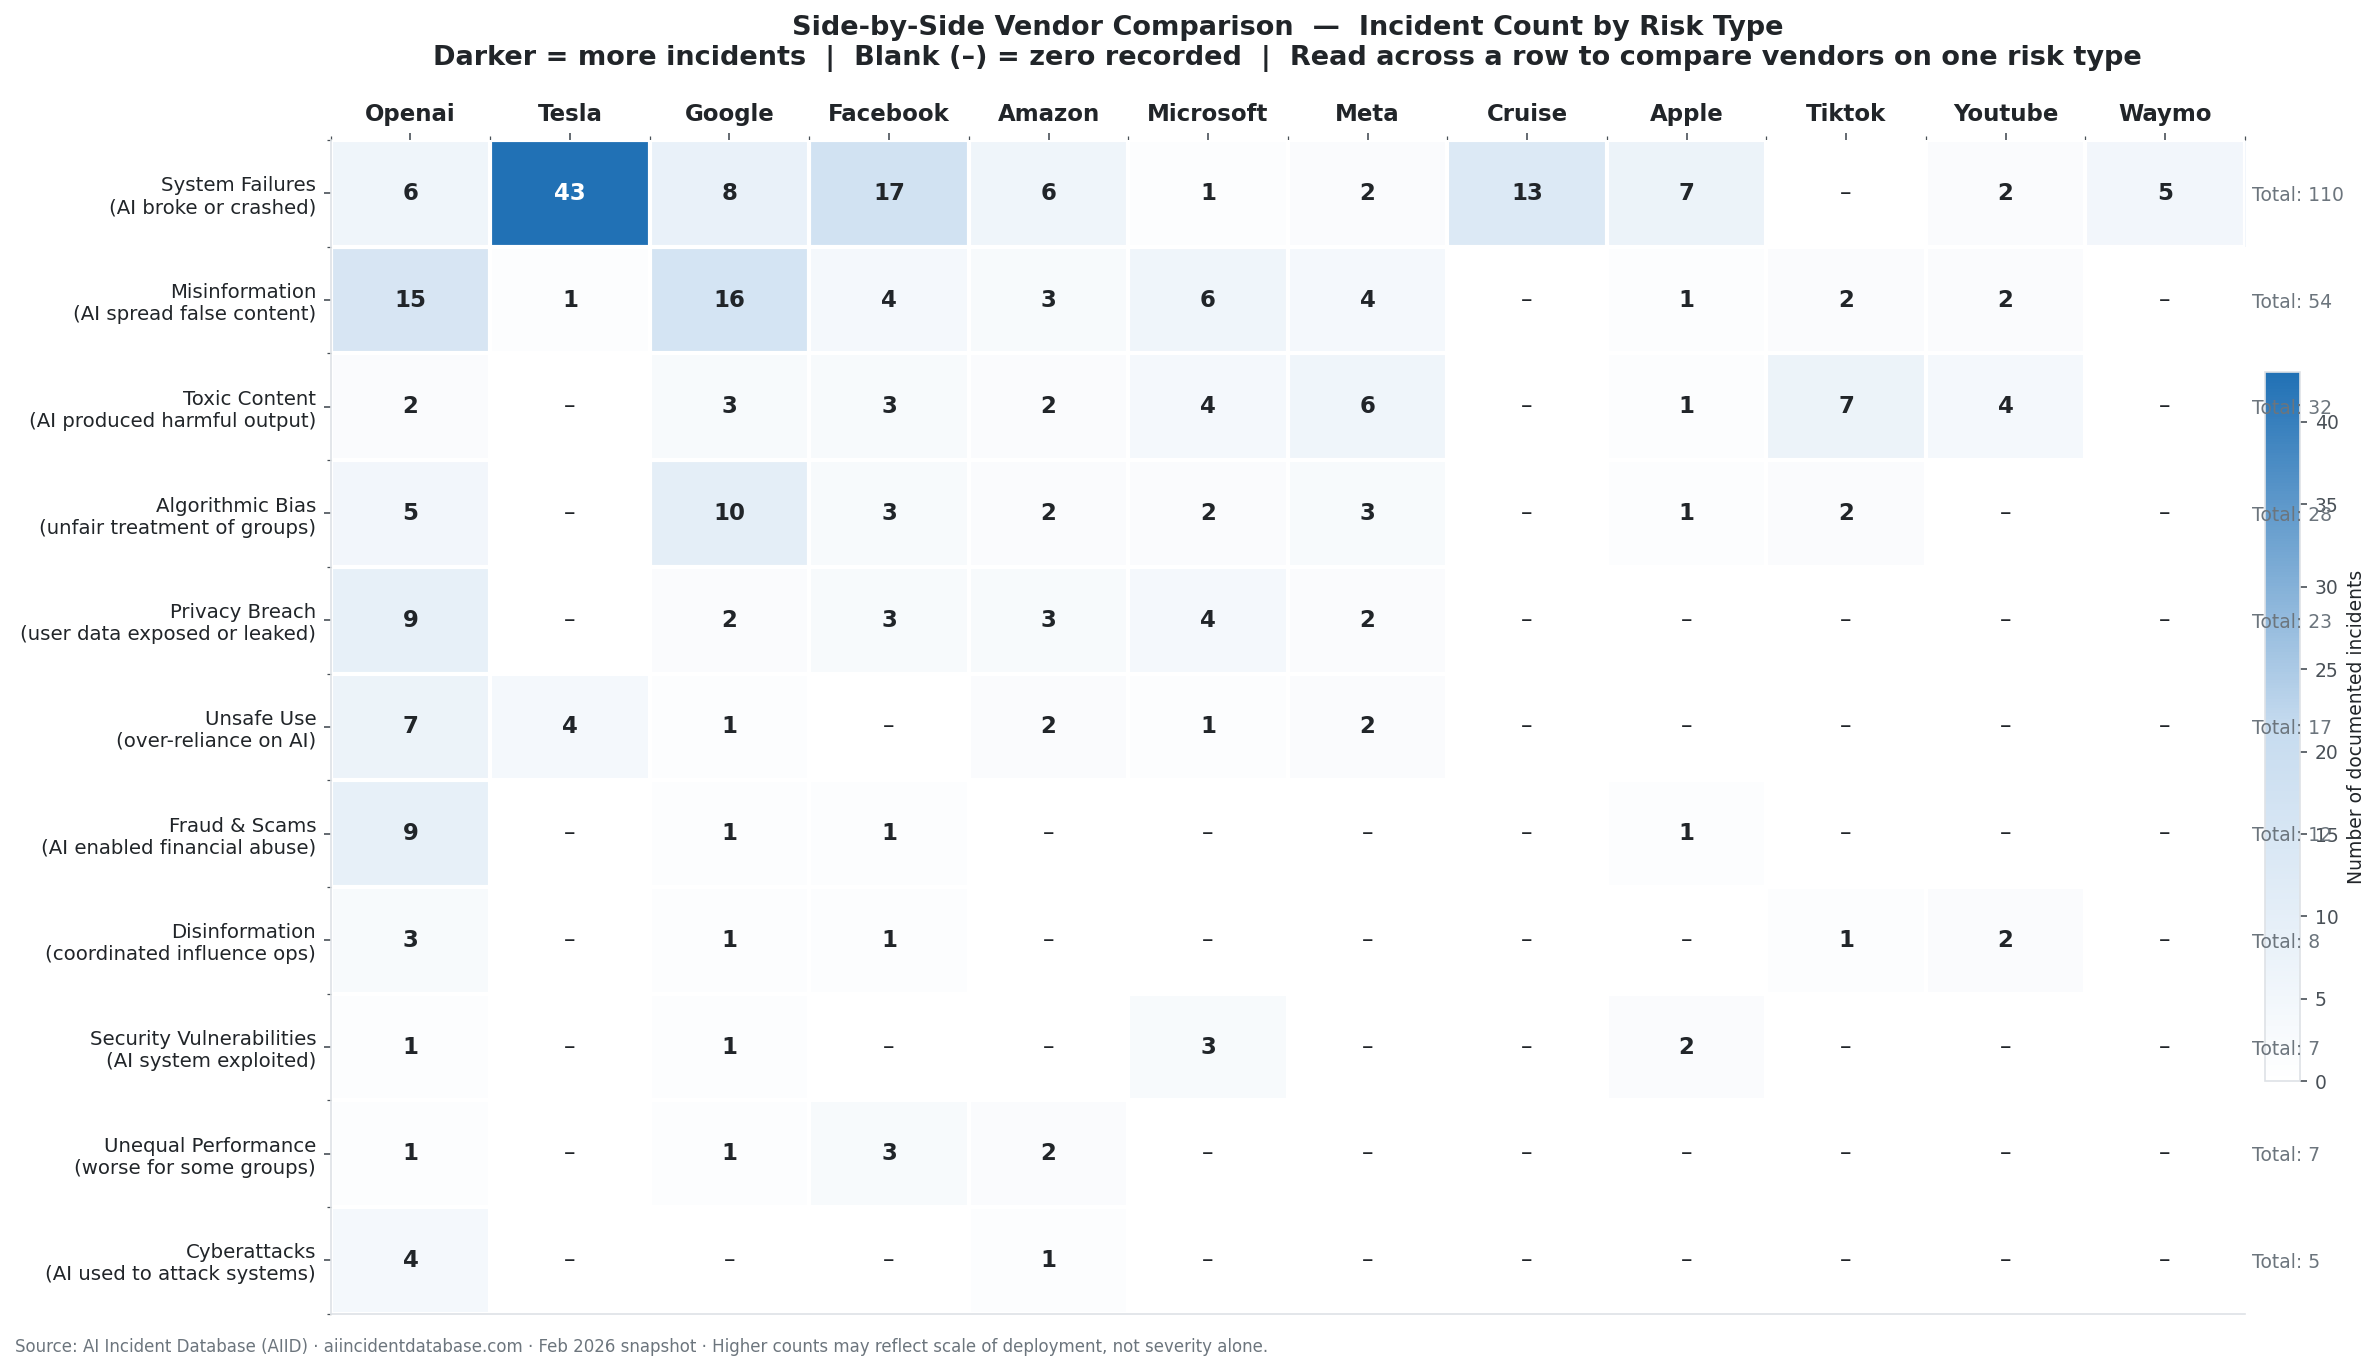
Visualisation 3 — Failure Mode Landscape
A dot matrix crossing the top 10 confirmed technical failure modes against the 5 most common risk domains, revealing domain-specific versus domain-agnostic failures.
Streamlit Dashboard
For non-technical users, we built a Streamlit web application that reads directly from the master dataset. It provides click-through filters, live chart updates, and a Gemini-powered natural language query interface — allowing policymakers to ask questions about the data in plain English without writing code.
Challenges We Ran Into
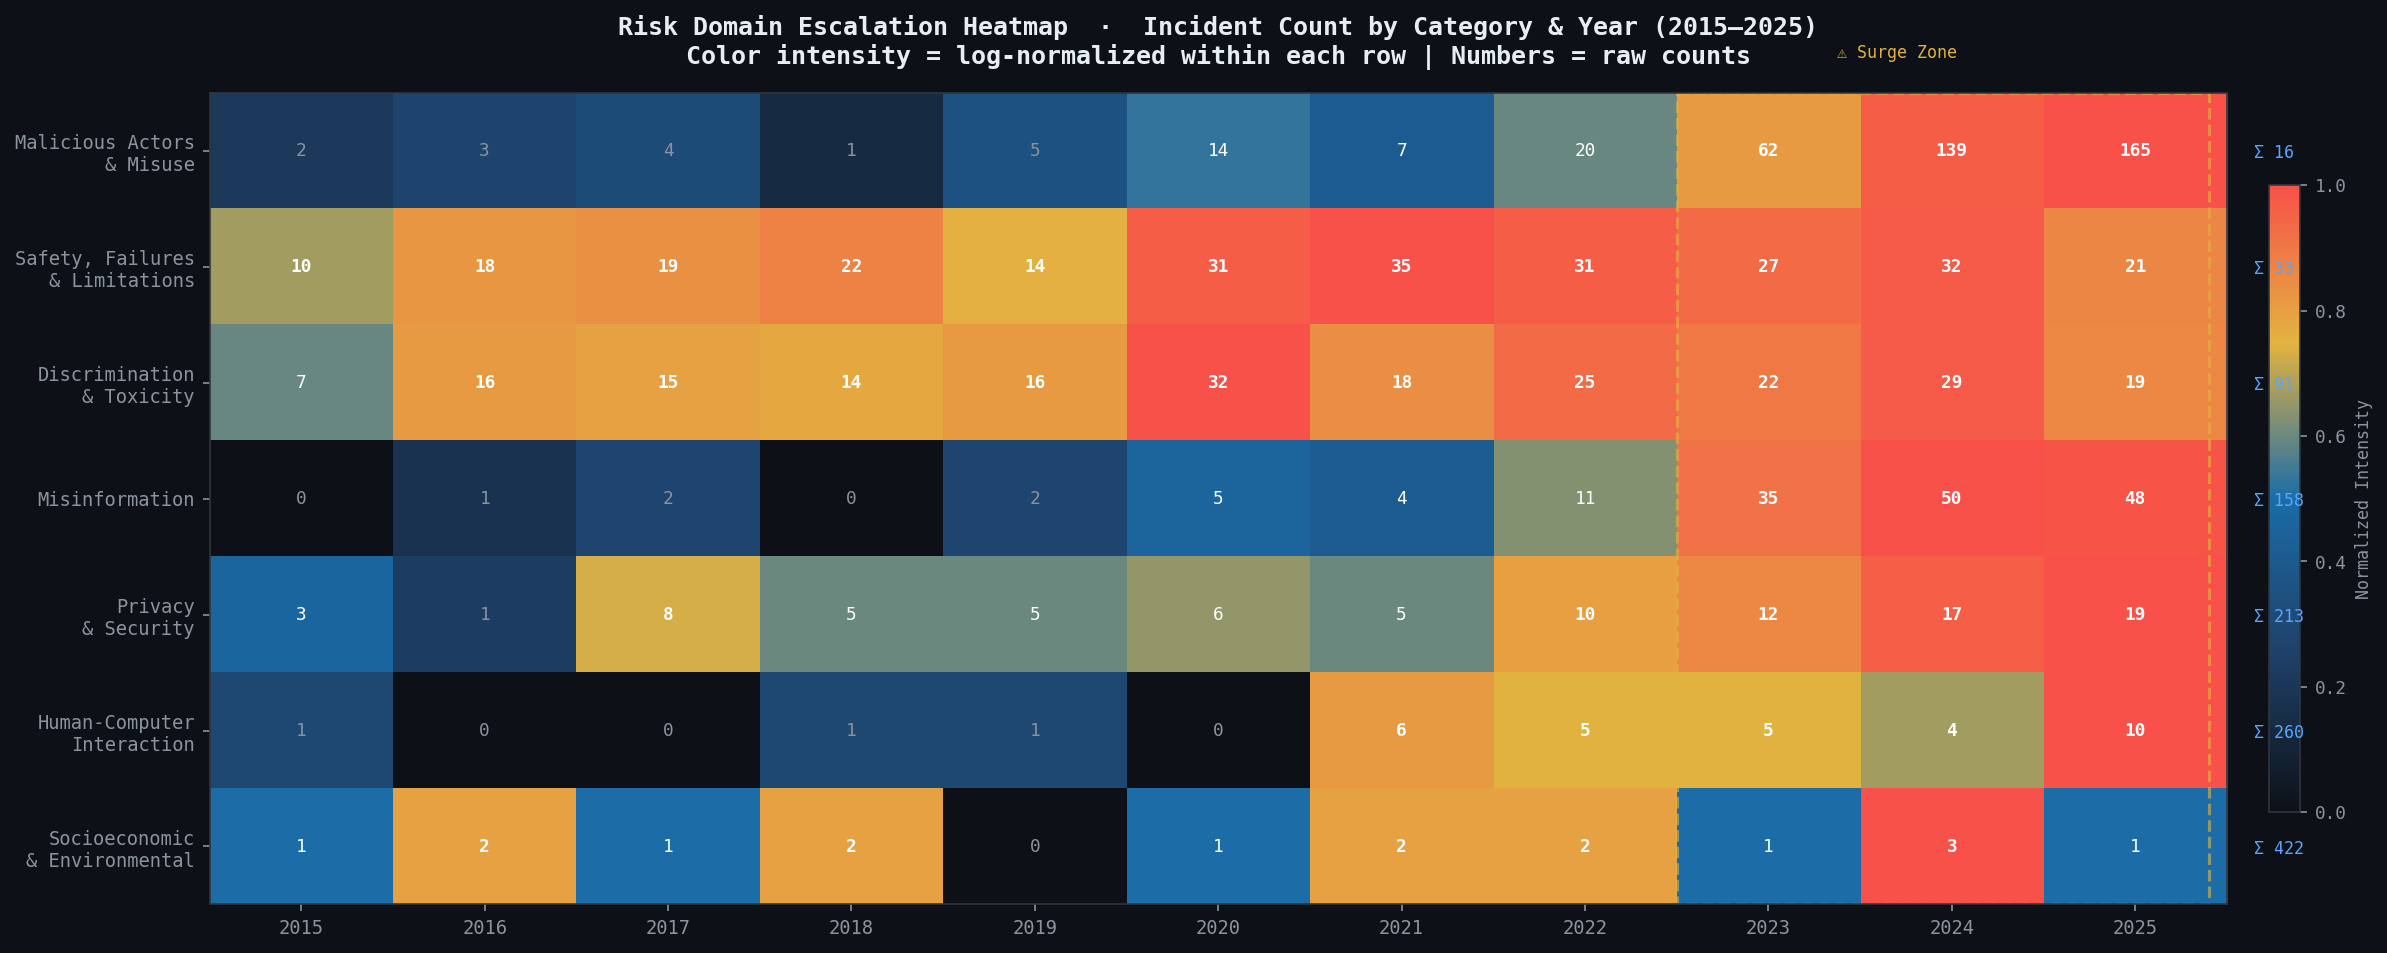
1. The year problem
The AIID distributes year data through the CSET taxonomy — which covers only 16% of incidents.
Our solution was to derive year from the date field in incidents.csv, giving 100% year coverage and extending the temporal range from 1979 to 2026.
2. The join strategy
A naive outer join produces severe null inflation. The left join with incidents as spine ensures missing values reflect real taxonomy coverage, not join artefacts.
3. The GMF draft problem
87% of GMF classifications carry Published = False. Draft rows had higher fill rates than published rows. We retained all GMF data and added explicit caveats.
4. Defining reproducibility
Given the original CSV files and notebook, any researcher should reproduce the same dataset row-for-row and column-for-column. Every dropped column and threshold is documented.
5. Communicating uncertainty
We added a Limitations section, visualisation caveats, and a Coverage Map to ensure honest interpretation.
Accomplishments That We're Proud Of
- Included all incidents, including 125 unclassified ones
- Identified anonymous actors as a major governance finding (~25% of incidents)
- Achieved full year coverage
- Built a self-explaining dataset
- Delivered an interactive dashboard
What We Learned
The data is multi-purpose
Different taxonomies answer different questions:
| Taxonomy | Organisation | Core question | Coverage |
|---|---|---|---|
| MIT AI Risk Repository | MIT | What type of risk was this? | 91% |
| Goals, Methods & Failures | GMF | What technically went wrong? | 24% |
| CSET AI Harm Taxonomy | Georgetown CSET | What were the real-world consequences? | 16% |
Intersection across all three: 168 incidents (12.3%)
Sparsity itself is a finding.
Different harms need different policy tools
| Harm Type | Policy Need |
|---|---|
| Unintentional AI failure | Auditing standards |
| Deliberate human misuse | Enforcement |
| Intentional AI action | Prohibition |
| Unintentional human error | Training |
Responsible research means documenting limits
The Coverage Map enables honest analysis rather than hiding limitations.
What's Next for AILens
- Automated snapshot ingestion
- Expanded dashboard filters and comparisons
- Schema bridge to AIAAIC
- Open-source Python package (
pip install ailens) - Longitudinal tracking of AI harm trends
AILens — bringing clarity to AI harm research through a reproducible, fully documented framework built for researchers, regulators, and analysts.
Built with: Python · Pandas · Matplotlib · Jupyter · Streamlit · openpyxl Data source: https://incidentdatabase.ai Snapshot date: February 2026

Log in or sign up for Devpost to join the conversation.