Anomaly Detection with Logistic Regression
Our notebook 1_Logistic_Regression.ipynb is available in Google Colab.
![]()
Summary
To classify the anomalies in the data, we split the data into chunks consisting of 10 time steps, i.e. 90 minutes. This is time window is much longer than thermal and mechanical processes. Hence, the data within this time frame should be sufficient to explain why and how the anomaly arised.
A chunk of data belongs to the anomaly class if an anomaly happens at its end. The challenge is that there only 9 anomalies. However, avoiding them is very beneficial. Therefore, we could risk some false positives if we can find them.
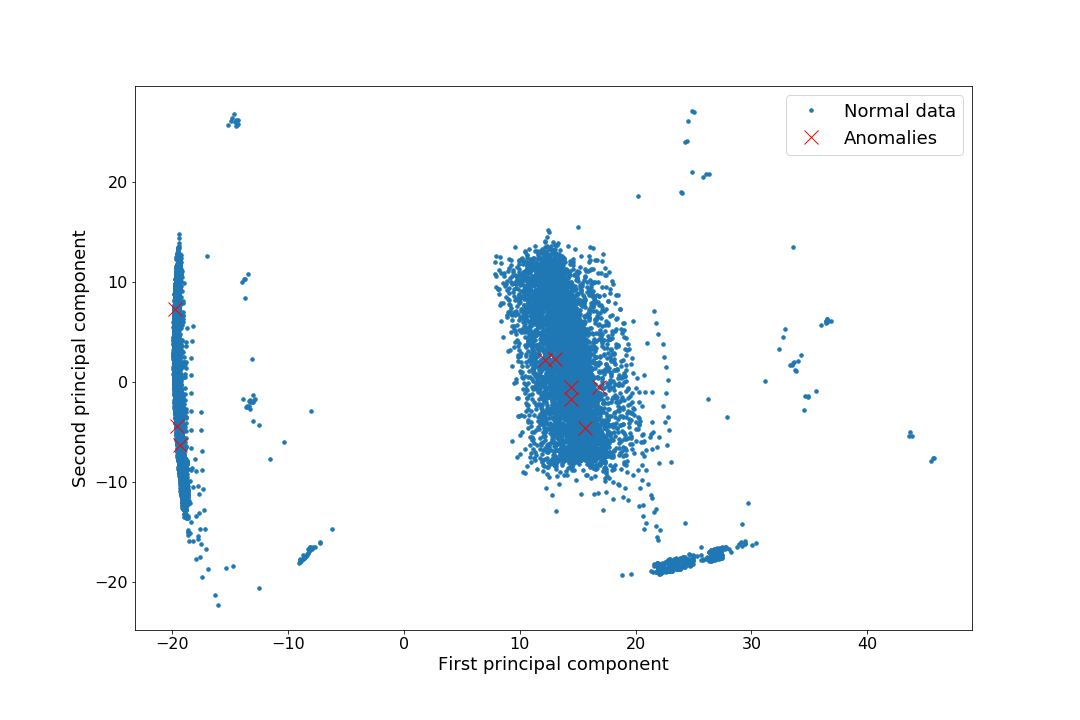
First, we did a principal component analysis on the data. The anomalies clearly cluster within two regions.

Since the problem is obviously not linearly separable, we use the set of Radial Basis Functions to generate features for logistic regression.
Thereby, we are able to identify 5 out of 9 anomalies at a false positive rate of only 8.4%.
Built With
- jupyter-notebook
- python

Log in or sign up for Devpost to join the conversation.