-
-
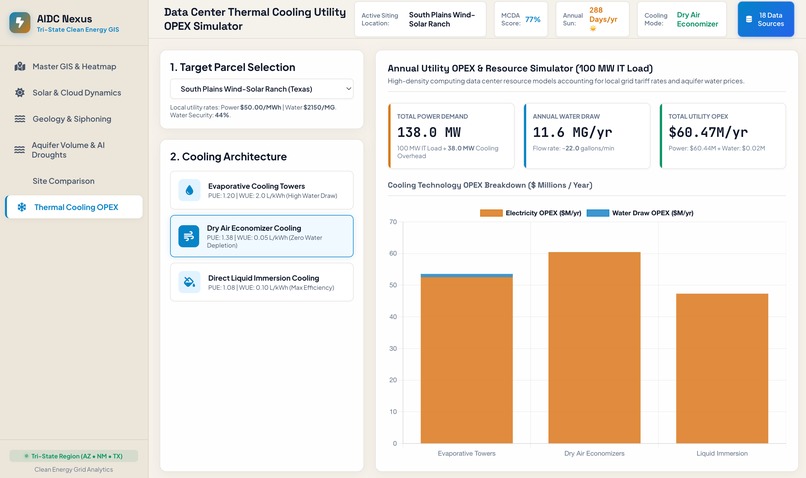
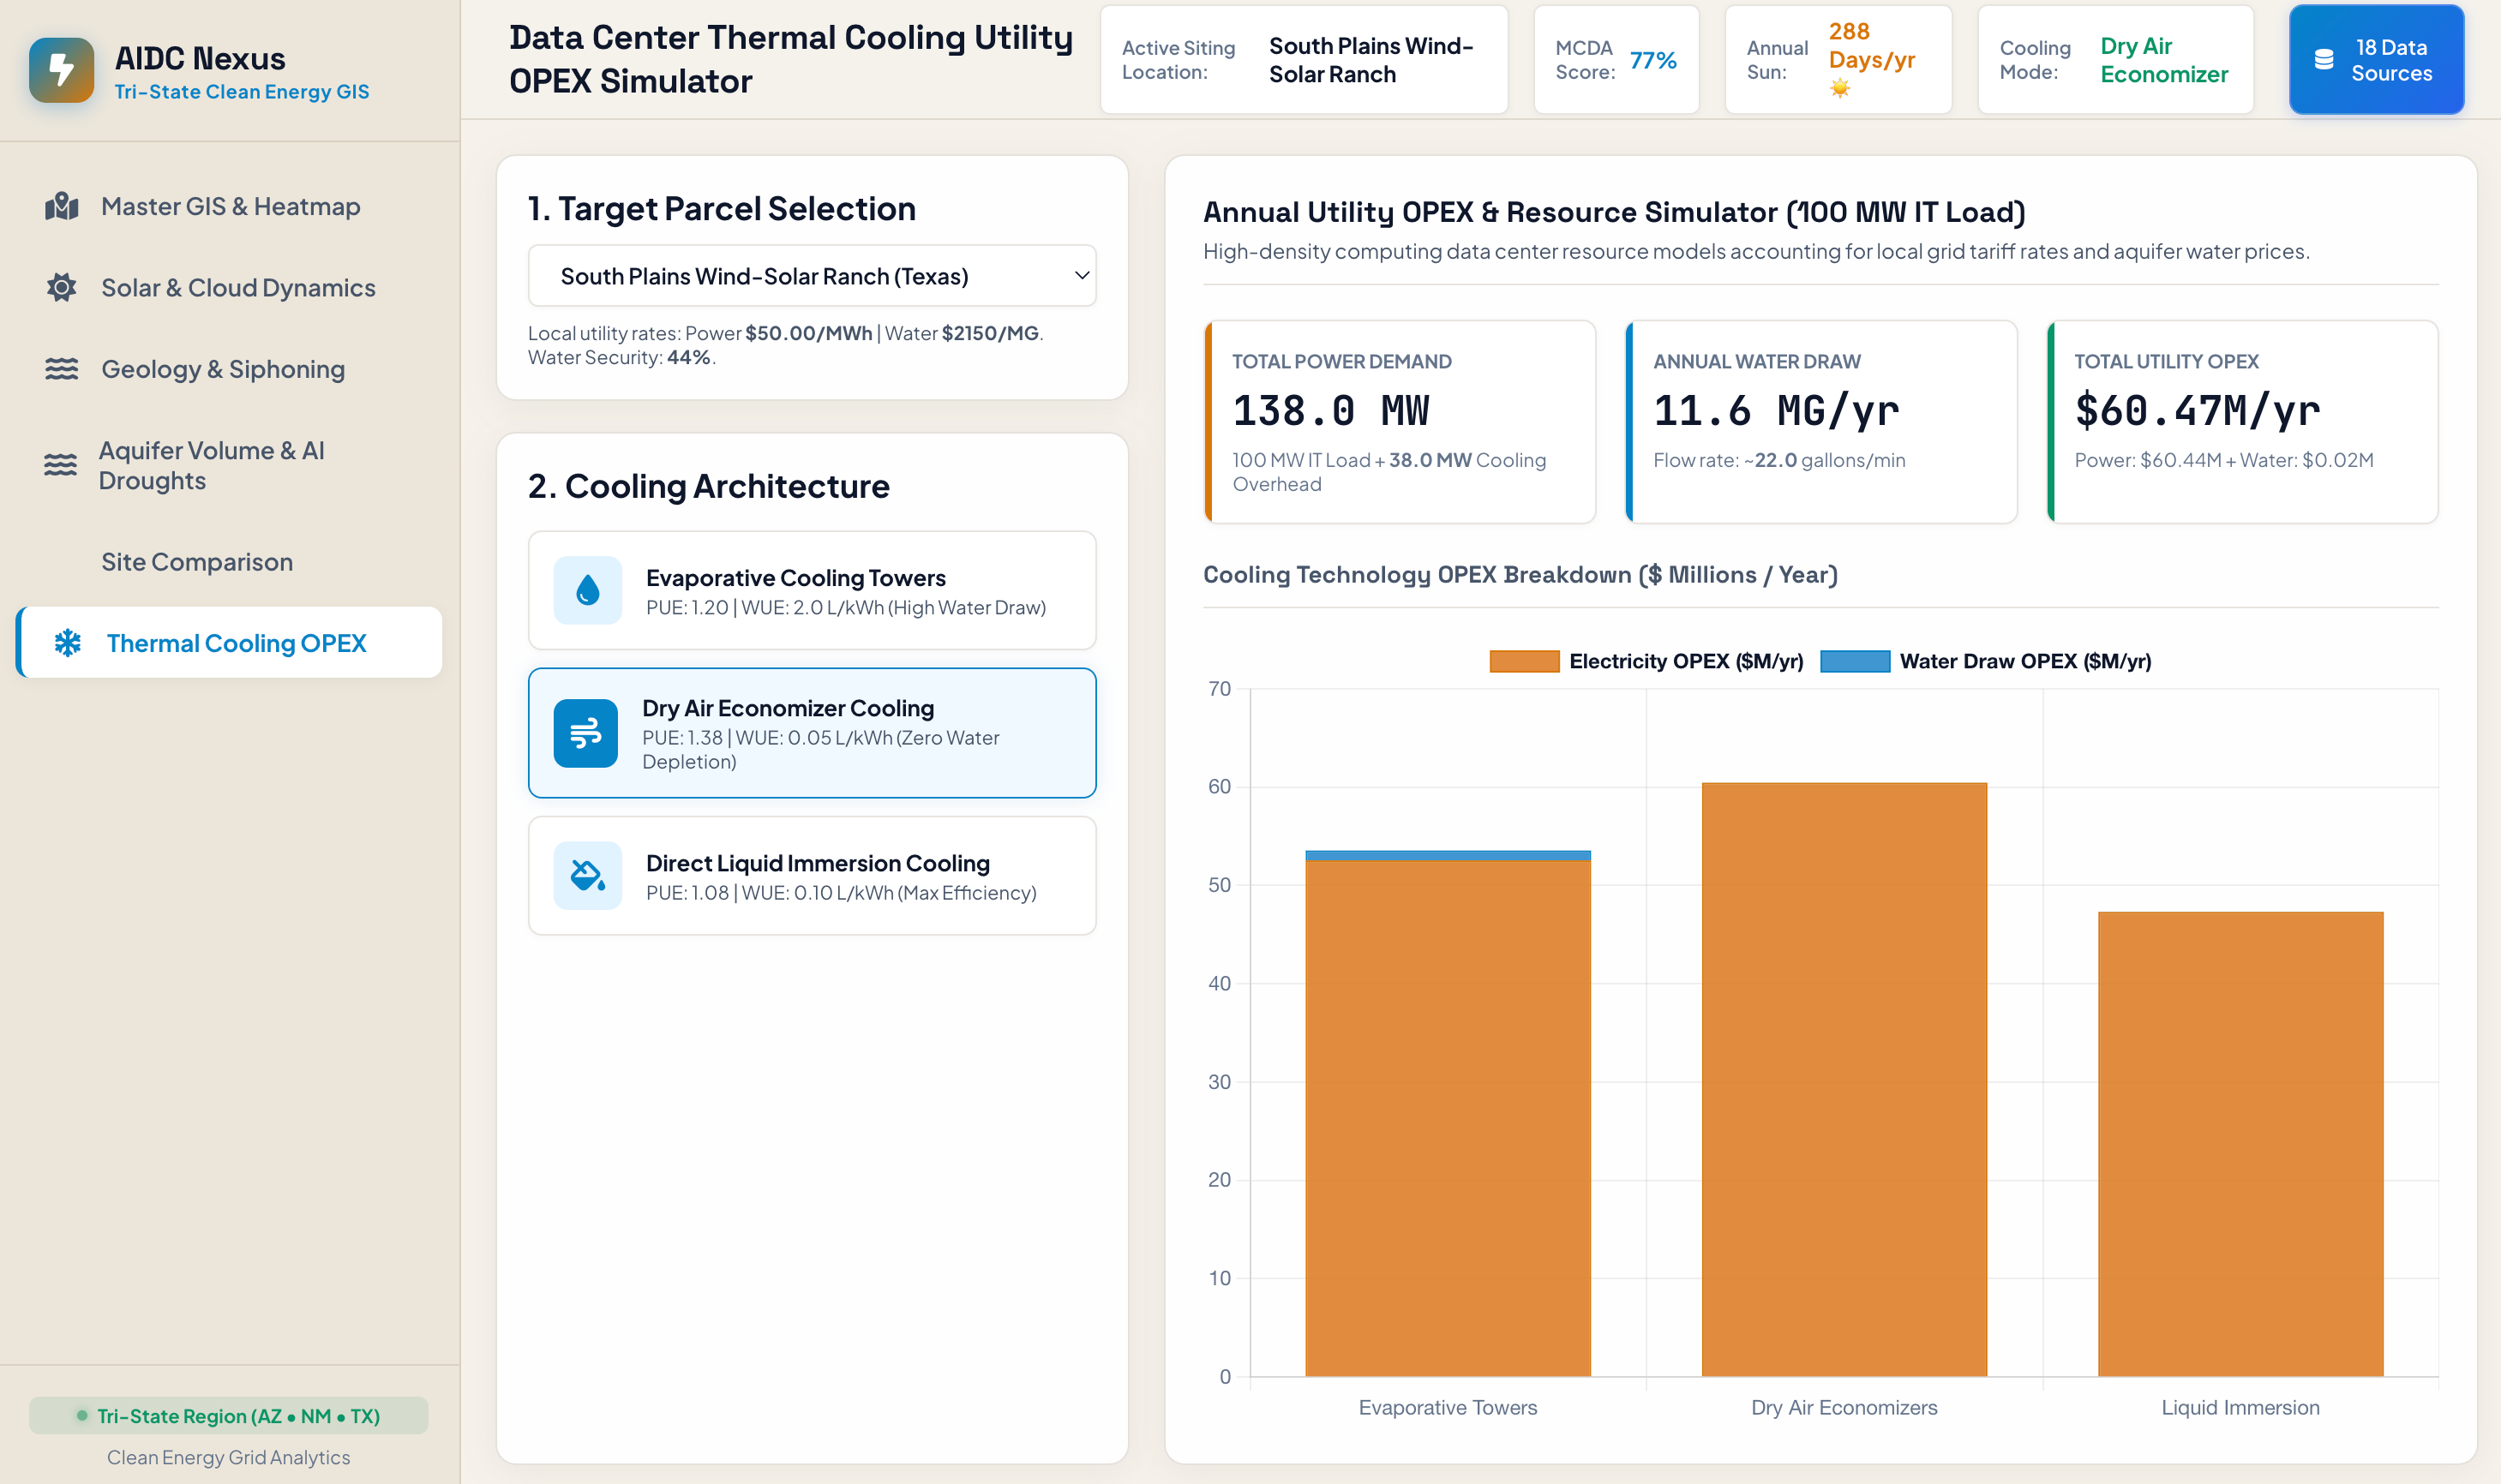
Data Center Thermal Cooling Utility OPEX Simulator
-
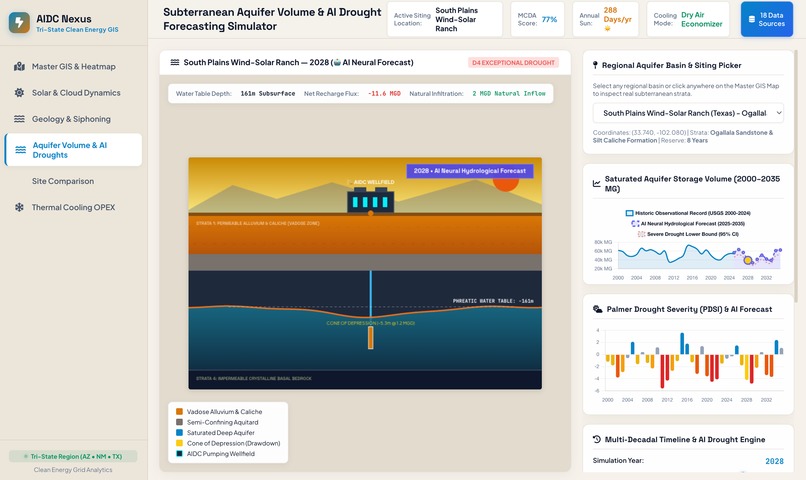
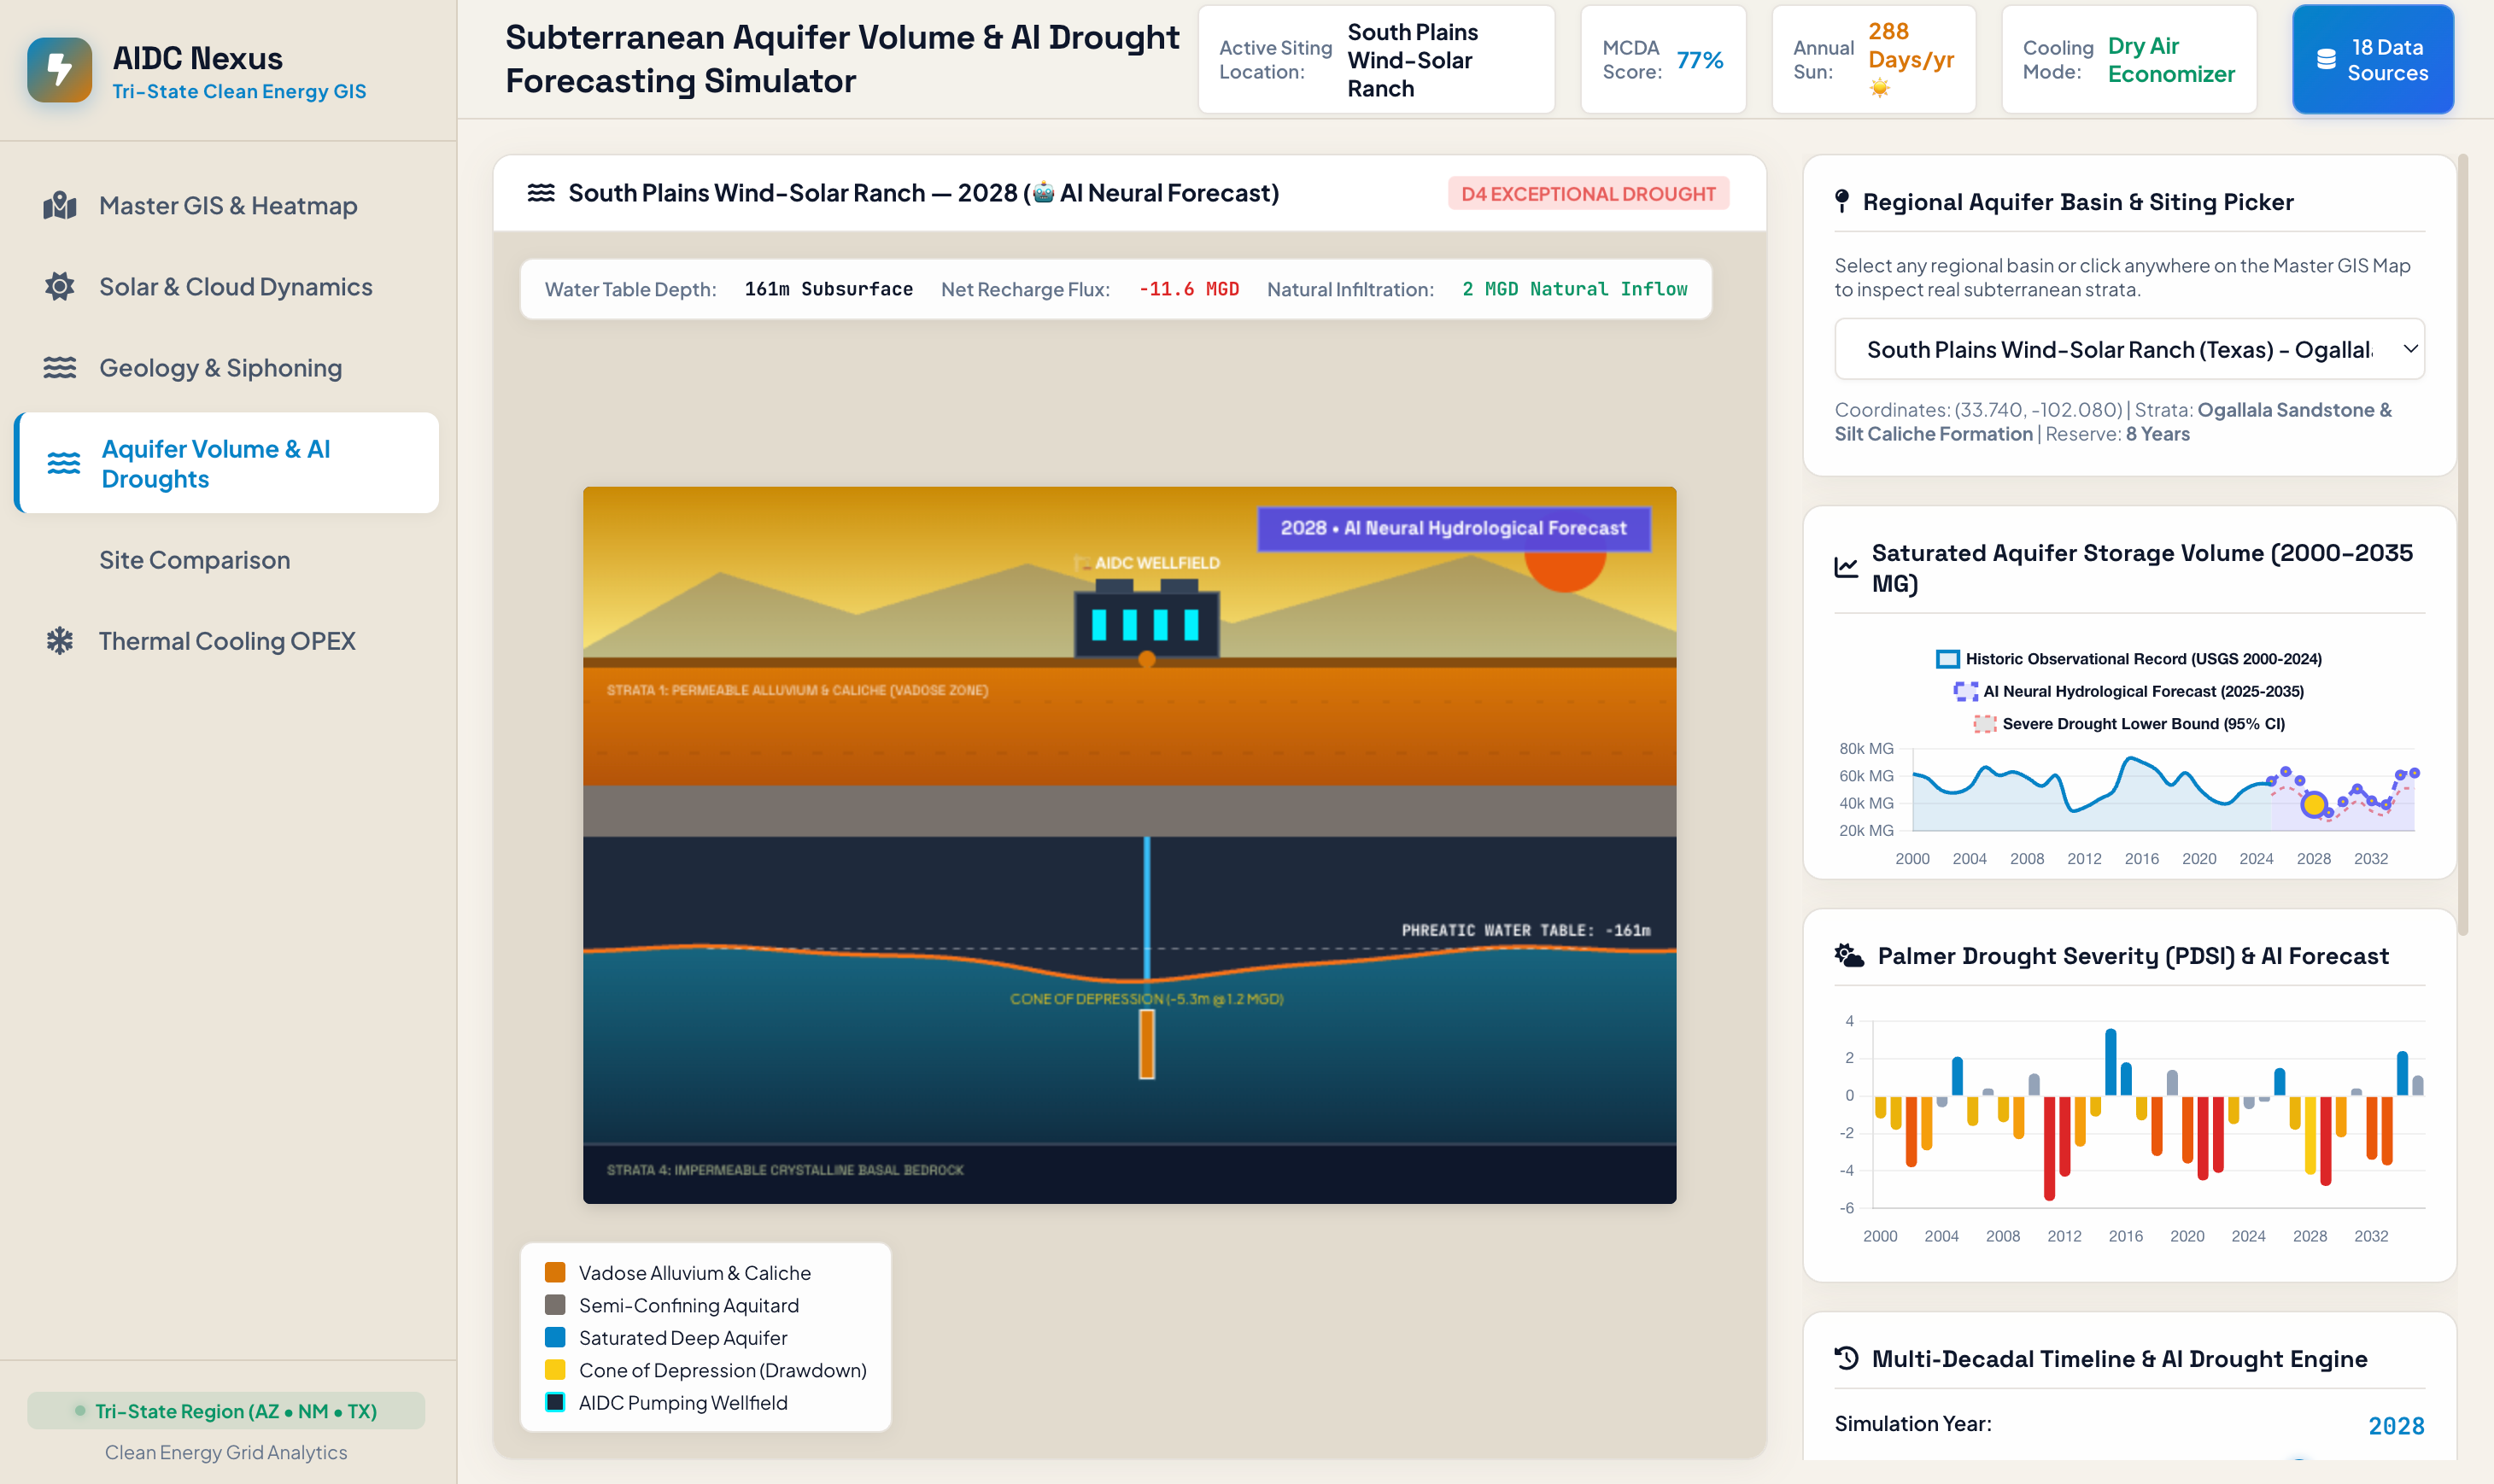
Subterranean Aquifer Volume & AI Drought Forecasting Simulator
-
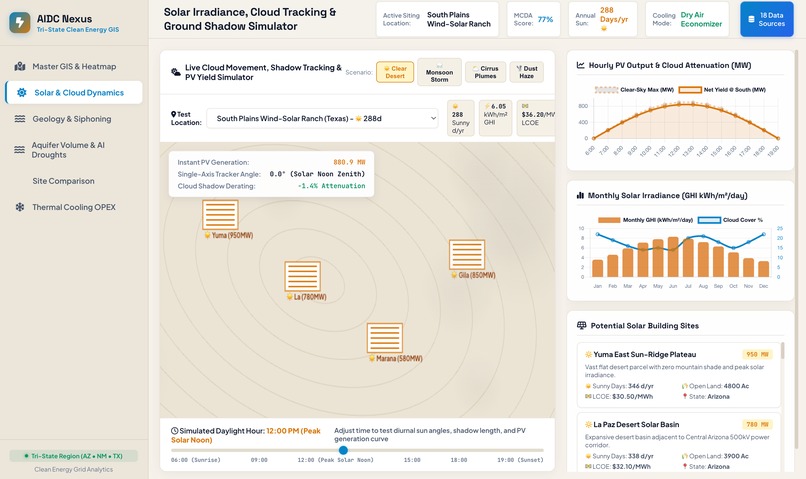
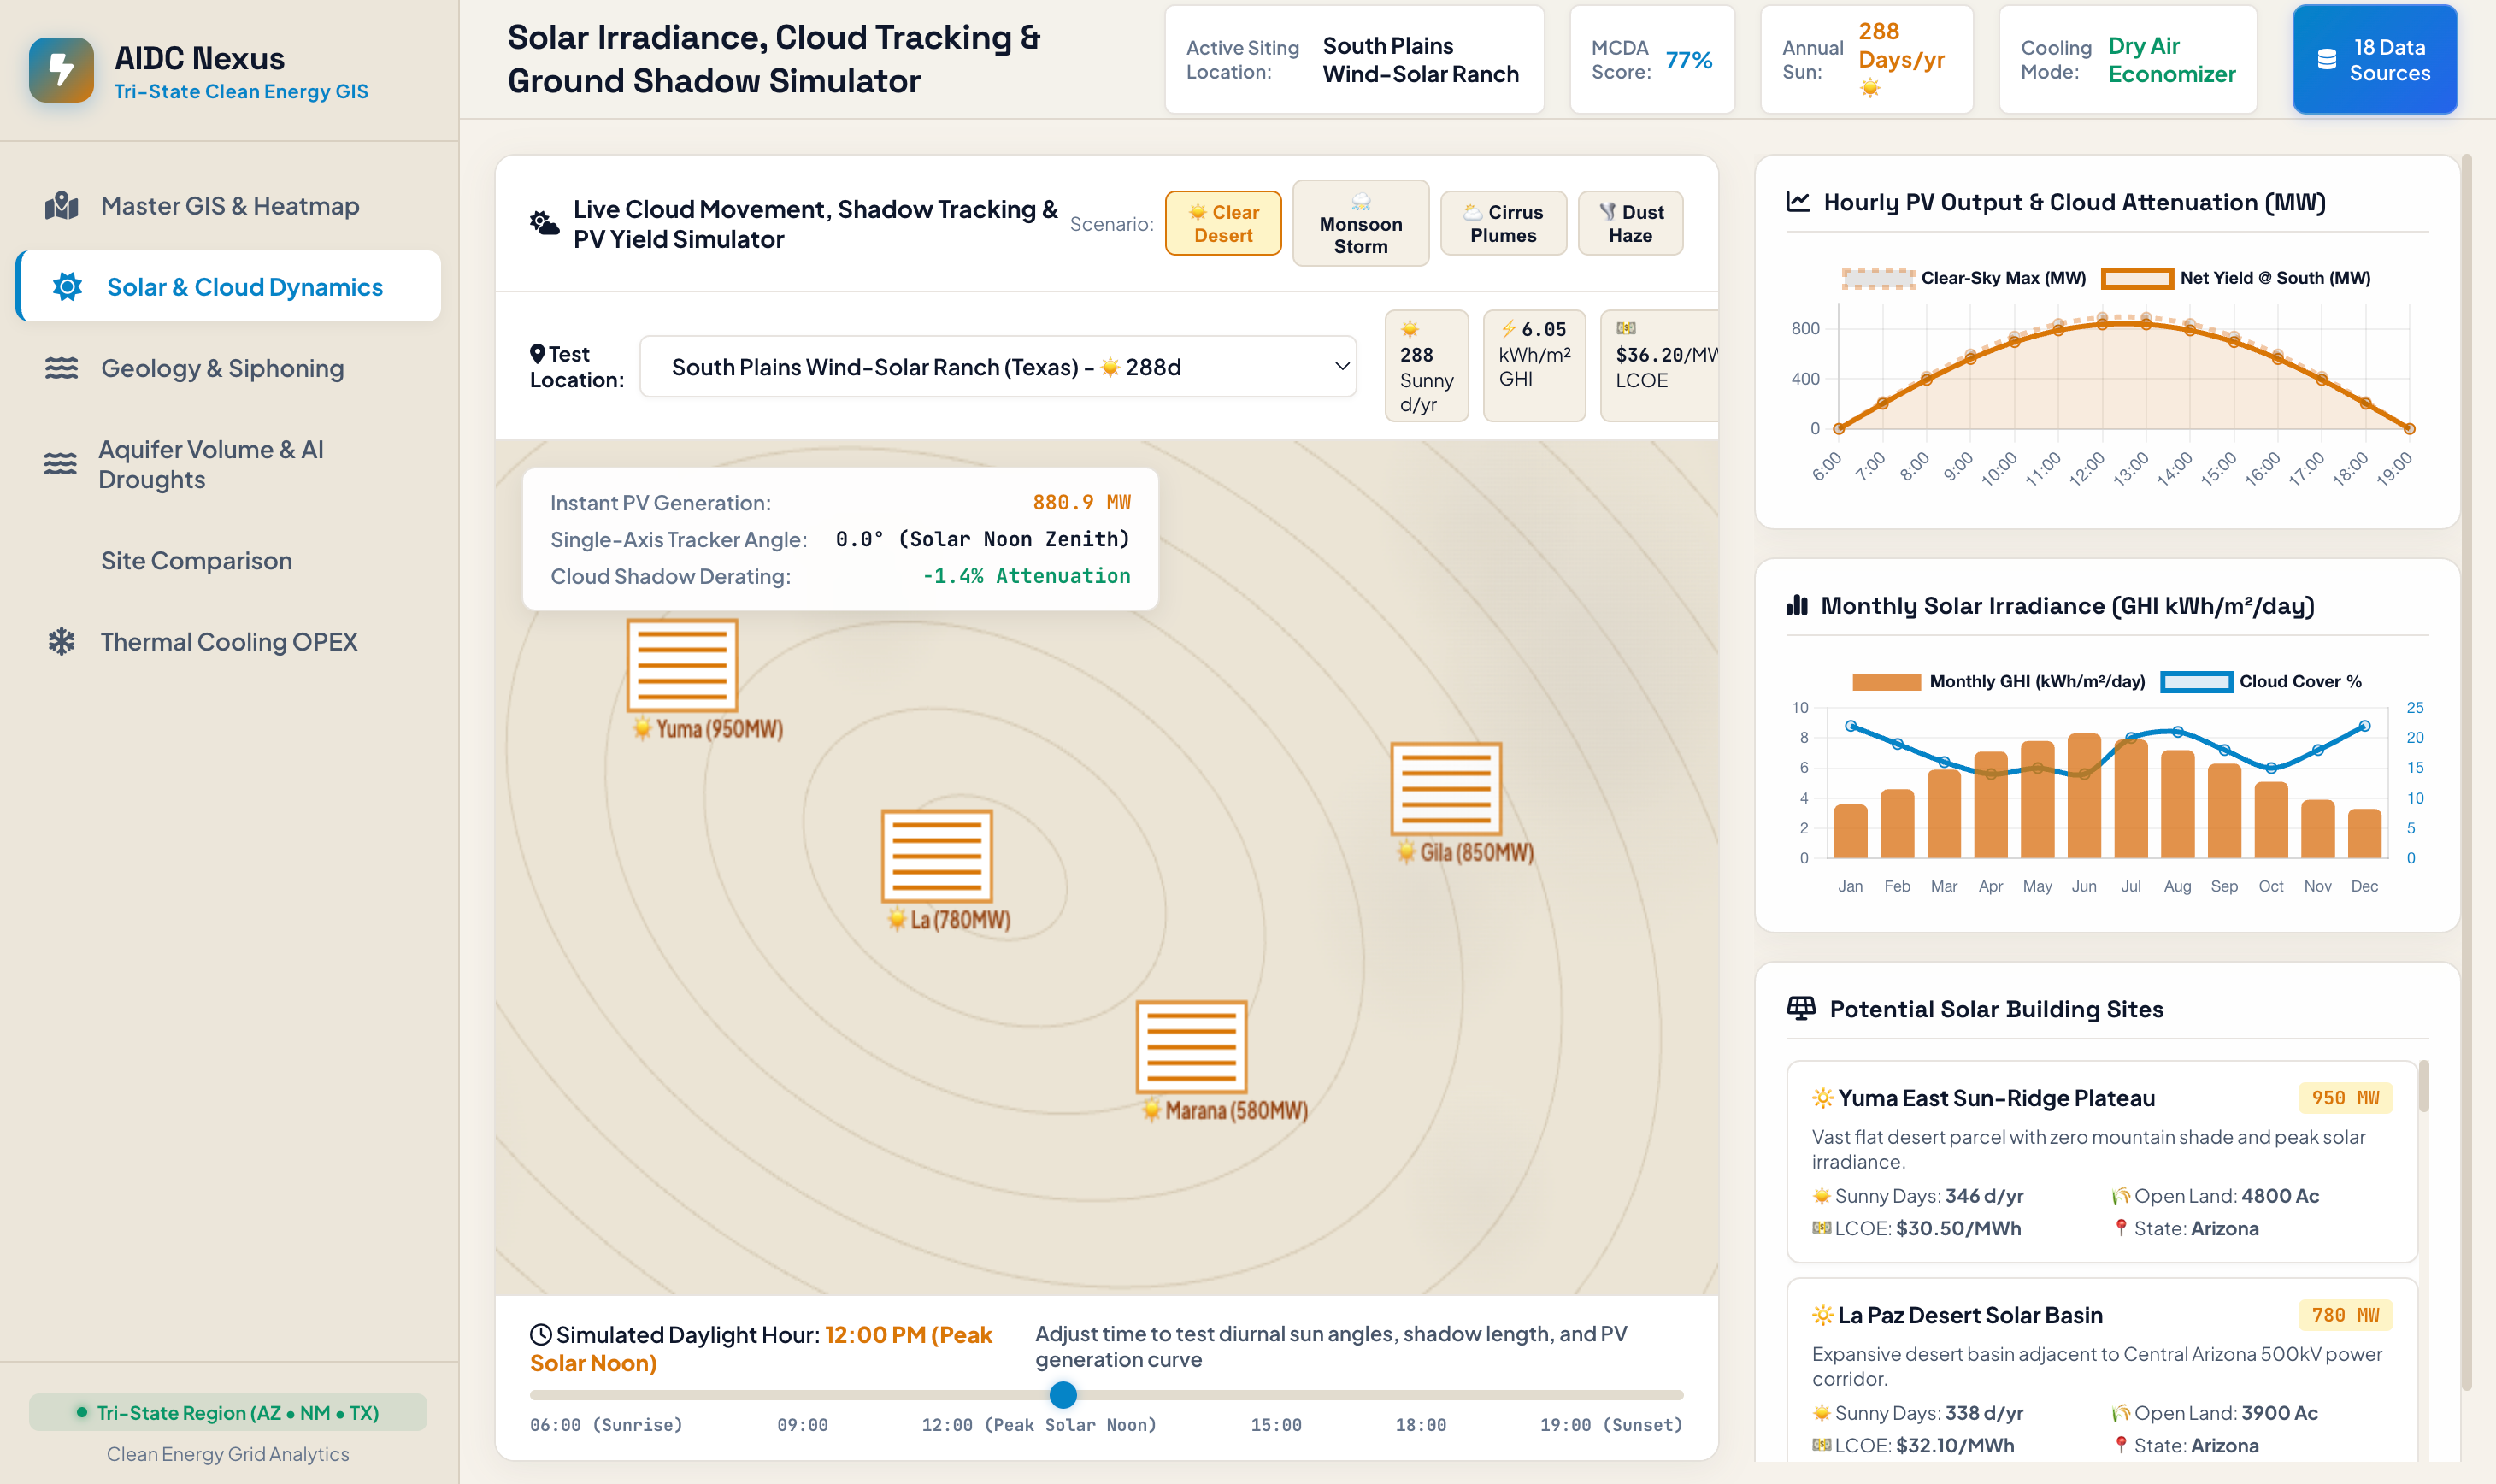
Solar and Cloud Dynamics
-
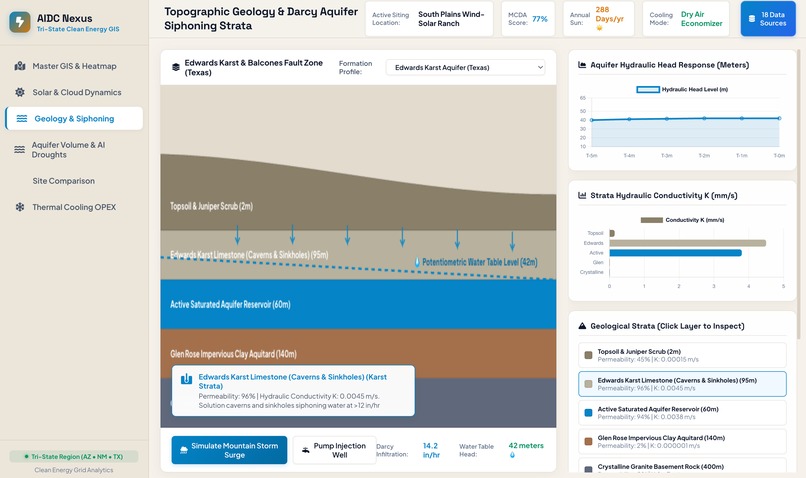
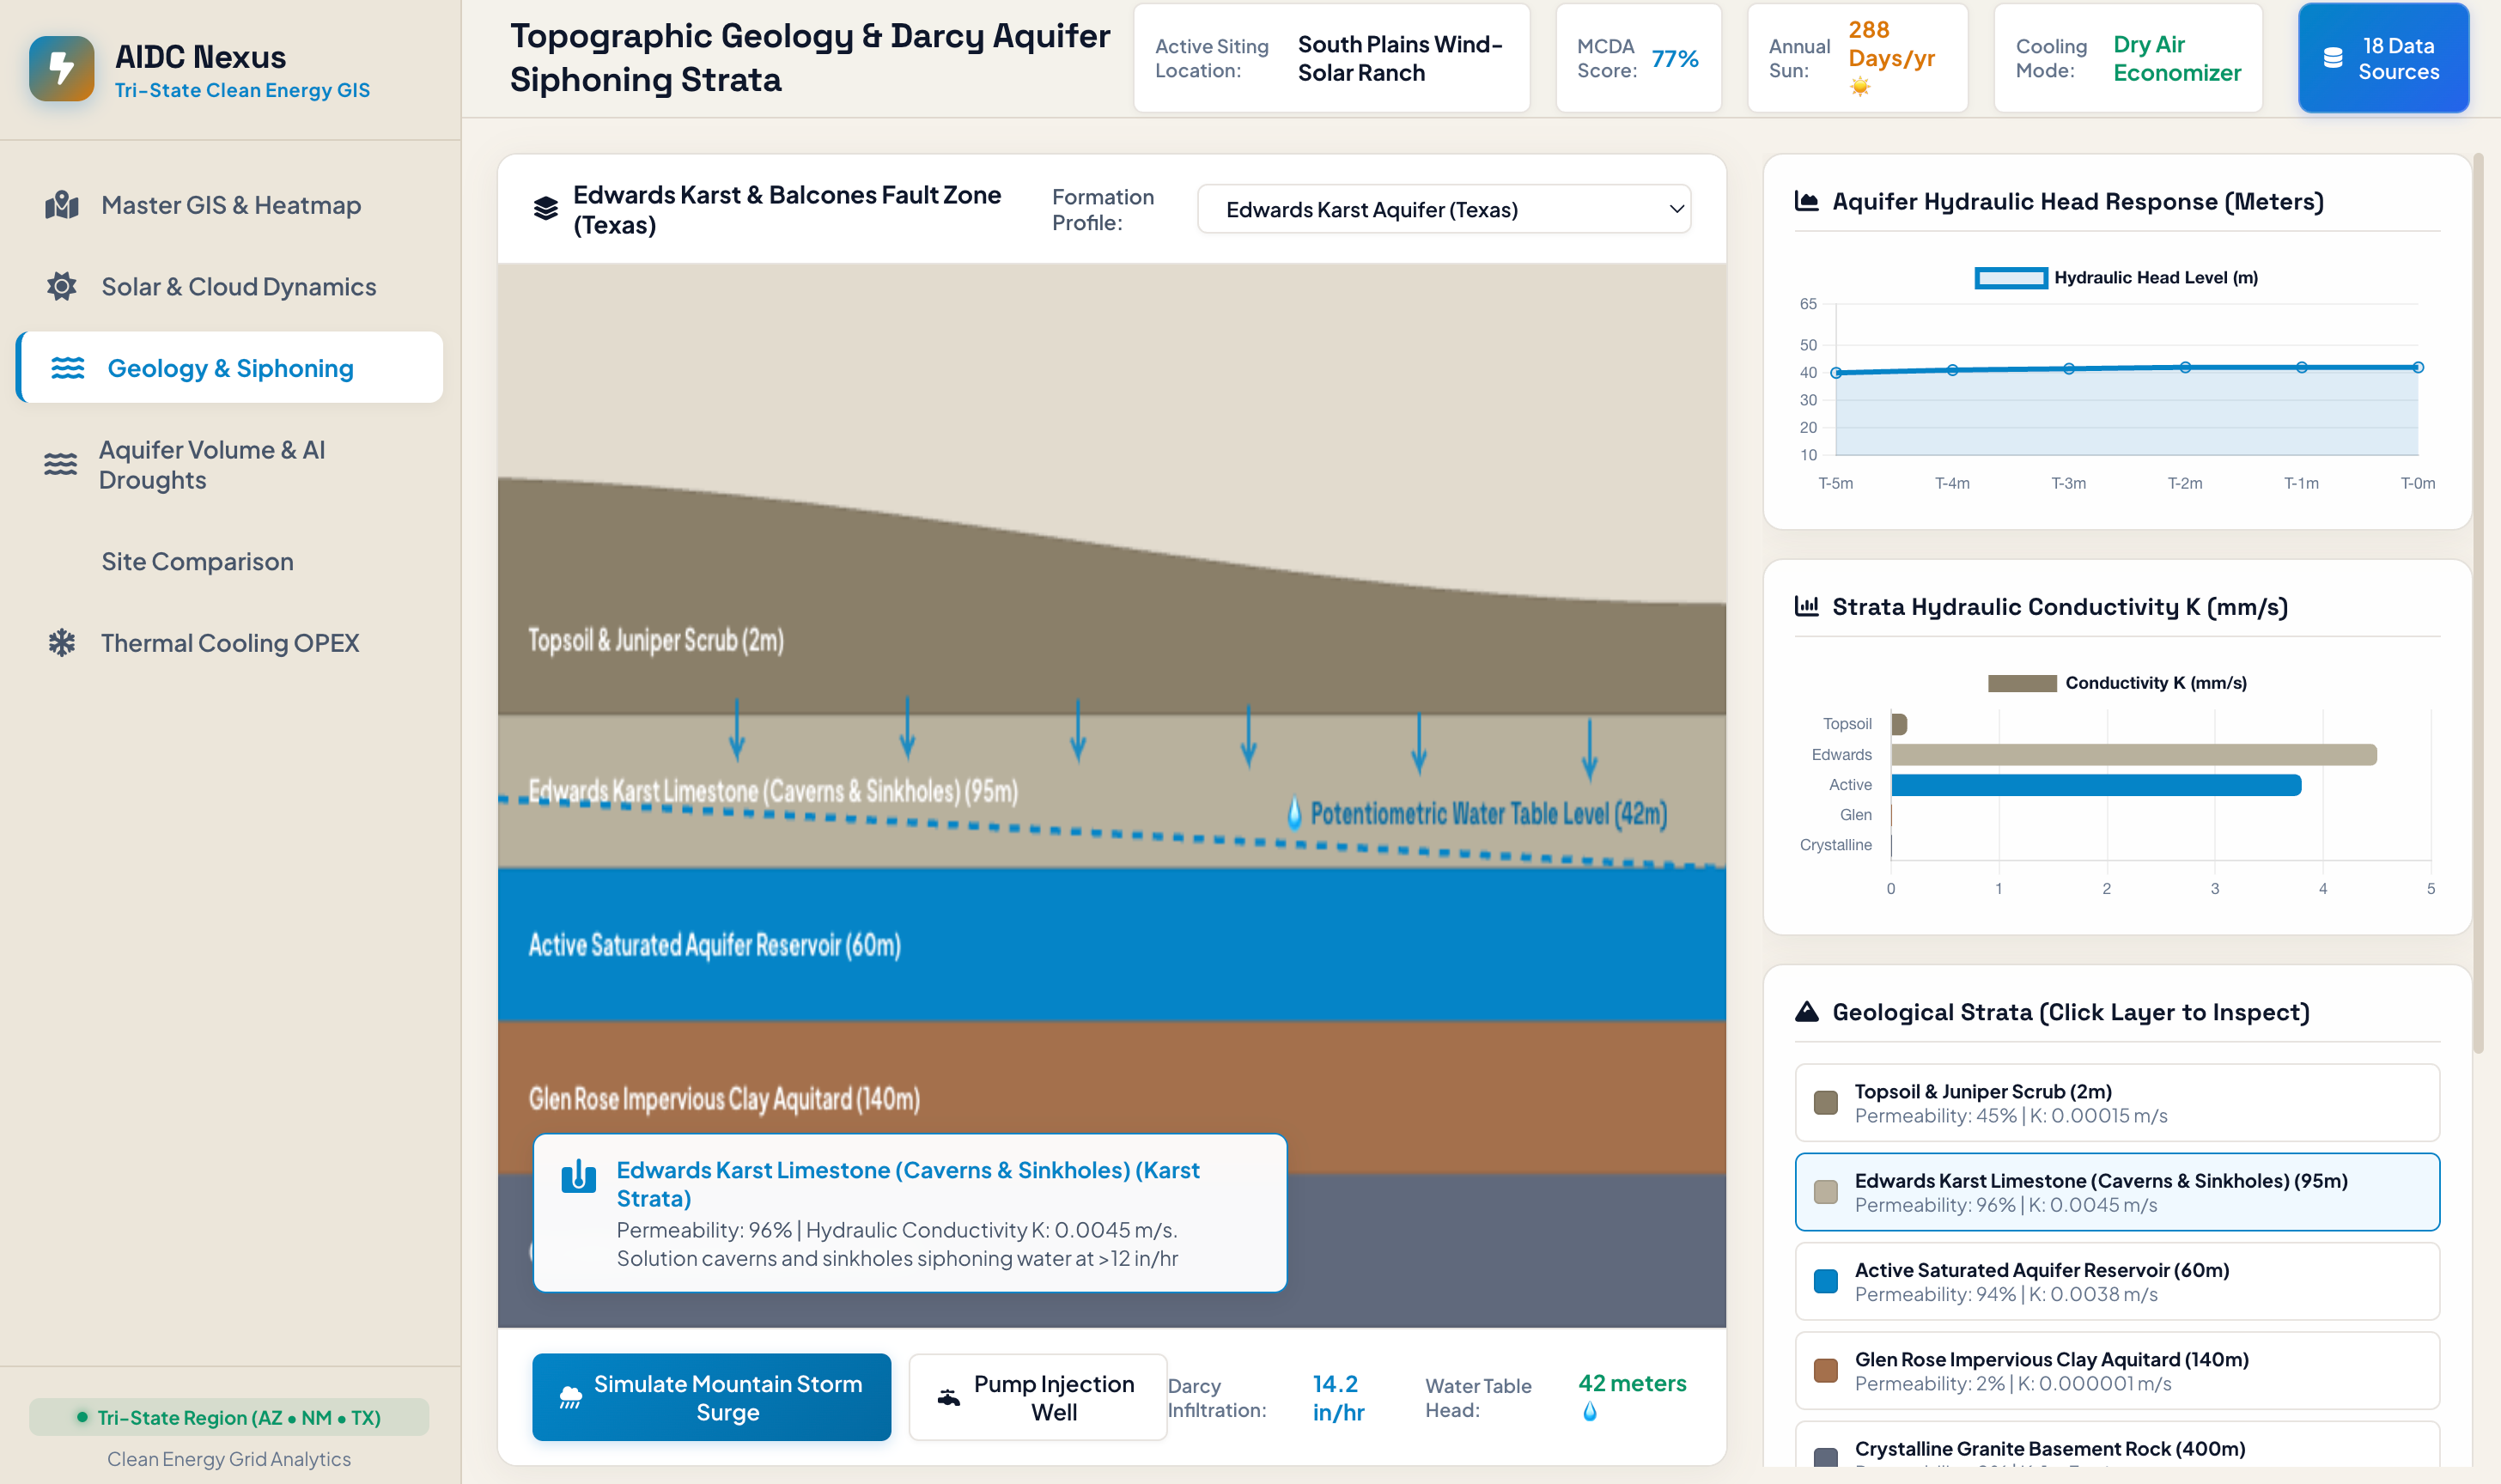
Geology and Siphoning
-
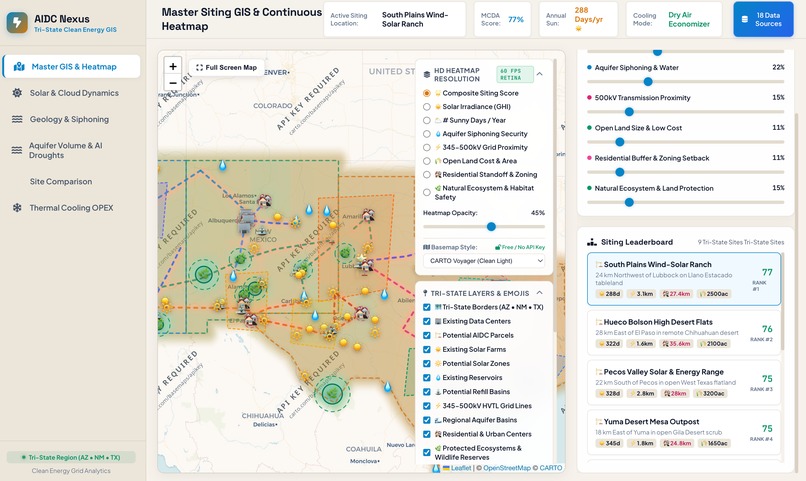
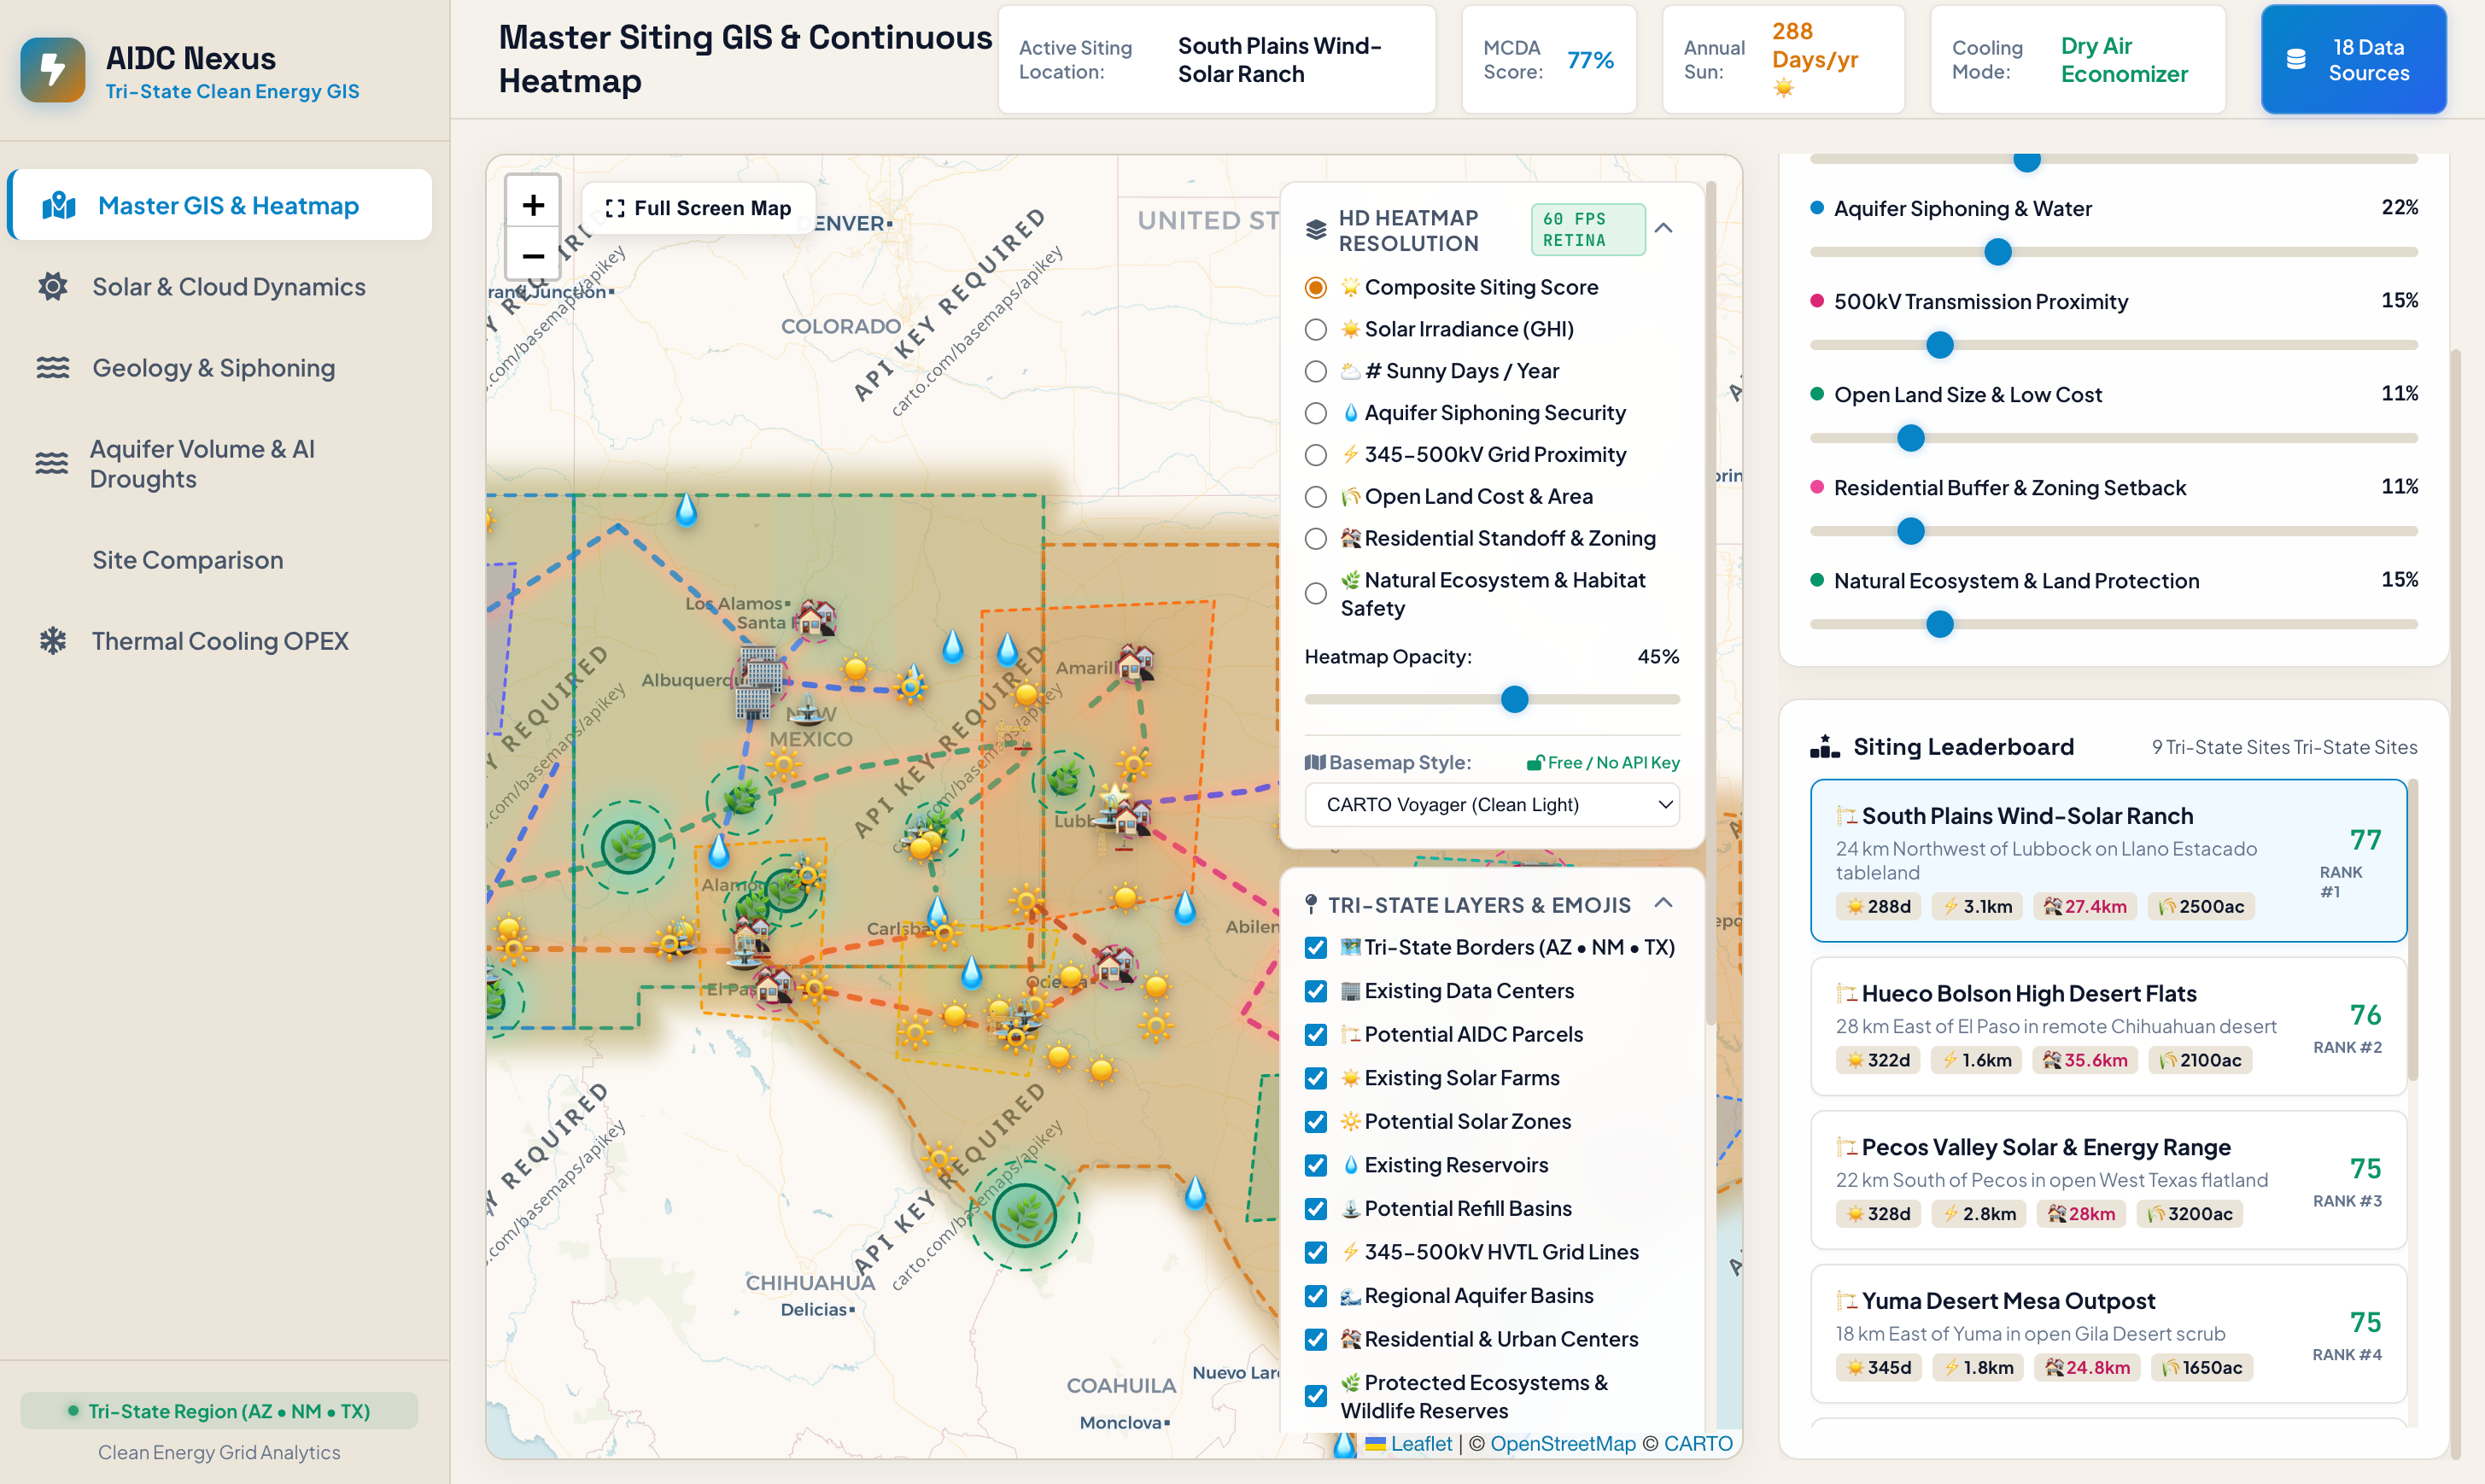
AIDC Heat Map
Inspiration
I was inspired by local issue surrounding my community. As an Arizona resident, the issue of water conservation is extremely prevalent. Additionally, several AI Data centers have emerged and cost copious amounts of water. While efforts are being made to make these data centers function efficiently and without unnecessary material usage, there is still a gap in efficient placement of these newly arising systems.
What it does
AIDC Nexus compiles data from power lines, water pricing, hydrogeology, land costs, and meteorology. Using this data, AIDC Nexus creates a heat map across Arizona, New Mexico, and Texas, showing where ideal data center placements are. Moreover, the website shows current solar farms and reservoir refill stations as well as predicting potential solar farms and refill stations. This is done by compiling meteorology and geology data.
Within the website, the user can create their own AIDC locations, or use the suggested locations. Users can adjust parameters like cooling technology types (air-cooled setups vs. water-intensive evaporative systems) to instantly view updated suitability scores across dynamic maps.
How we built it
The AIDC Nexus software architecture is structured as a client-side geospatial decision-support application, operating entirely within the browser execution context via HTML5, CSS3, and JavaScript. The spatial rendering system pairs Leaflet GIS with a custom, high-performance HTML5 Offscreen Canvas rasterizer. To eliminate rendering bottlenecks and spatial artifacts, the client-side engine executes real-time bilinear mesh interpolation over a coordinate grid, transforming vector attributes and raster datasets into continuous 60 FPS HiDPI/Retina heatmaps. Map tile rendering relies on vector baseline layers sourced from open-access web services including CARTO, OpenStreetMap, and Esri. The analytical core evaluates spatial criteria using a client-side Multi-Criteria Decision Analysis (MCDA) framework integrated with localized hydrogeological and thermodynamic physics engines. Rather than relying on live network API requests during runtime, the application reads from an encapsulated geospatial database (data.js) compiled from 18 authoritative scientific sources (such as NREL, USGS, and EIA). Dynamic suitability scoring is computed via a Weighted Linear Combination (WLC) model that evaluates solar yield, transmission line proximity via point-to-segment Euclidean projection, water table stress, and zoning constraints. Additionally, sub-surface hydrological modules simulate steady-state groundwater drawdown using Darcy’s Law and Dupuit-Thiem equations (aquifer_volume.js), while Chart.js visually renders output metrics for seasonal drought forecasts and thermal cooling operational expenditures.
*Coding was done in a hybrid fashion using gemini code.
Challenges we ran into
I faced a significant challenge in rendering dense, high-resolution geospatial heat-maps over multi-state regions in real time. Calculating Multi-Criteria Decision Analysis (MCDA) scores across thousands of geographic coordinates during map navigation caused severe frame rate drops, browser lag, and unsightly blocky pixel grids. Standard DOM manipulations and SVG rendering were unable to process the multi-layered solar, grid, and water stress datasets efficiently enough to maintain a fluid user experience.
To solve this, a custom hardware-accelerated rendering pipeline was engineered using an HTML5 Offscreen Canvas buffer and GPU bilinear mesh interpolation. By computing spatial data over a structured mesh and dynamically scaling canvas pixel resolution to match Retina displays, the application achieved smooth 60 FPS rendering. Additionally, a mathematical cosine distance attenuation formula was implemented to eliminate harsh edge cuts along geographic boundaries, creating a seamless, high-performance visual heat-map.
Accomplishments that we're proud of
Creating the interactive heat-map was my favorite accomplishment. Integrating huge amounts of solar, hydro, and geographic data into an interactive map posed issues; however, after those issued were solved, it felt like a huge accomplishment.
What we learned
I learned how to front end develop — a skill that I have been lacking. Specifically learning to create animations and icons.
What's next for AIDC Nexus
I hope to continue integrating this software throughout the United States and beyond. This would entail gathering larger data sets and also improving the user interface to increase user experience attract a larger audience.
Built With
- app.js
- carto
- chart.js
- css3
- data.js
- html5
- javascript
- leaflet.js
- mcda

Log in or sign up for Devpost to join the conversation.