Inspiration
Investing platforms give people access to a lot of information, but that does not always make a portfolio easier to understand. Portfolio tracking, risk analysis, market research, and financial data are often spread across several different tools.
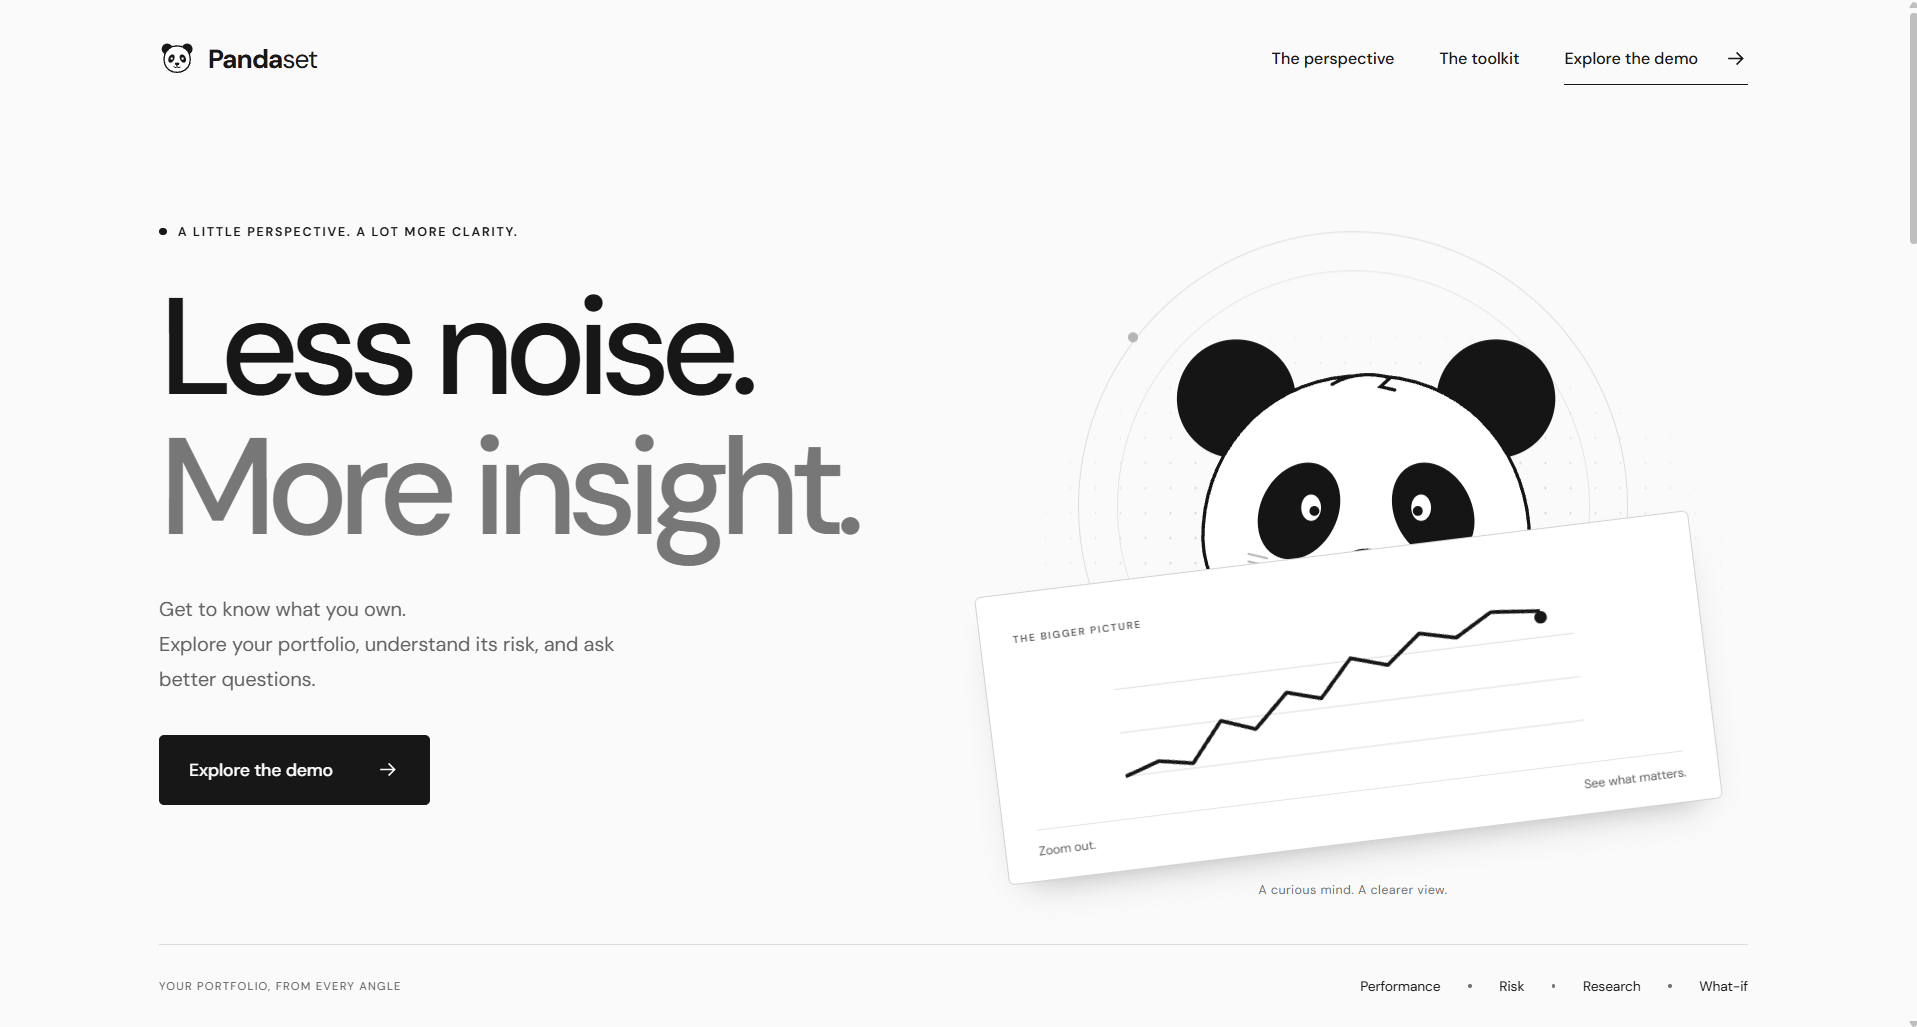
We wanted to bring those pieces together in one place. That idea became PandaSet, a quantitative portfolio research and analysis platform.
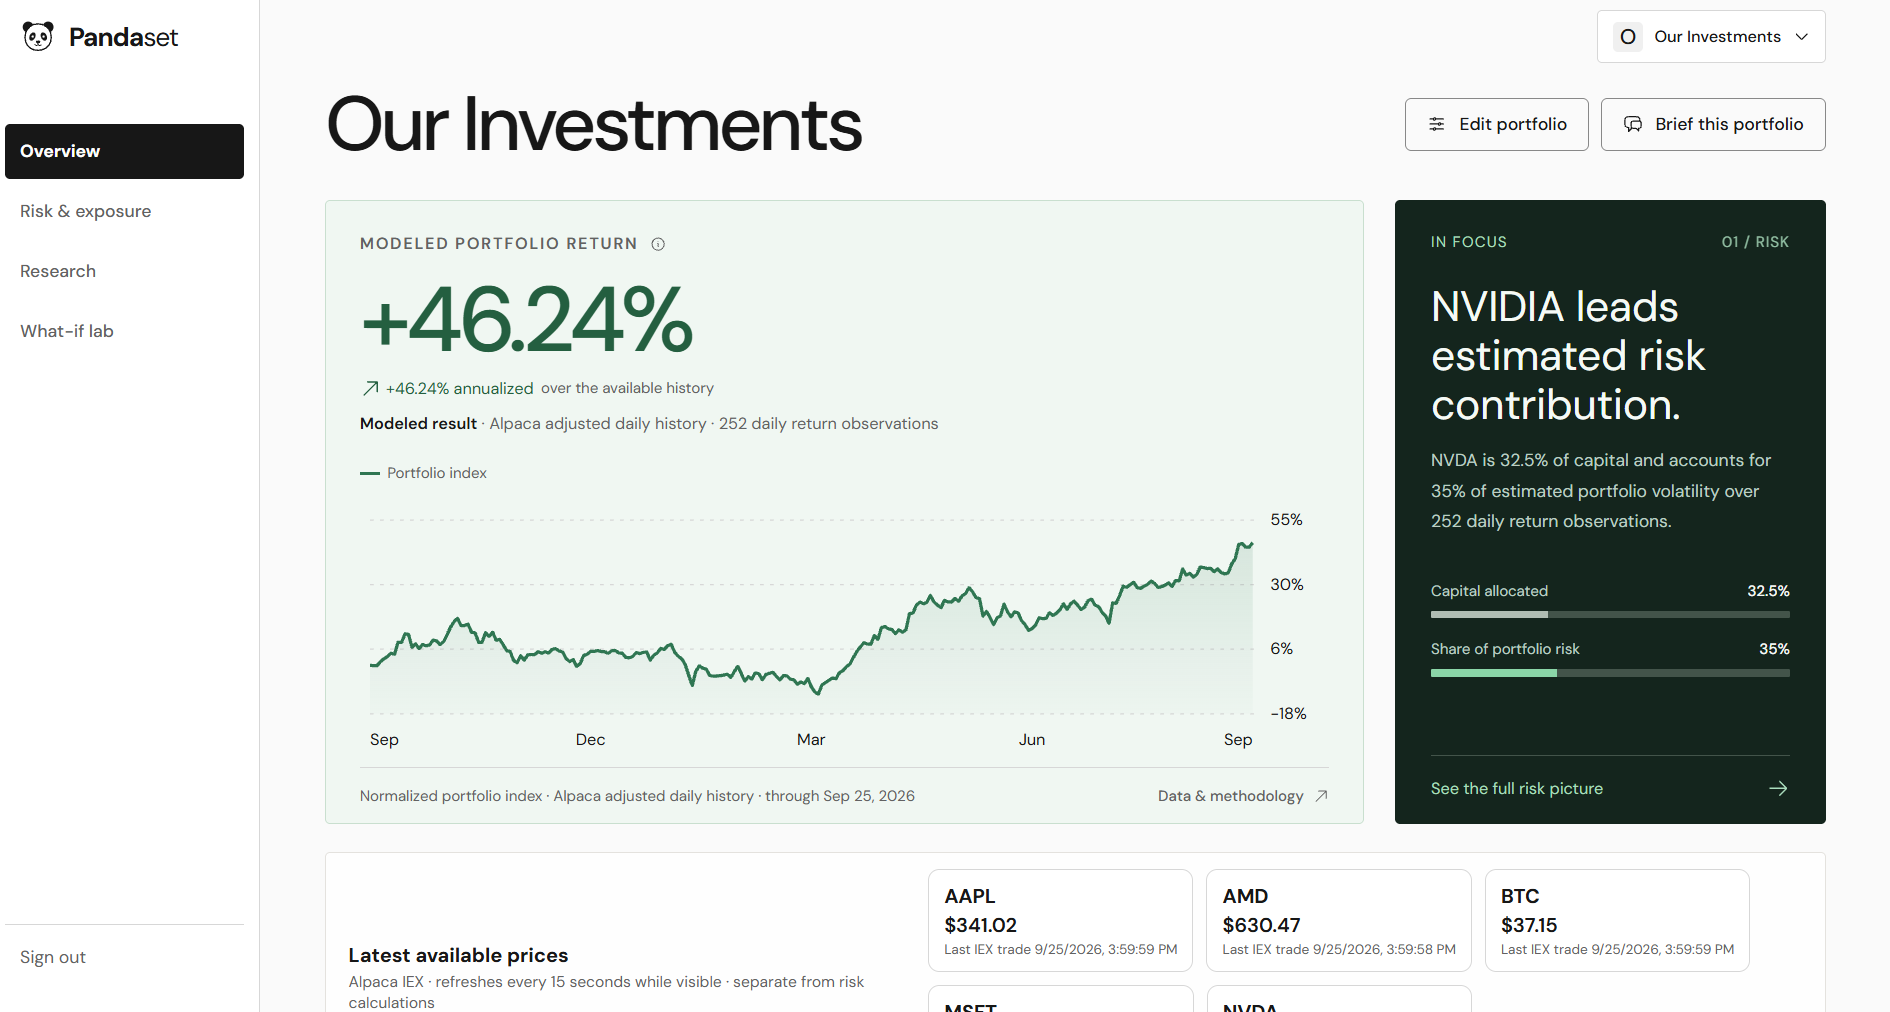
Our goal was to help users understand more than their portfolio's total return. We wanted to show what drives its performance and where its risks come from. PandaSet gives users tools to study their allocations, historical performance, risk, and possible portfolio changes from one workspace.
What it does
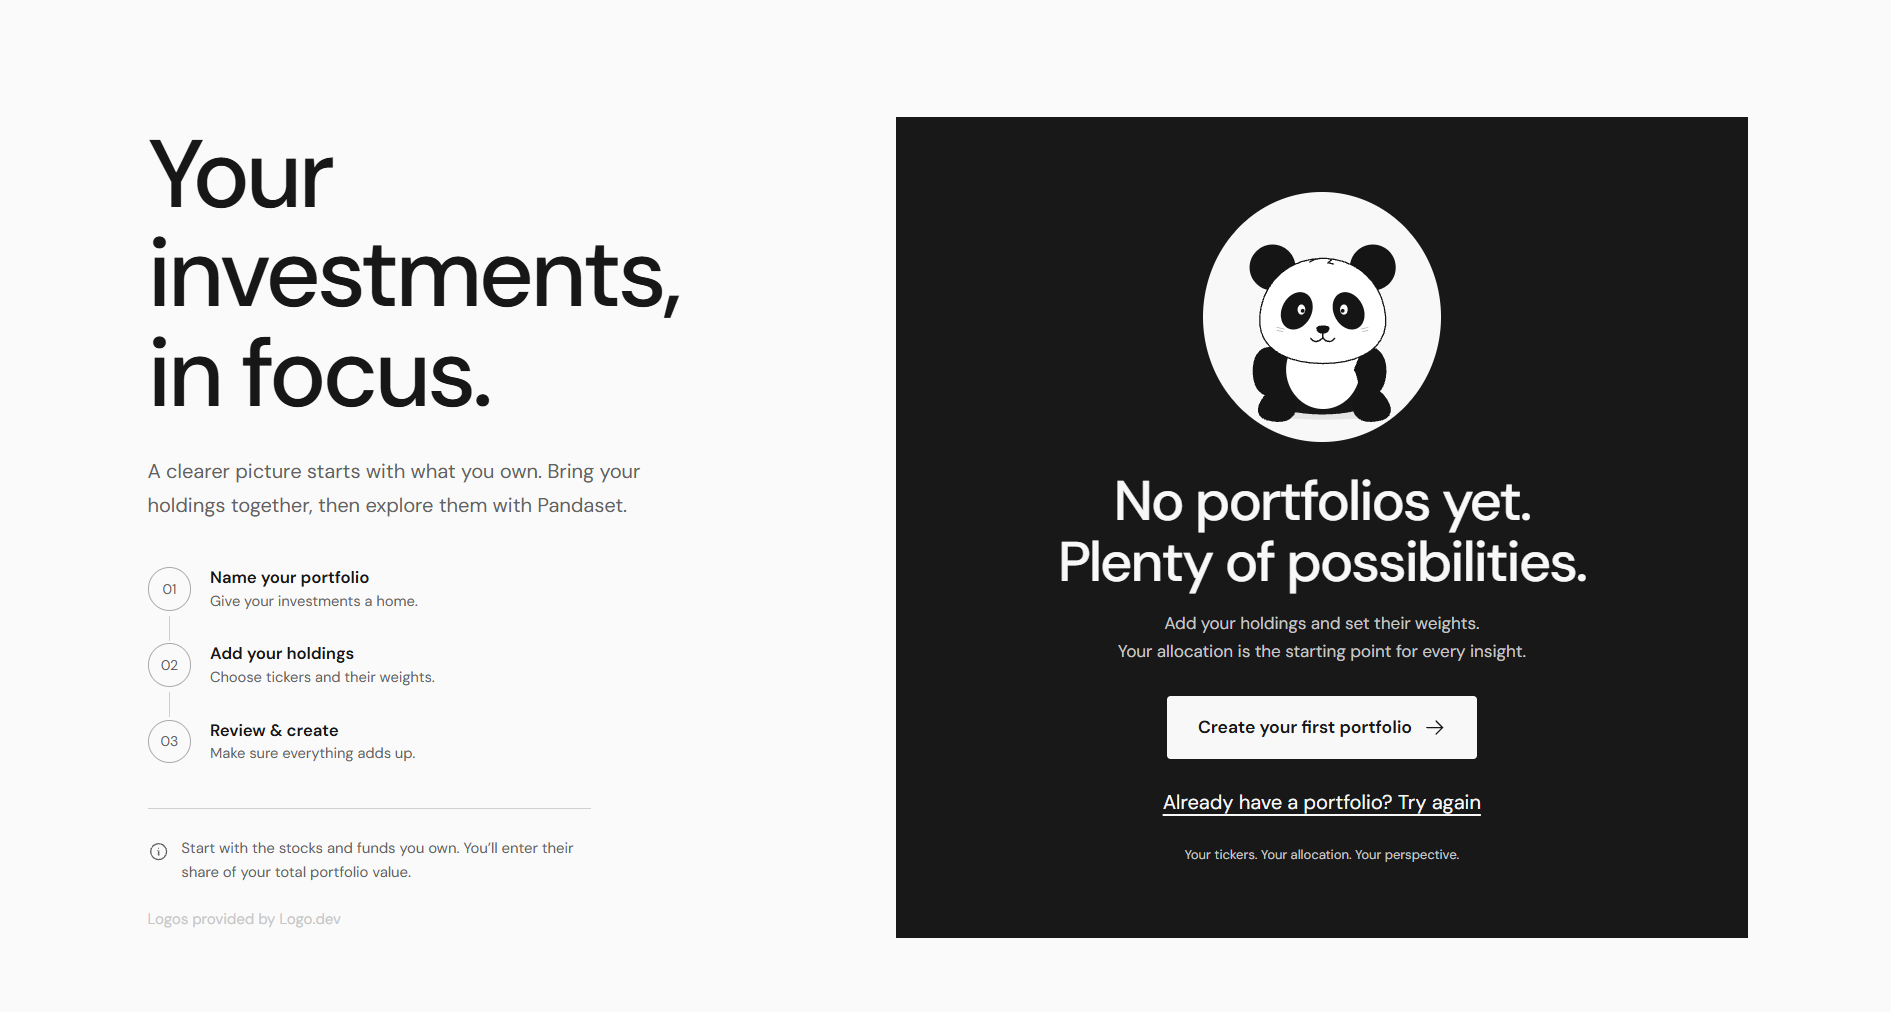
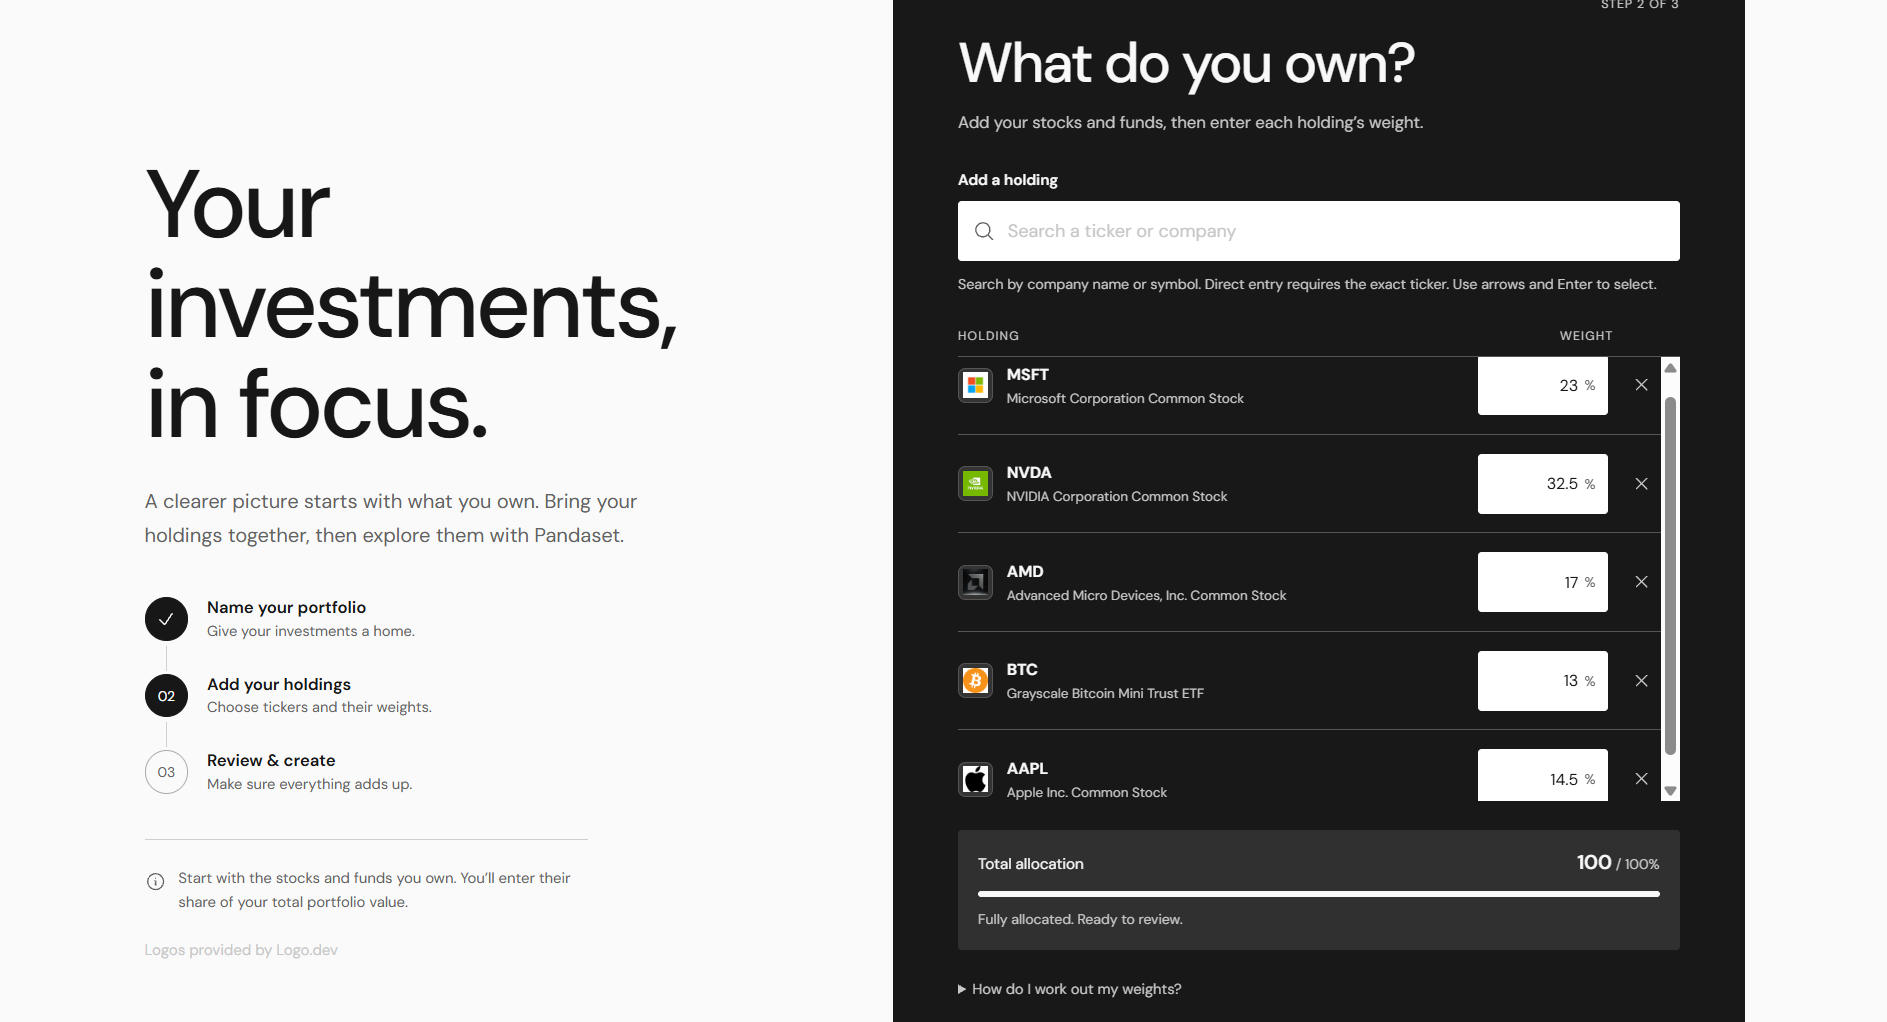
PandaSet turns a user's portfolio into a workspace for quantitative analysis and research. Users can create portfolios with real stock tickers and set their own allocations. PandaSet then uses market data to analyze the portfolio's historical performance and risk.
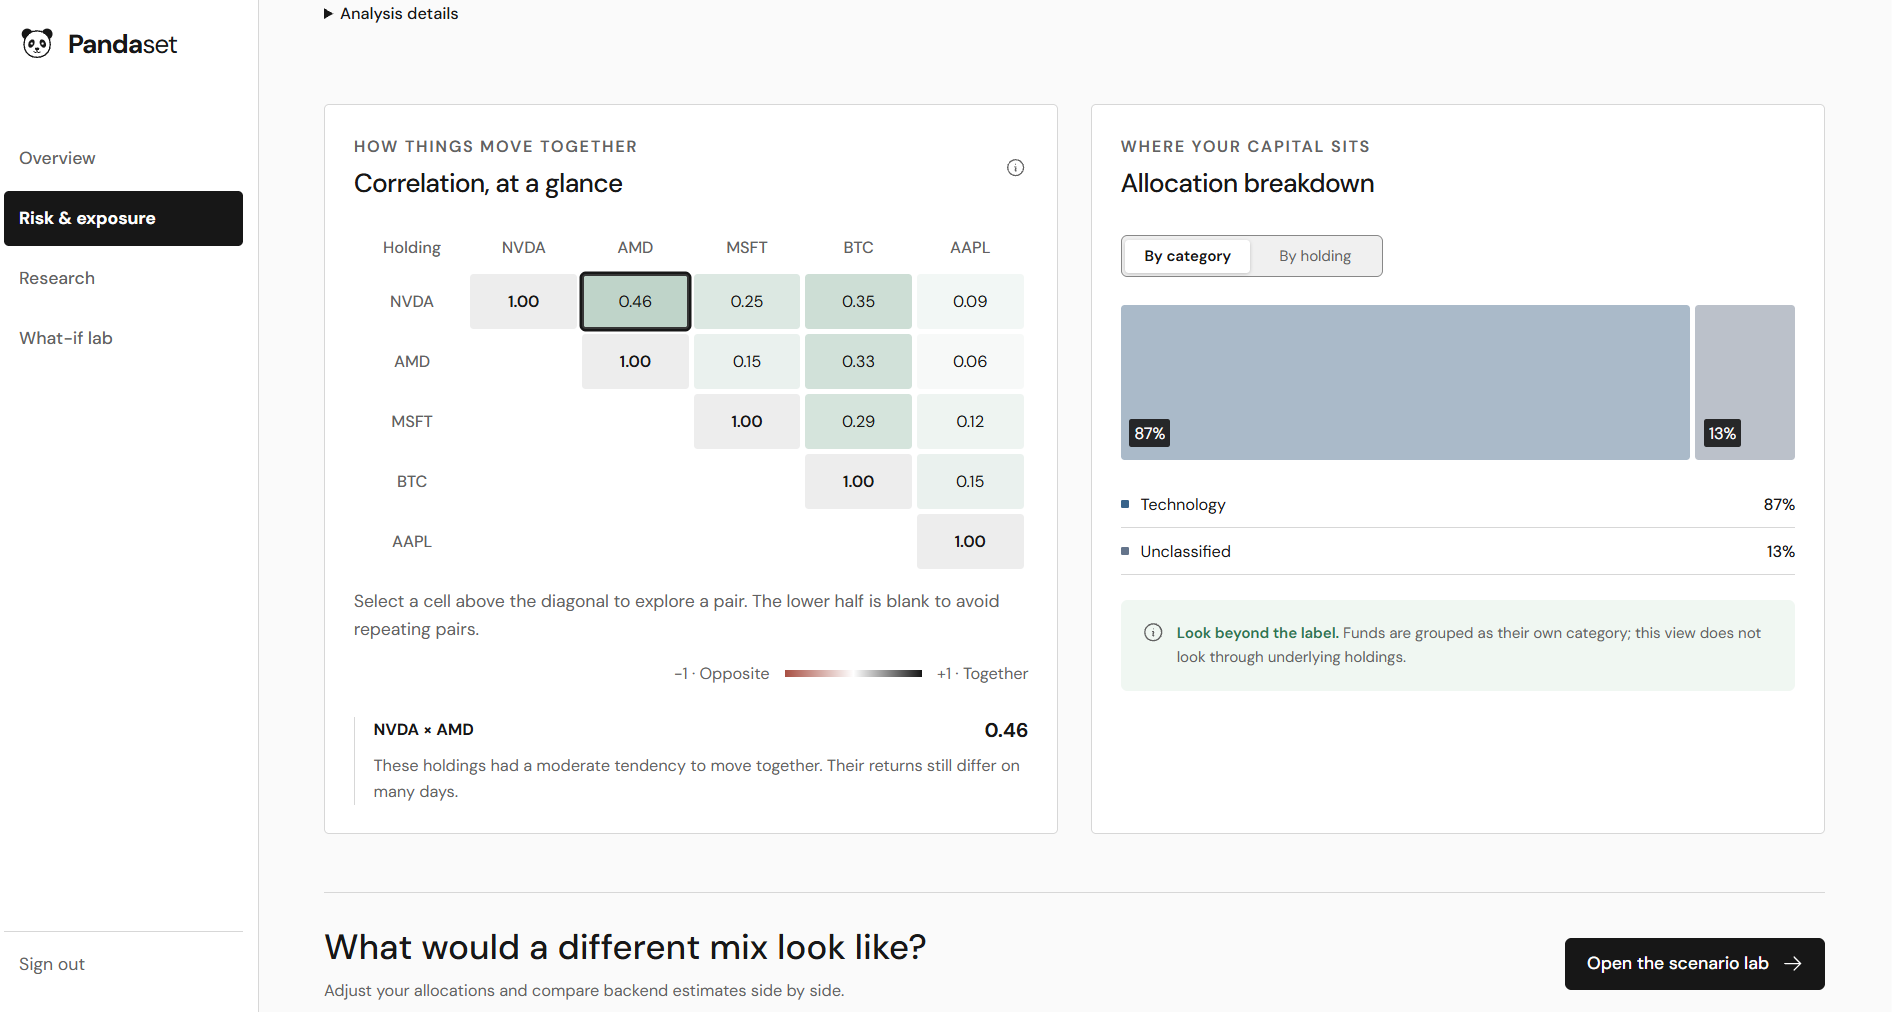
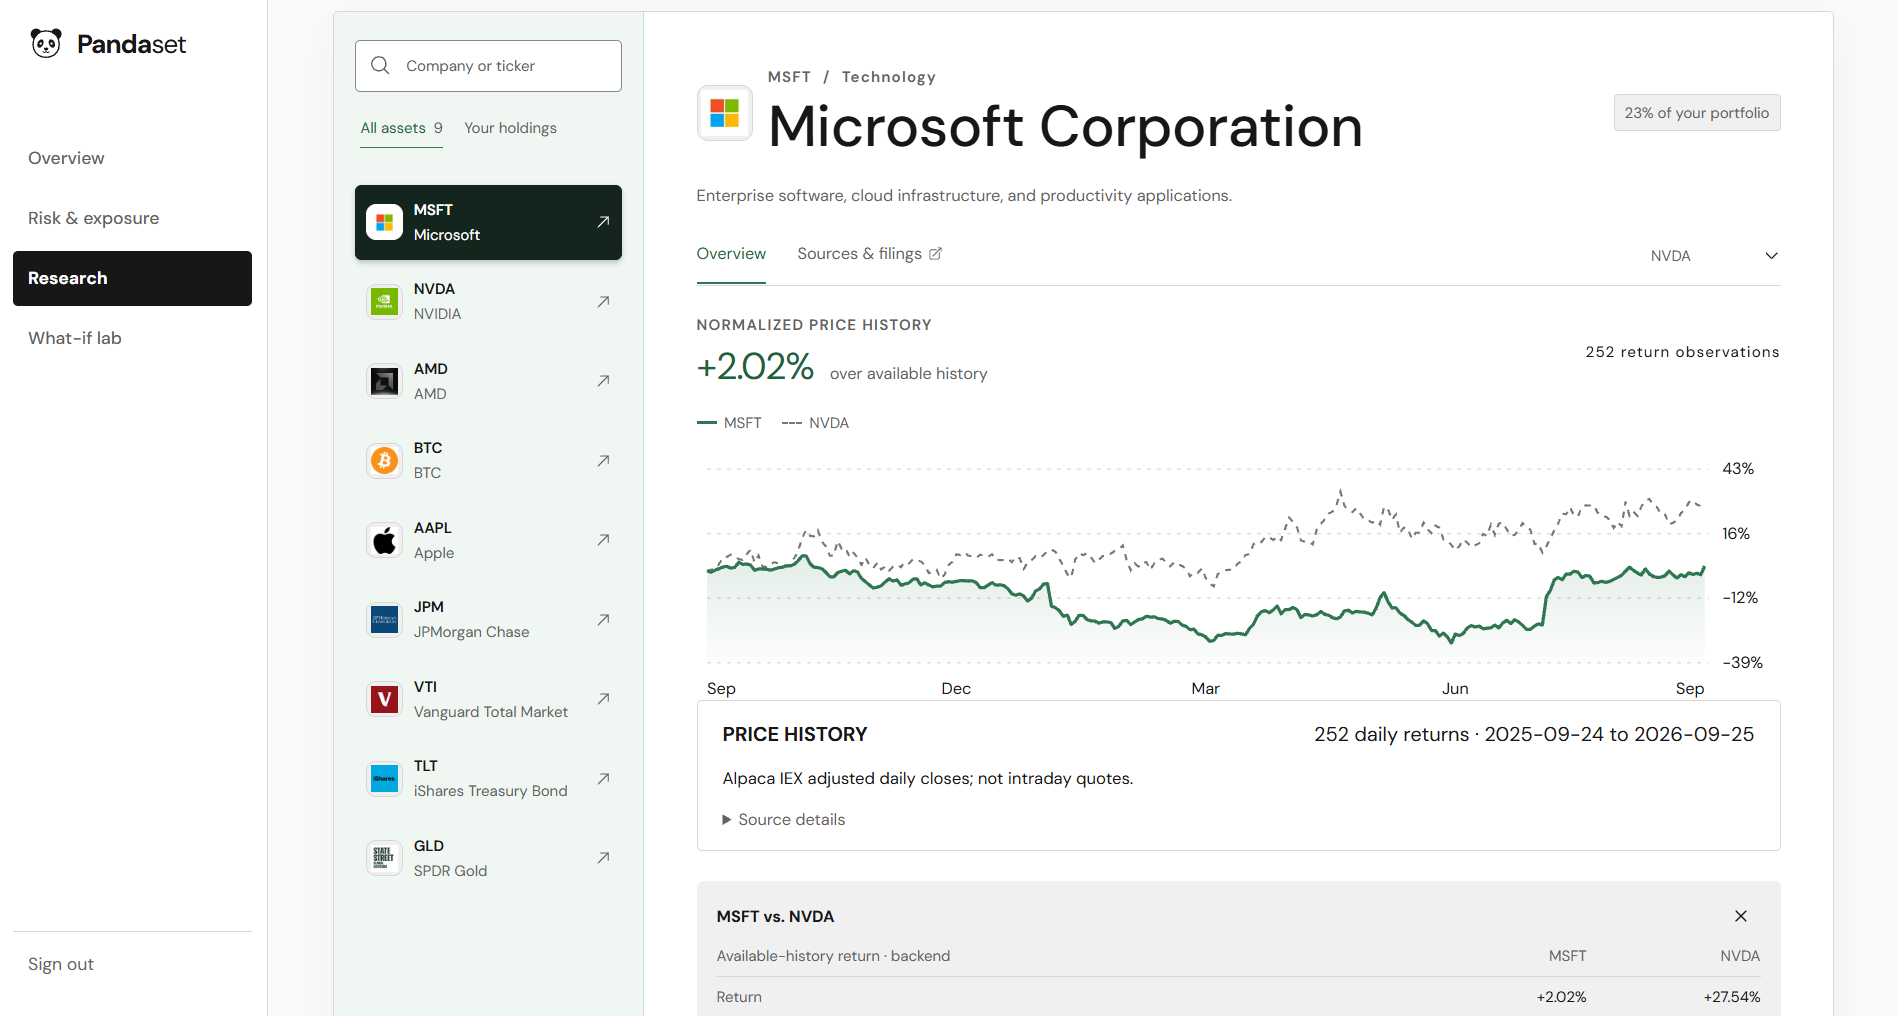
The Research section provides information about returns, correlations, drawdowns, and other portfolio metrics. The Risk Exposure section helps users understand where their portfolio risk comes from and how each position contributes to it.
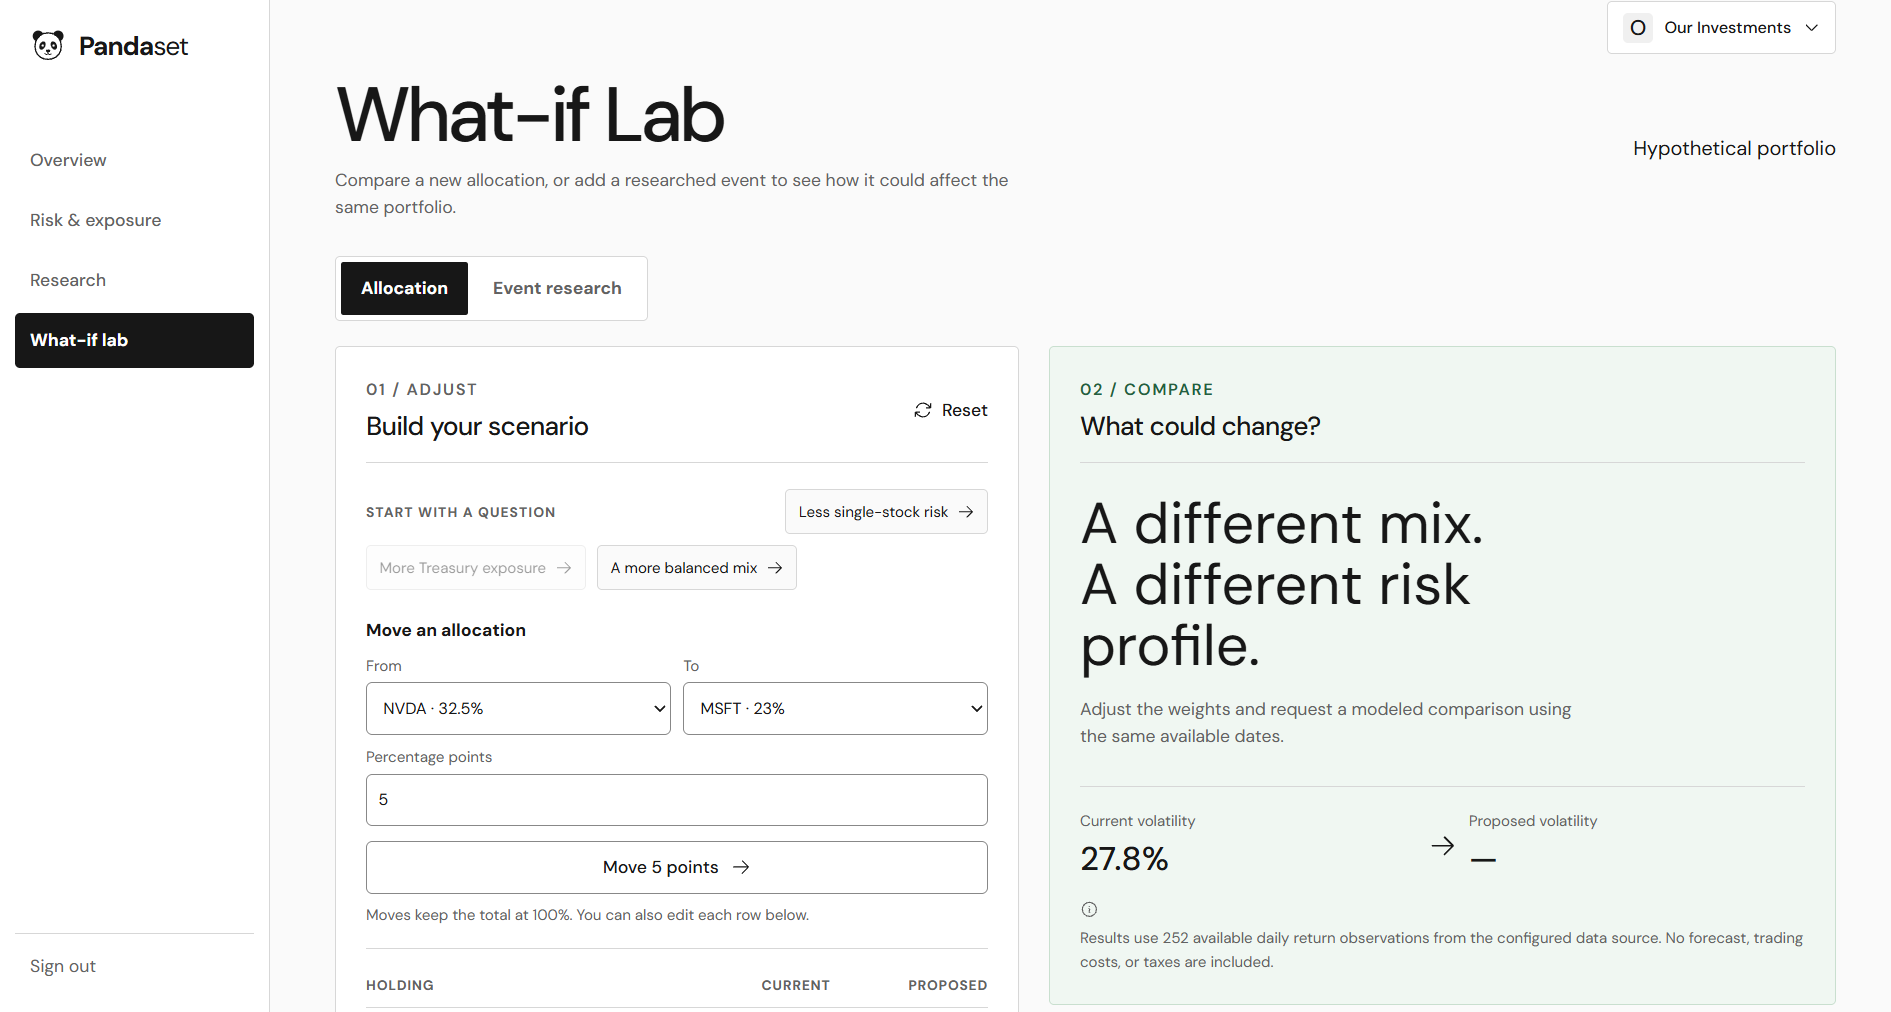
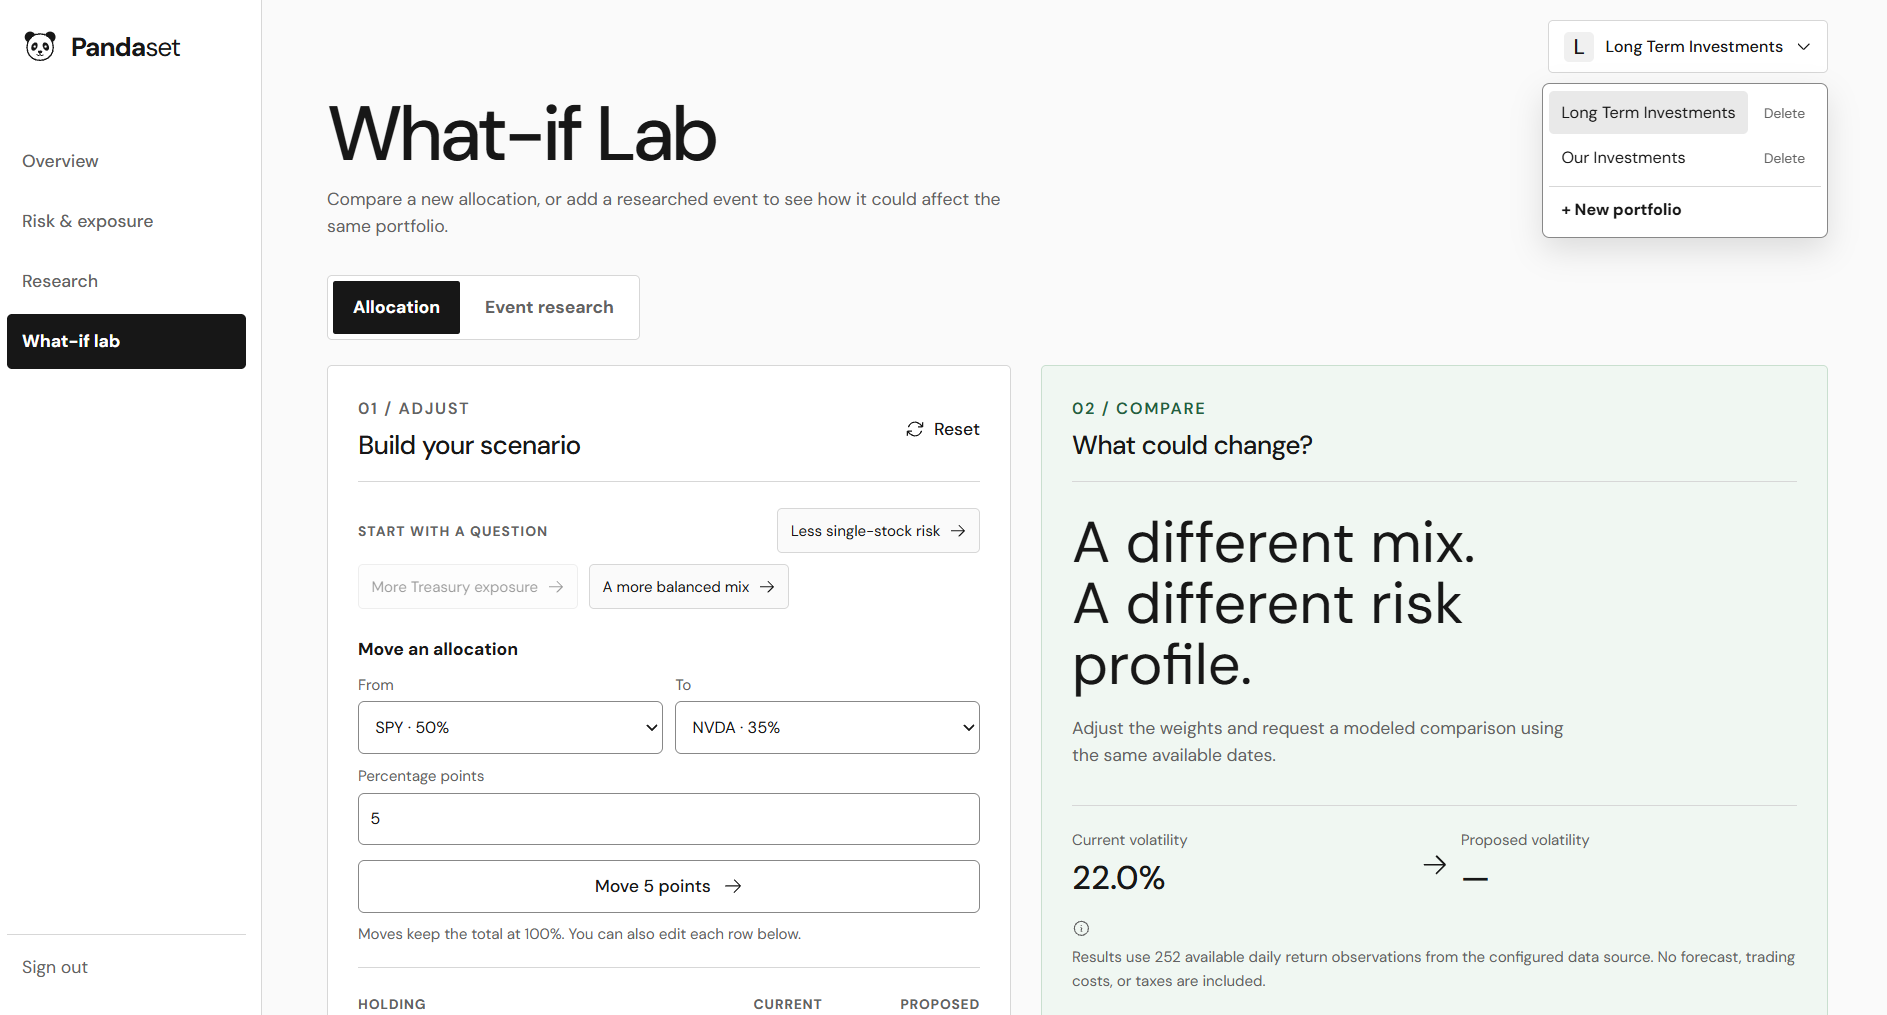
We also built a What-If Lab where users can test changes without modifying their current portfolio. They can compare their existing allocation against a proposed one using historical data and quantitative metrics.
PandaSet also uses AI to help users understand the results of their analysis. The AI works alongside the quantitative tools rather than replacing them. This gives users another way to understand their results and explore questions about their portfolio.
How we built it
We built PandaSet as a full-stack application using React and TypeScript for the frontend and FastAPI with Python for the backend.
Our quantitative engine is written in Python. It handles portfolio calculations, historical analysis, risk metrics, and scenario analysis.
We integrated Alpaca to provide market data for the research and risk tools. This allows PandaSet to perform its calculations using real historical market data . We use Supabase for authentication so users can create accounts and access their own workspace. We also integrated Gemini to support AI-assisted research and explanations.
On the frontend, we focused on presenting the results in a way that is easy to follow. We built separate views for portfolio management, research, risk exposure, and what-if analysis.
For production, we deployed the frontend and backend separately. This allowed the React application to communicate with our Python API while keeping the quantitative calculations on the backend.
Challenges we ran into
One of our main challenges was getting each part of the application to work together consistently. Portfolio data moves through several parts of the system before the user sees the final analysis.
We also had to handle several portfolio input problems. These included invalid tickers, incorrect allocations, missing information, and updates to existing portfolios.
Market data created another challenge. Our calculations depend on consistent historical data, so we had to make sure the backend received the correct information before running an analysis. Deployment was also more difficult than we expected. Our local setup did not transfer directly to every hosting platform we tried.
We had to configure the frontend, backend, authentication, API keys, and environment variables for production. Debugging those issues helped us better understand how the different parts of our application communicate.
Accomplishments that we're proud of
We are proud that we built PandaSet into a working full-stack quantitative finance platform within the hackathon. We connected a React and TypeScript frontend to a Python quantitative engine and FastAPI backend.
We integrated real market data through Alpaca and built tools for portfolio analysis, risk exposure, research, and what-if scenarios. We also added Gemini to help users understand and explore the results produced by our quantitative tools.
Another accomplishment was getting several different services to work together in production. We connected Supabase authentication, our market data pipeline, the quantitative engine, AI features, and our deployed frontend and backend.
Most importantly, we built something that we would actually want to continue developing after the hackathon. PandaSet started as an idea and became a working platform that can serve as the foundation for more advanced quantitative research tools.
What we learned
We learned that building a quantitative finance application involves much more than implementing financial formulas. The calculations also depend on reliable data, backend design, and a frontend that clearly presents the results.
We also learned how important input validation is for financial applications. Invalid tickers or allocations can affect everything that comes after them, so we needed to catch those problems early.
Another lesson was how to use AI alongside quantitative analysis. We wanted the calculations to provide the foundation while AI helped users understand and explore the results.
Finally, deploying PandaSet taught us a lot about moving a full-stack project from a local environment into production. We had to understand how each service worked together instead of treating deployment as the final button to press.
What's next for PandaSet
We want to continue improving the quantitative research tools available in PandaSet. Possible additions include portfolio optimization, factor analysis, regime detection, stress testing, and more detailed scenario analysis.
We also want to expand the AI research tools while keeping them connected to actual portfolio and market data.
Our long-term goal is to make PandaSet a practical quantitative research workspace. Users should be able to analyze portfolios, test ideas, study risk, and research their investments from one place.


Log in or sign up for Devpost to join the conversation.