Inspiration
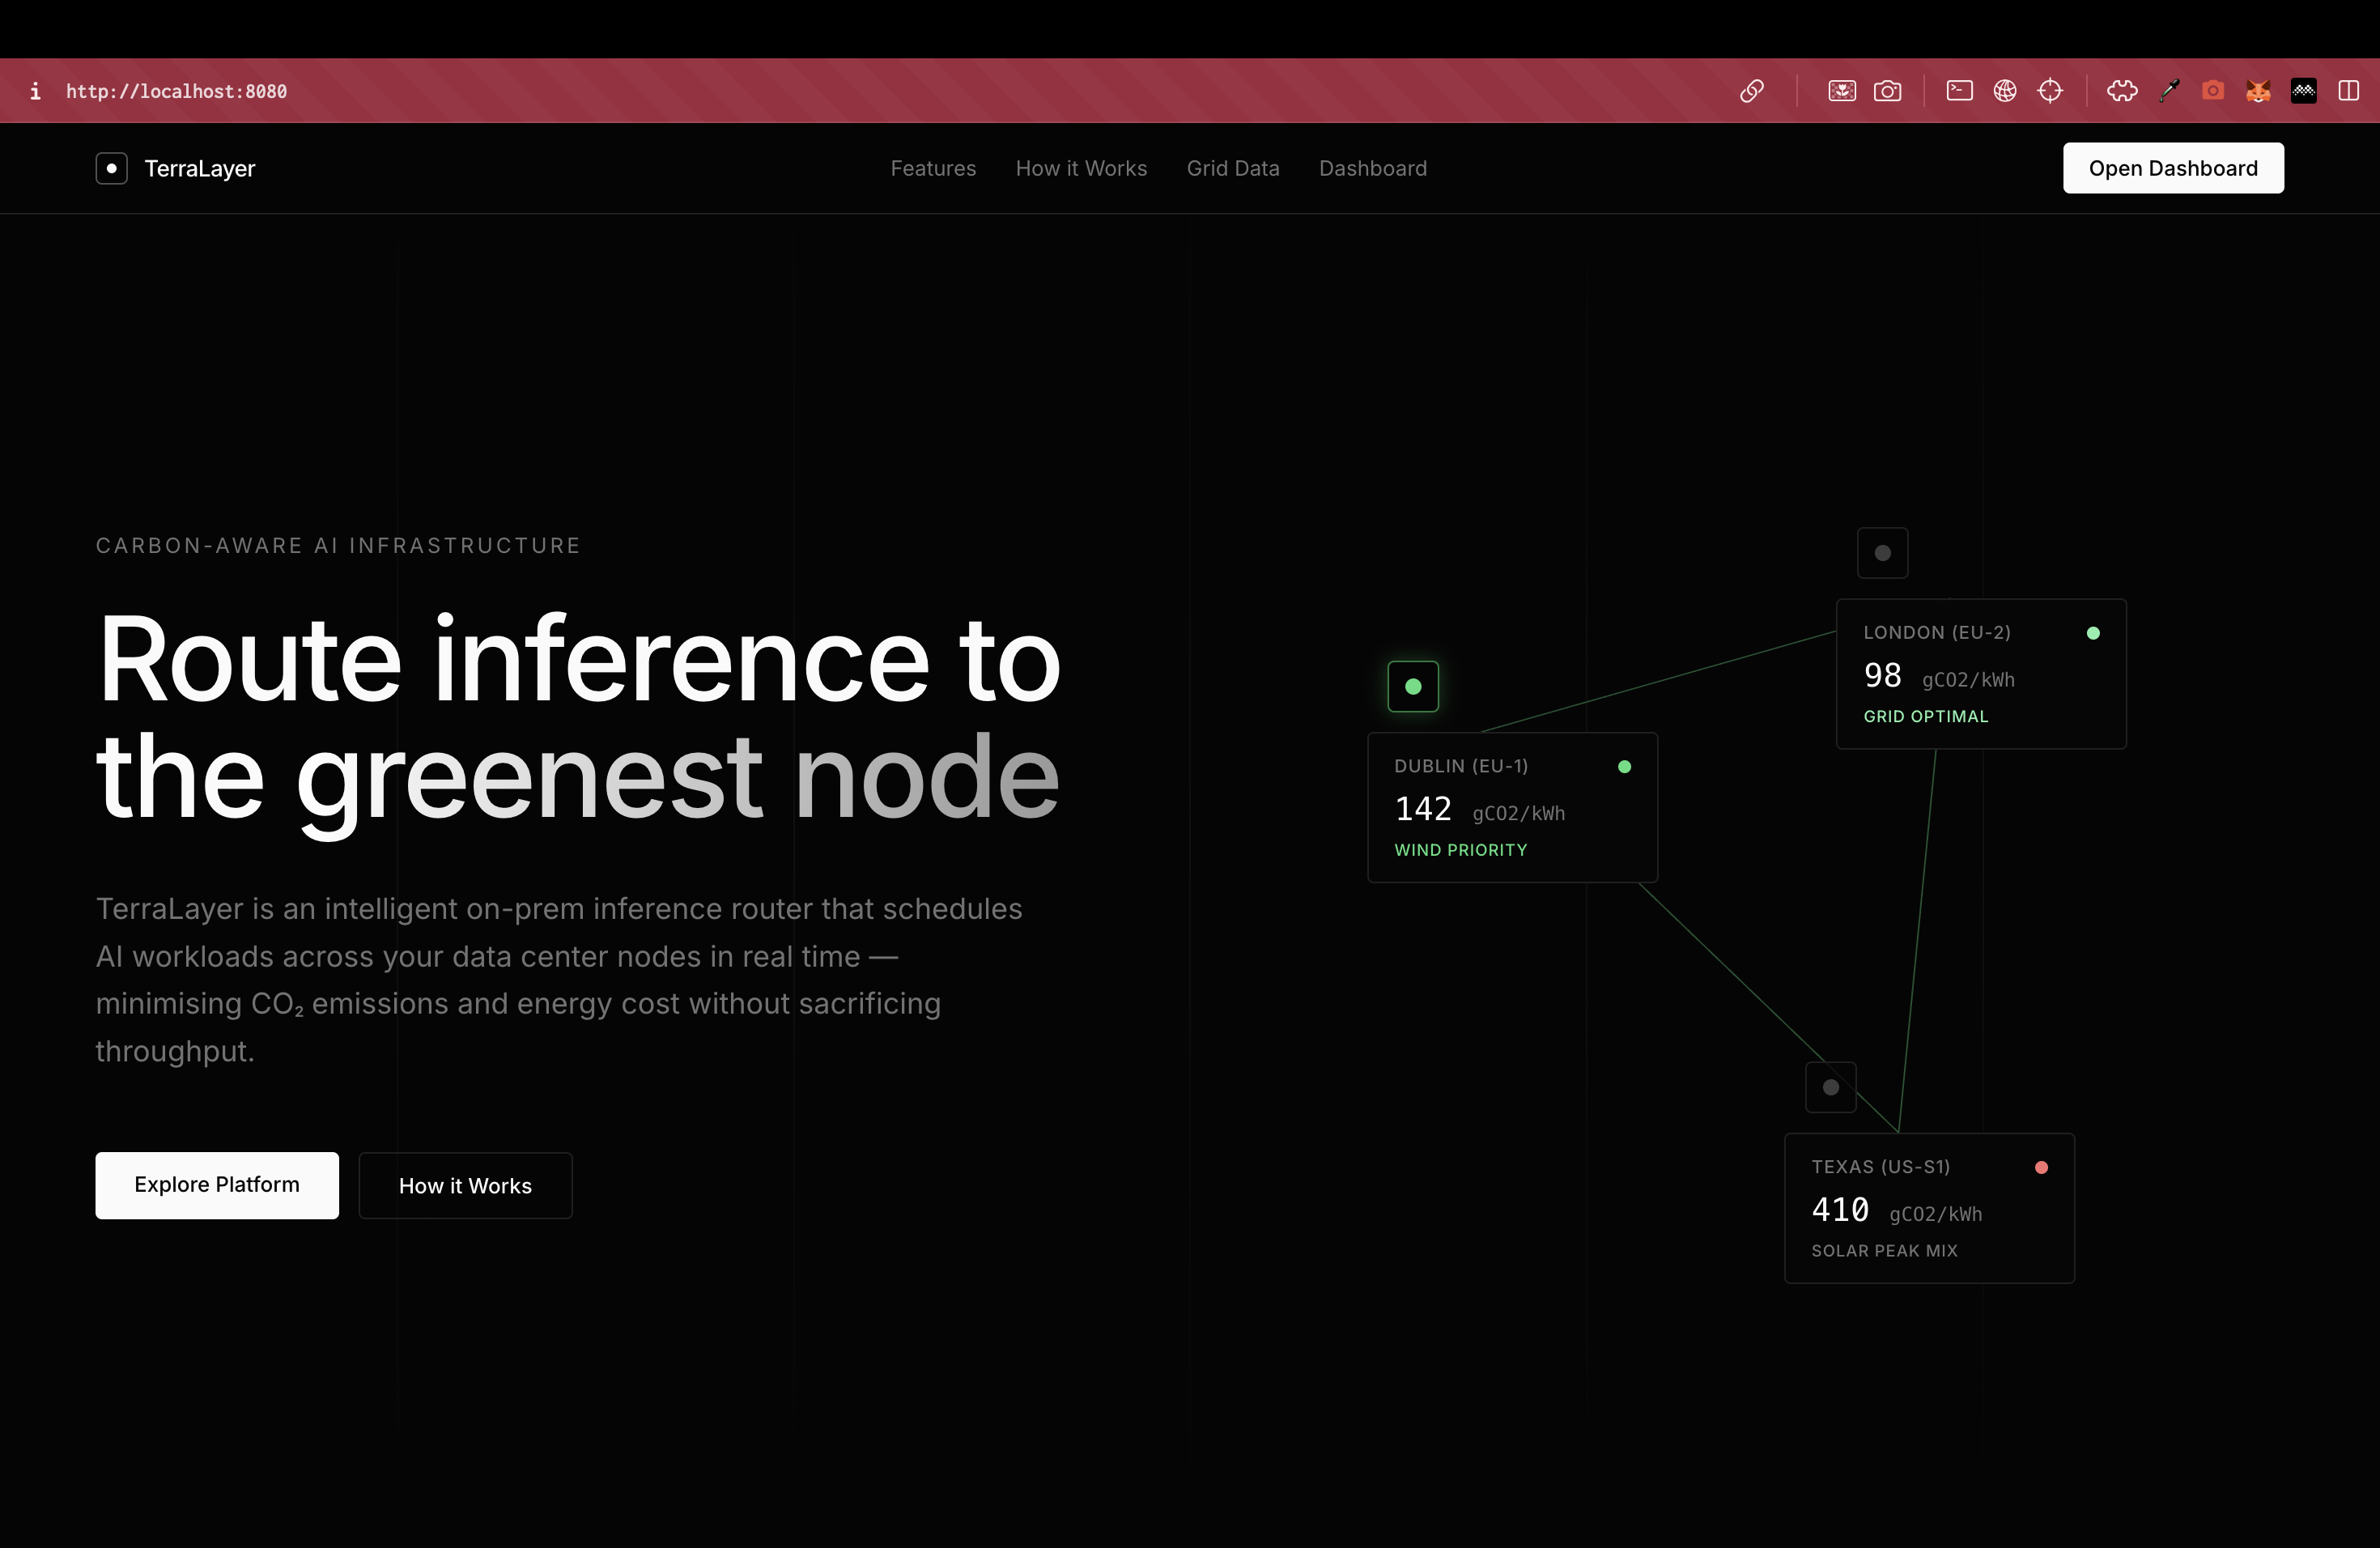
AI compute is one of the fastest-growing sources of carbon emissions, yet most companies only select a cloud region based on price and never think about where their electricity comes from. We wanted to build something that makes the environmental cost of AI training and inference as visible as the dollar cost, and then actually do something about it by routing workloads intelligently. That's where our idea for a datacenter sustainability platform came from.
What it does
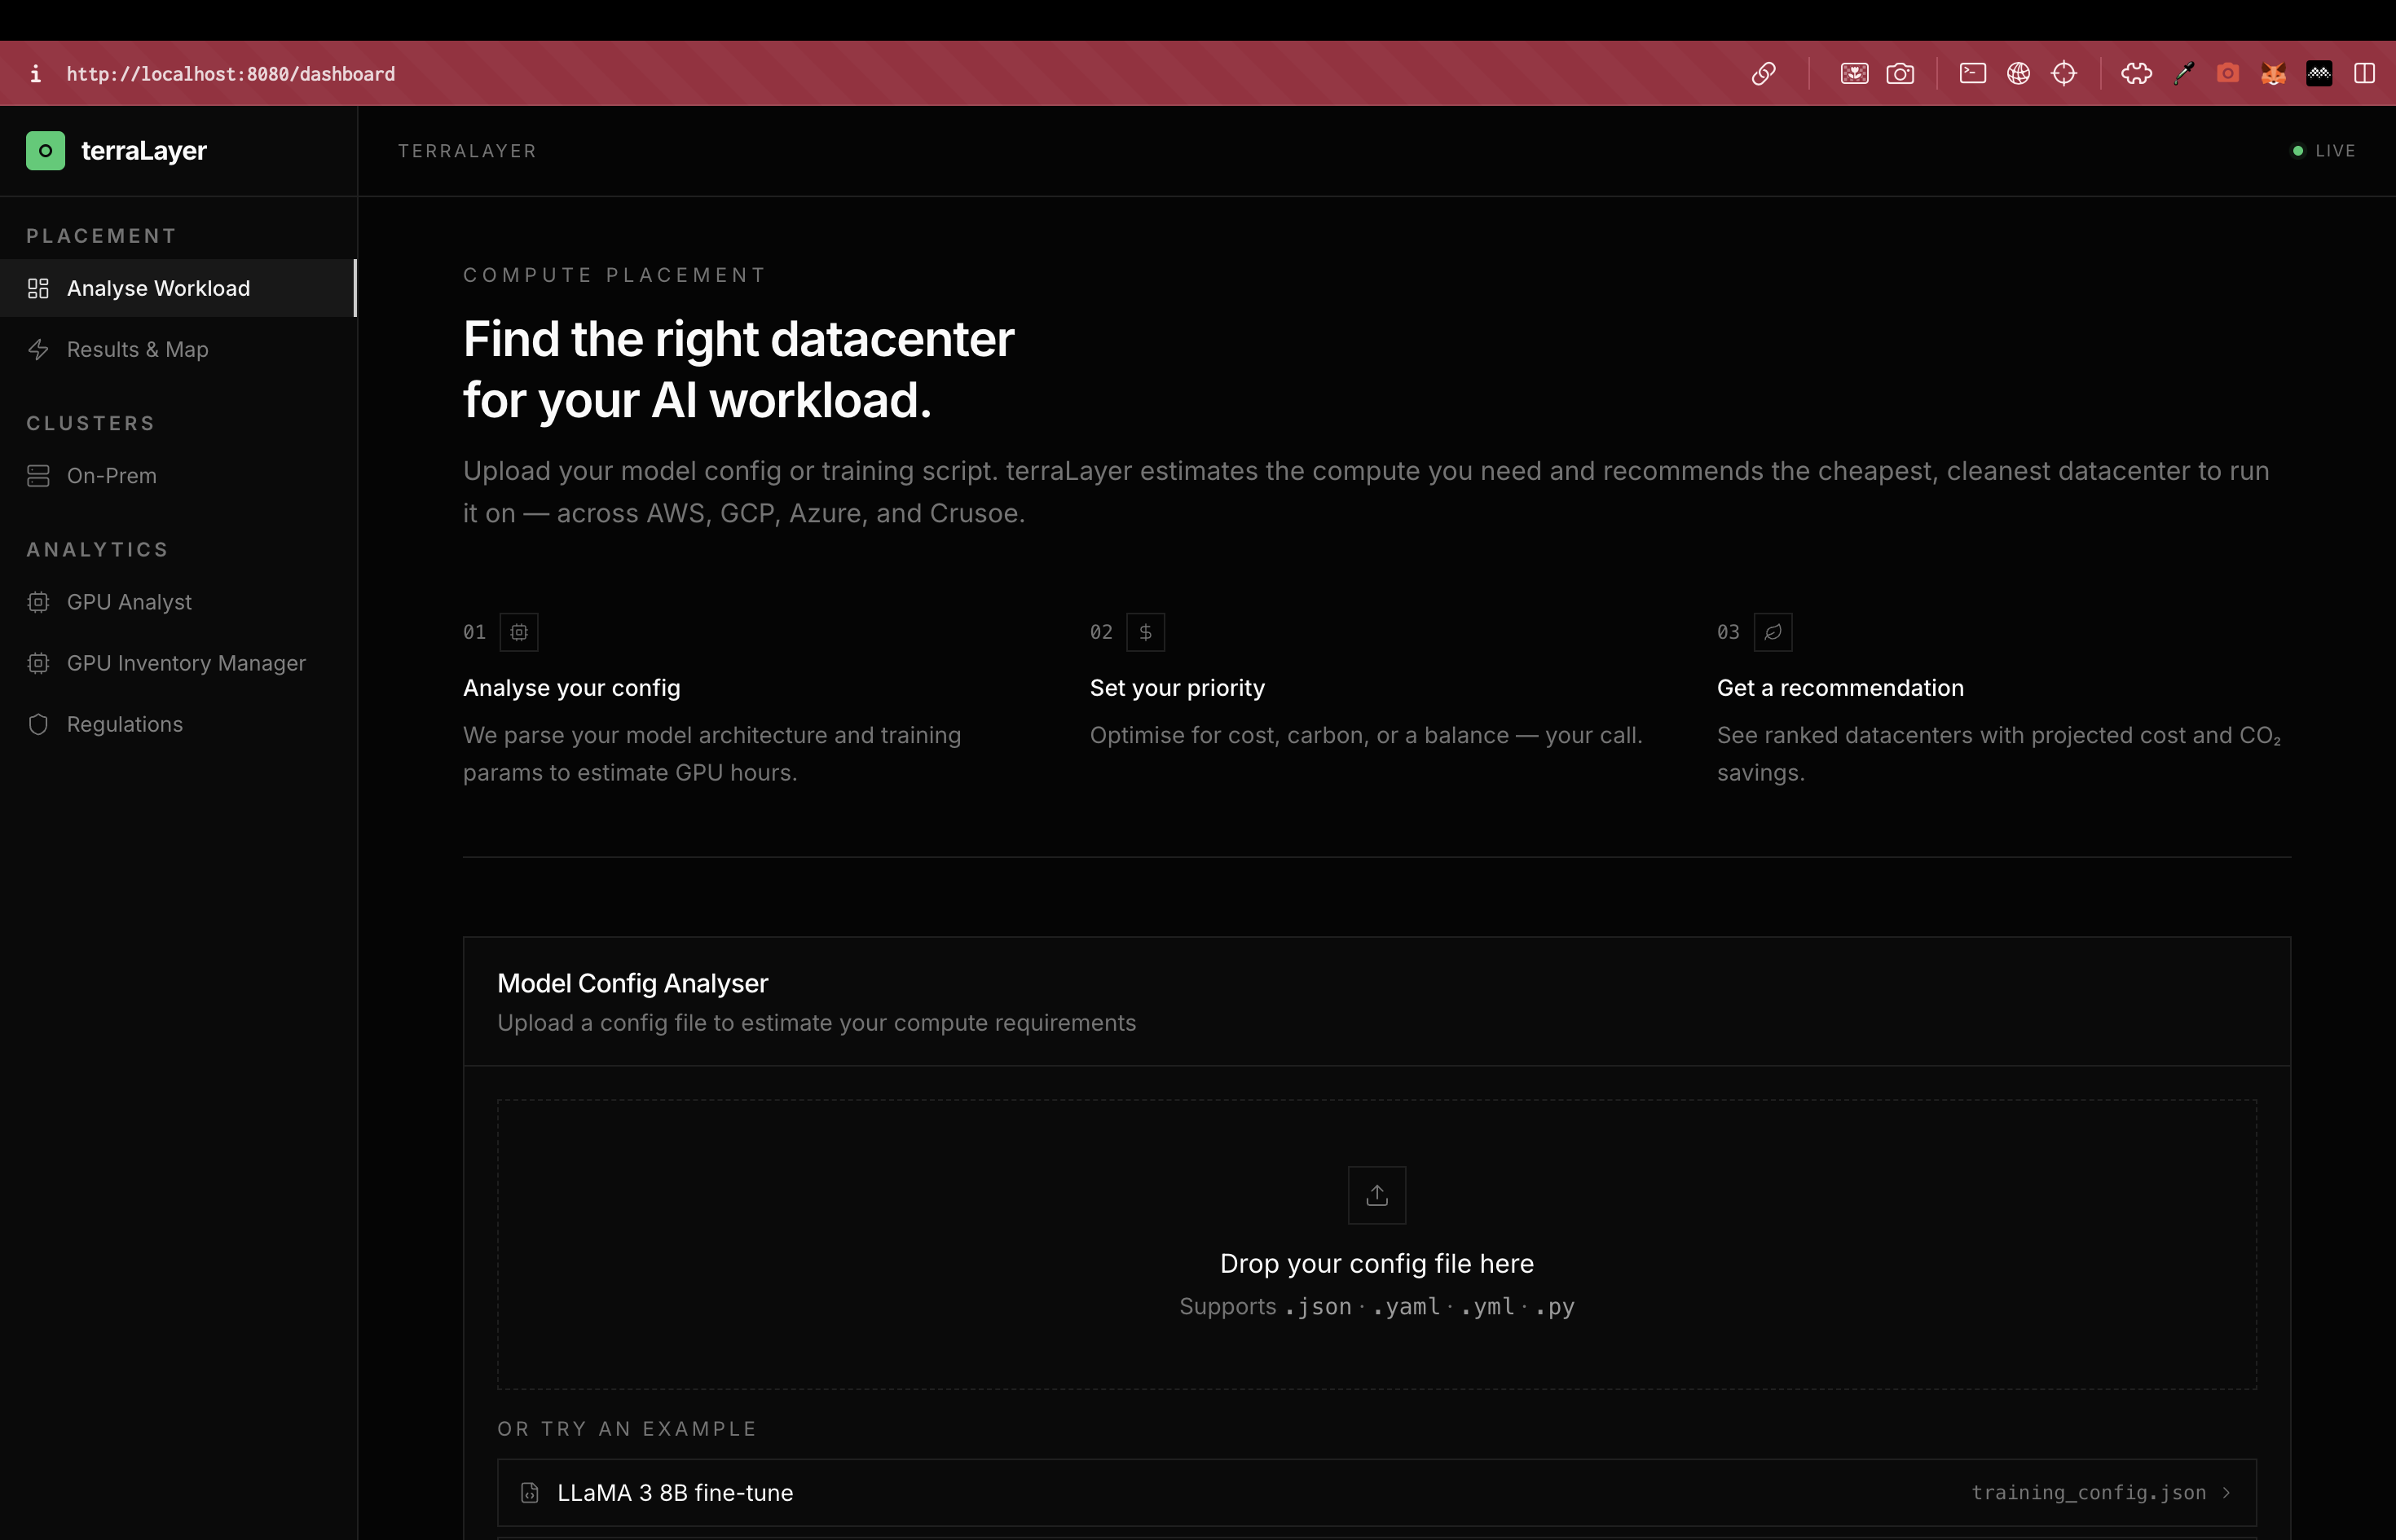
Our platform, terraLayer analyzes an AI workload (e.g. a 13B LLM running at a certain QPS) and estimates the following:
- GPU hours required
- Energy consumption
- Carbon emissions
- Cost across different cloud regions
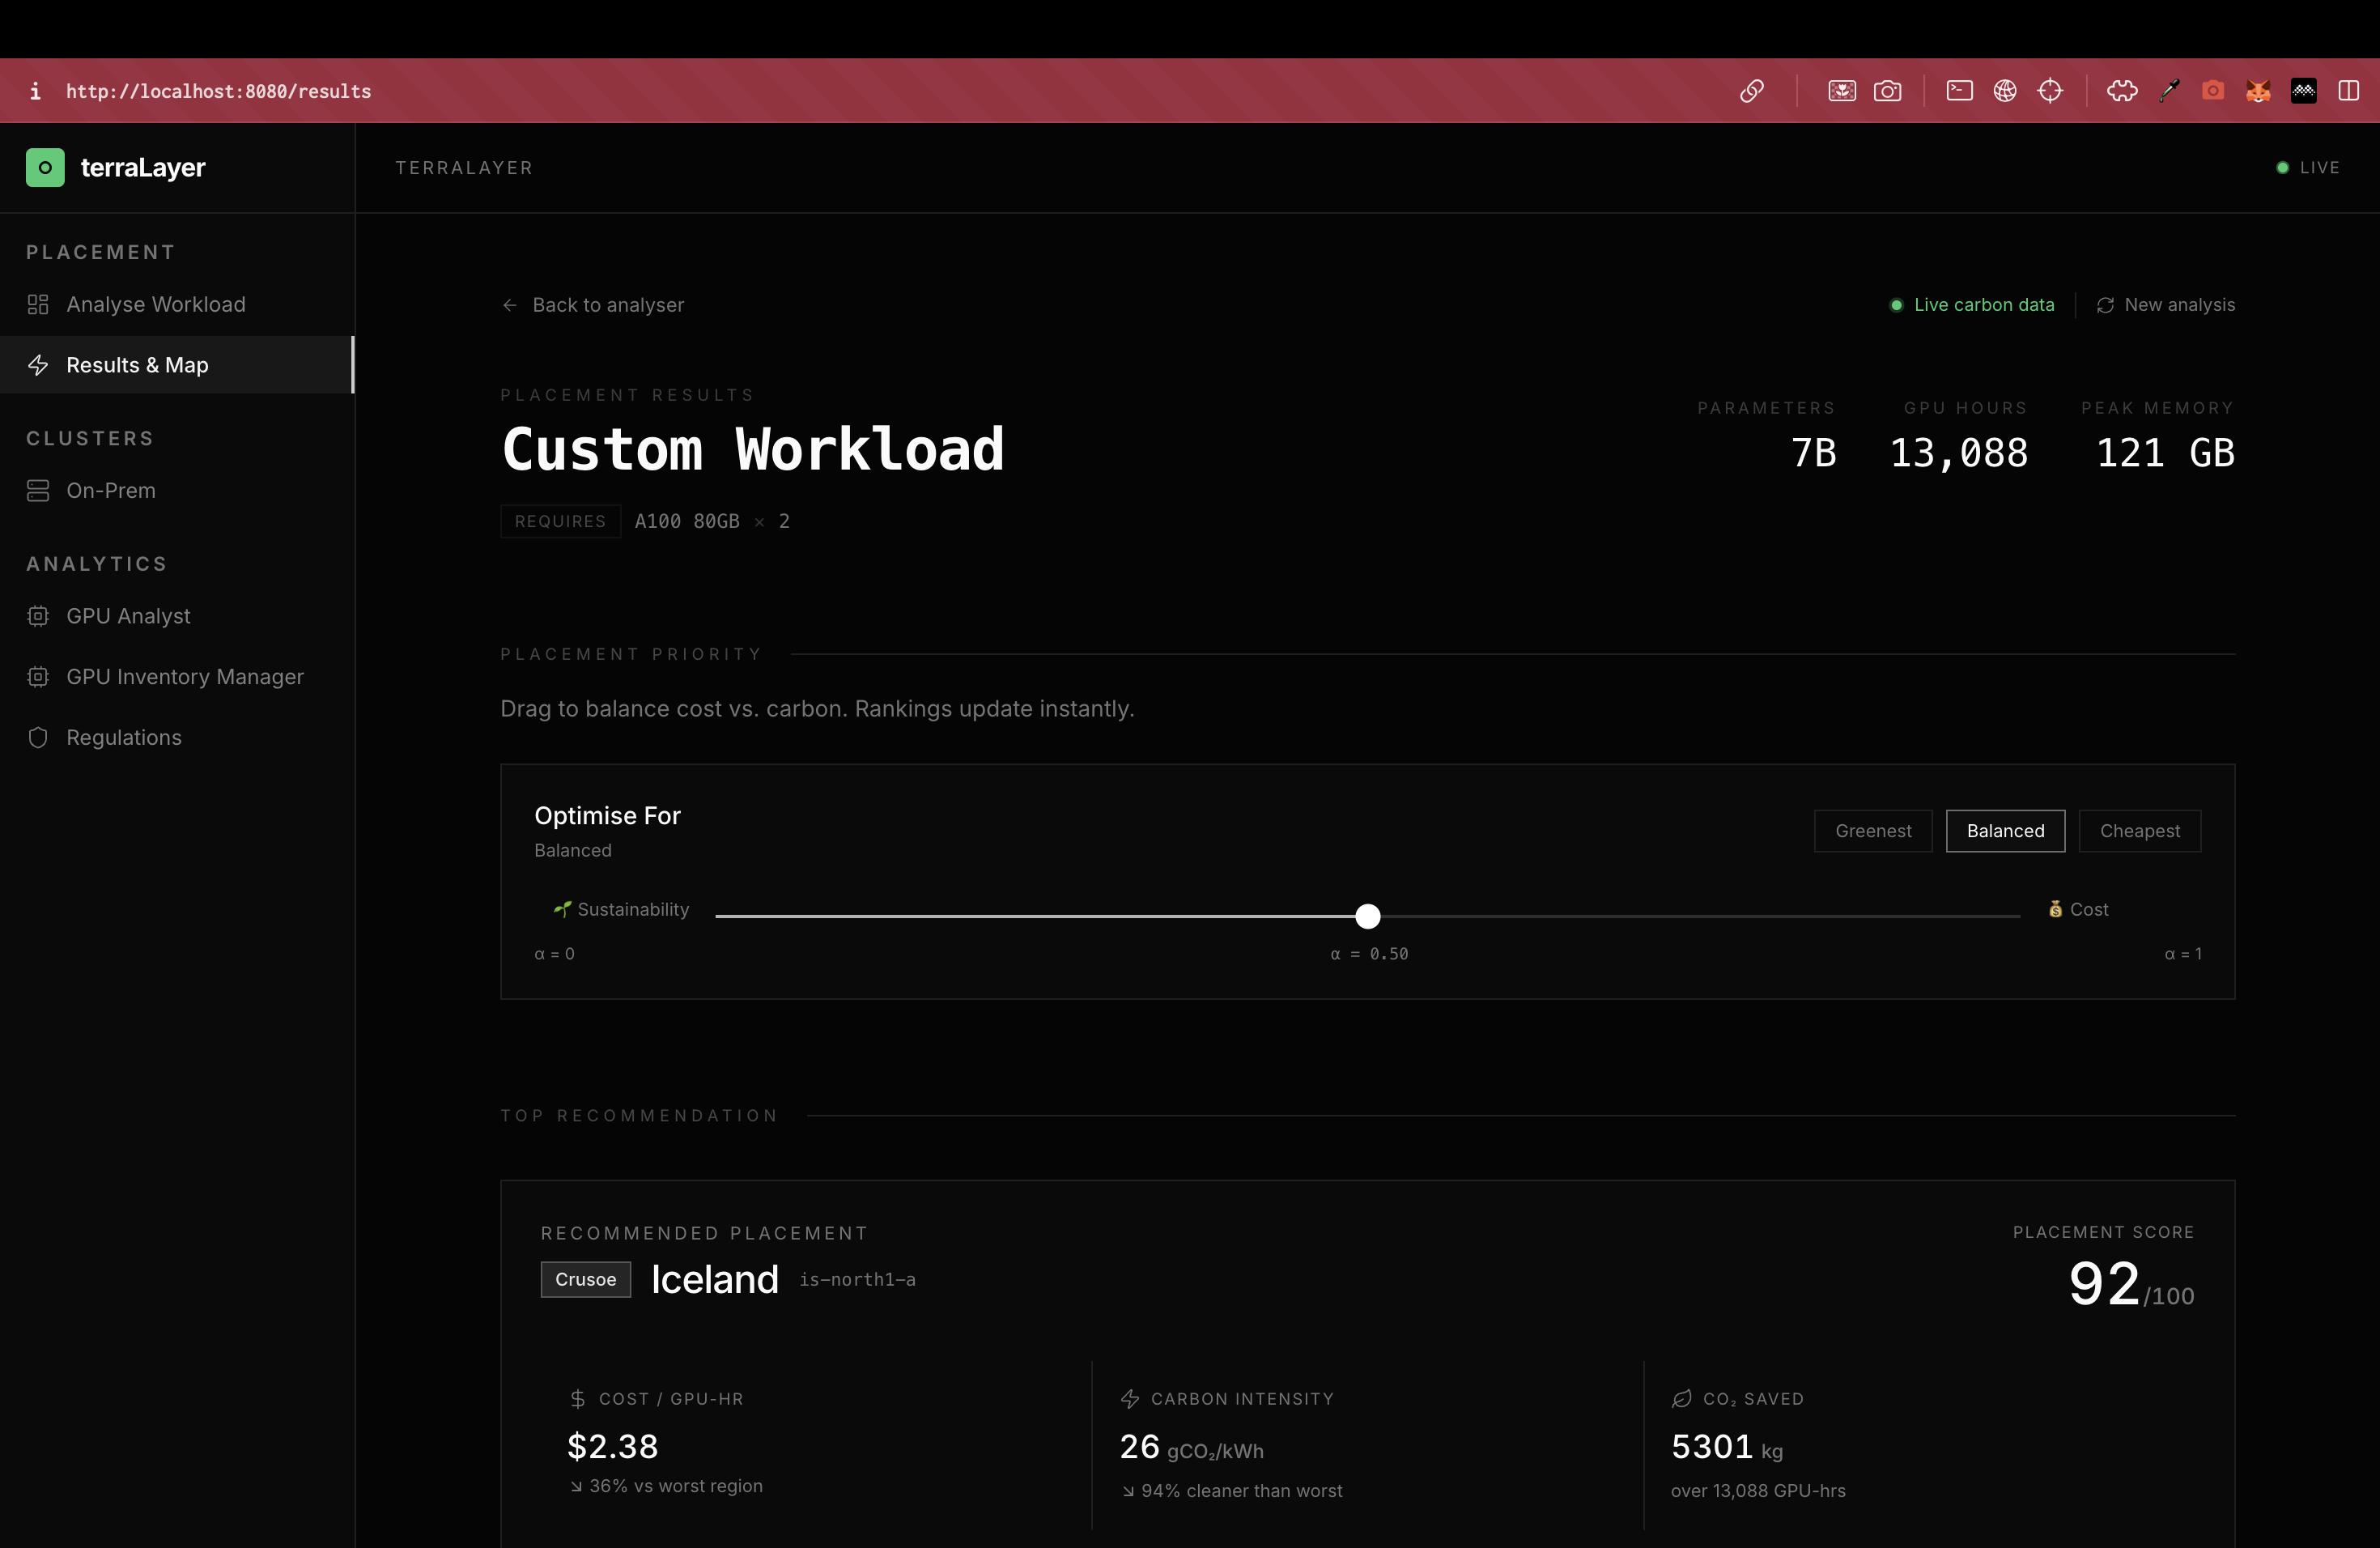
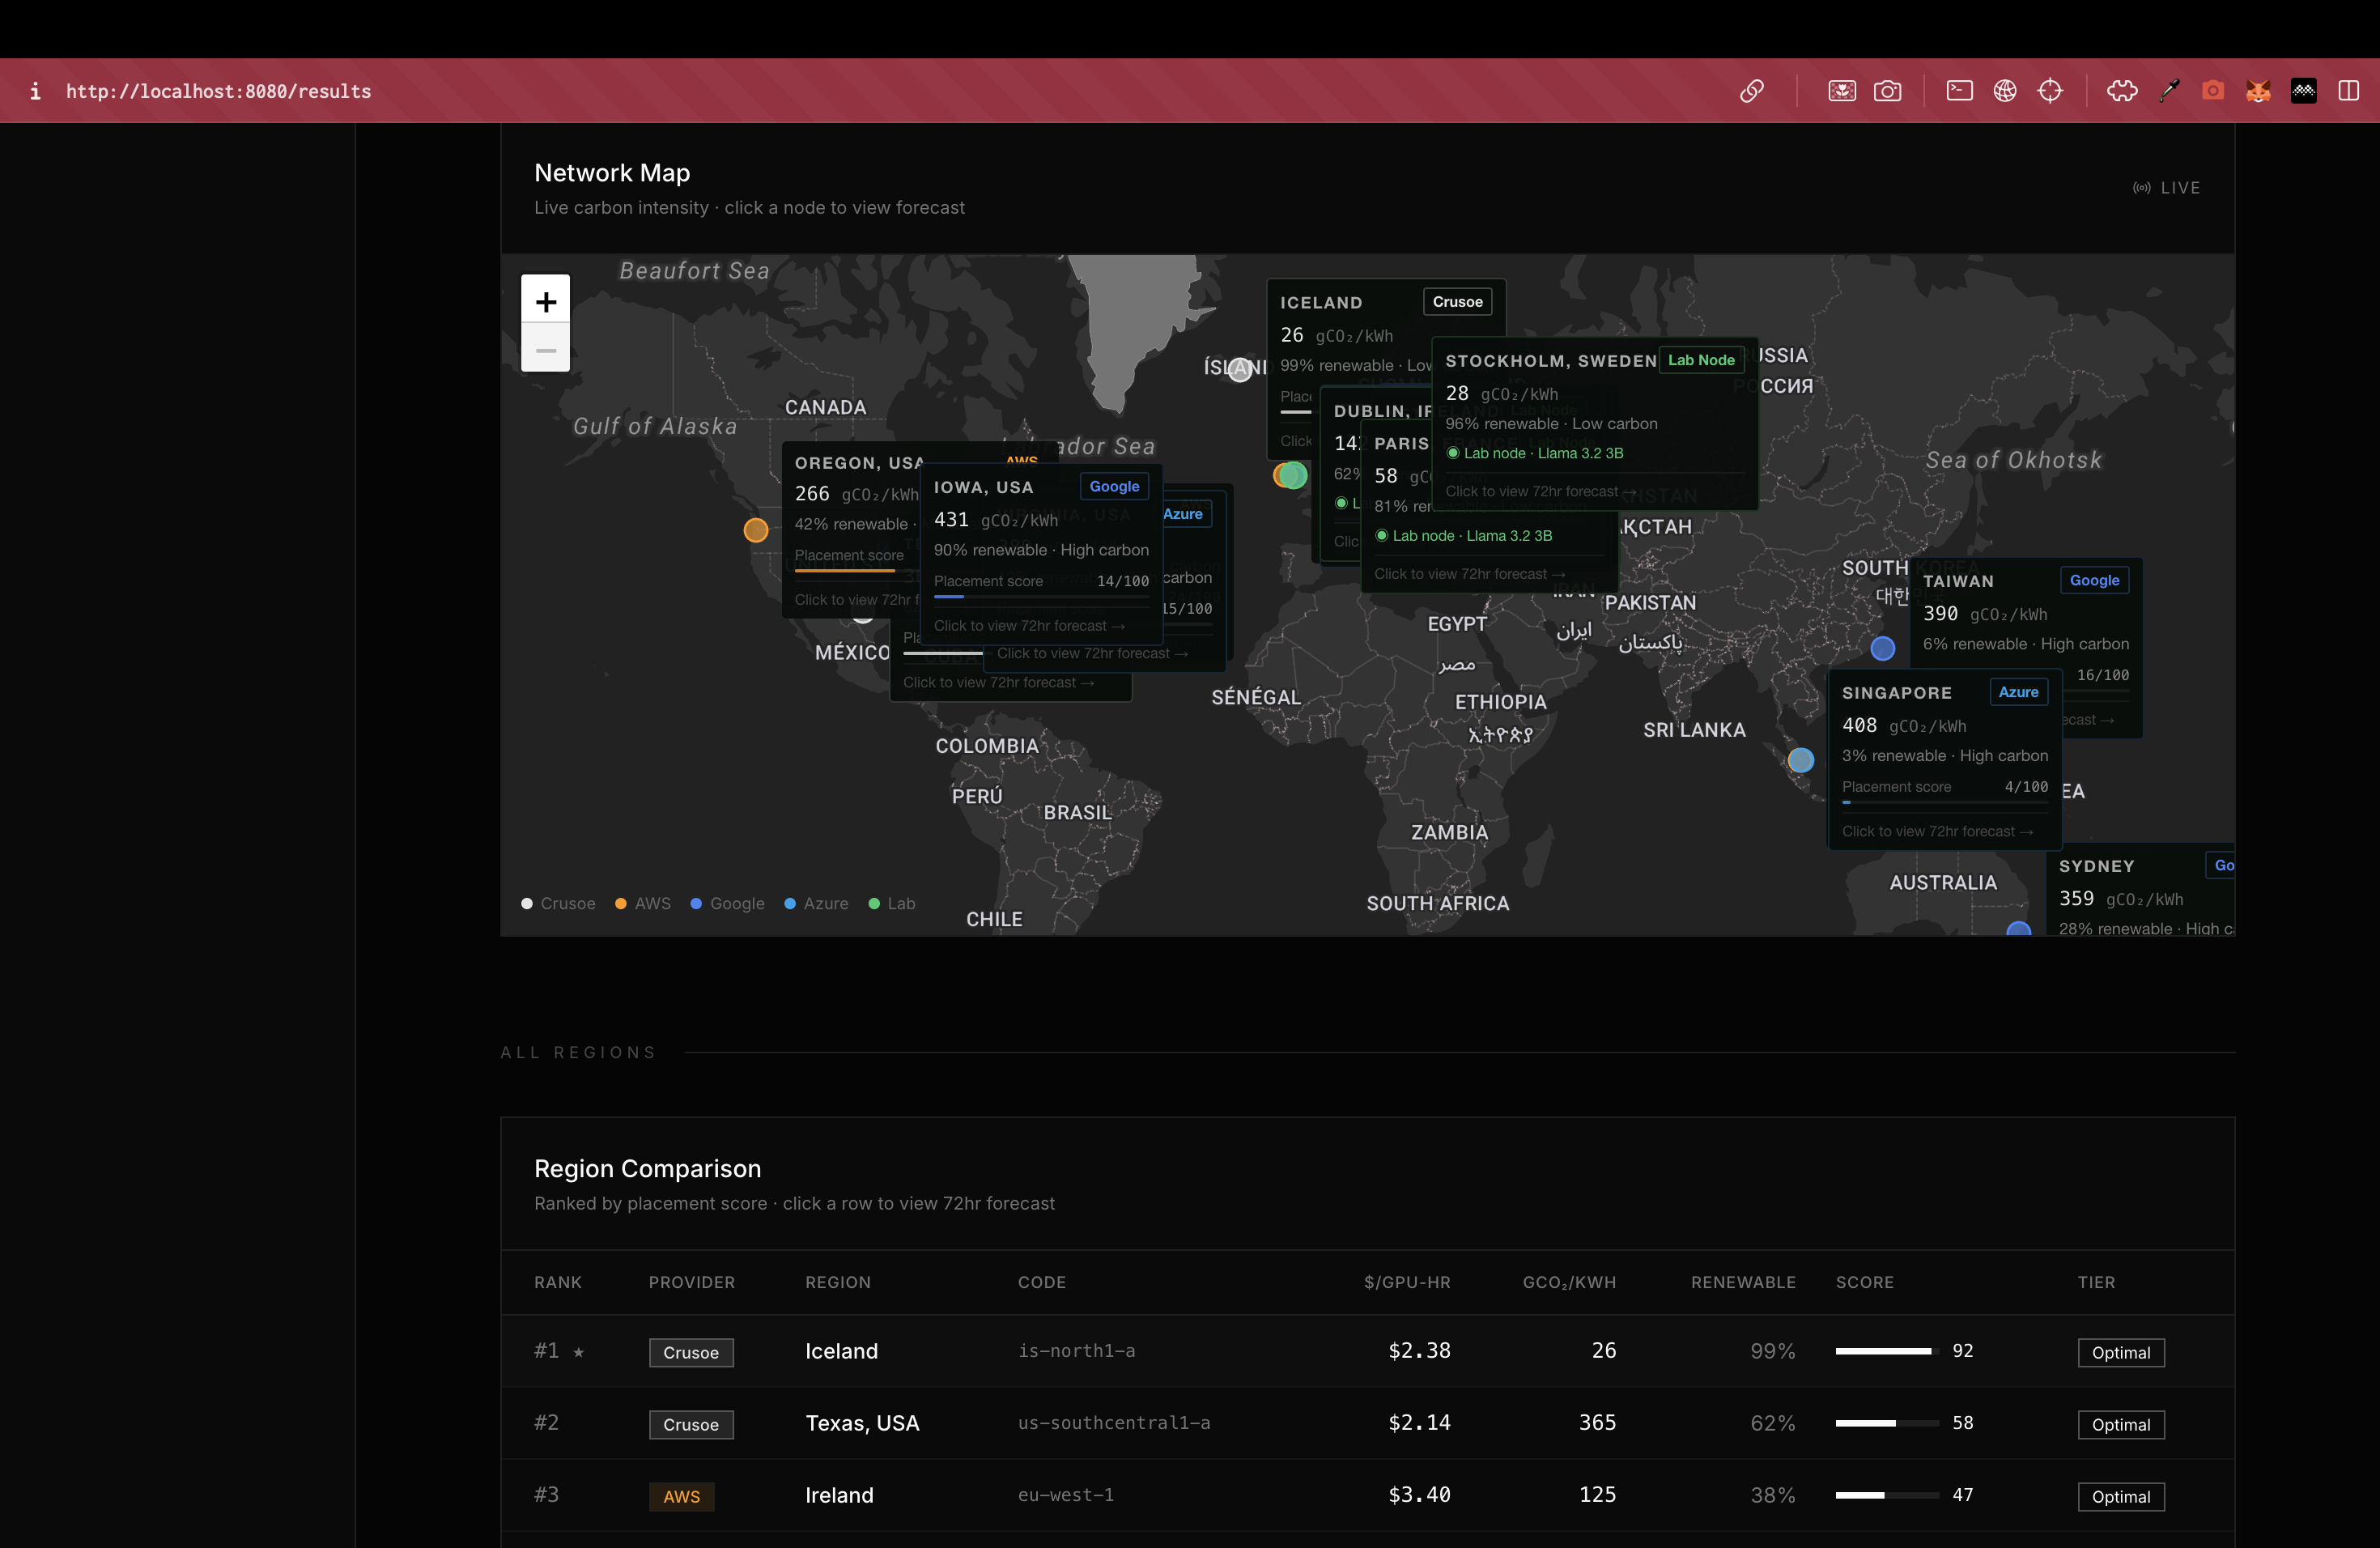
We compare major regions from providers like Amazon Web Services, Google Cloud, Microsoft Azure, and Crusoe Energy. Instead of just showing prices, we rank regions based on a combination of cost and carbon intensity. Users can adjust their optimization preference and instantly see how the recommended region changes. In short, we help AI teams decide where to run their workloads in a more sustainable way.
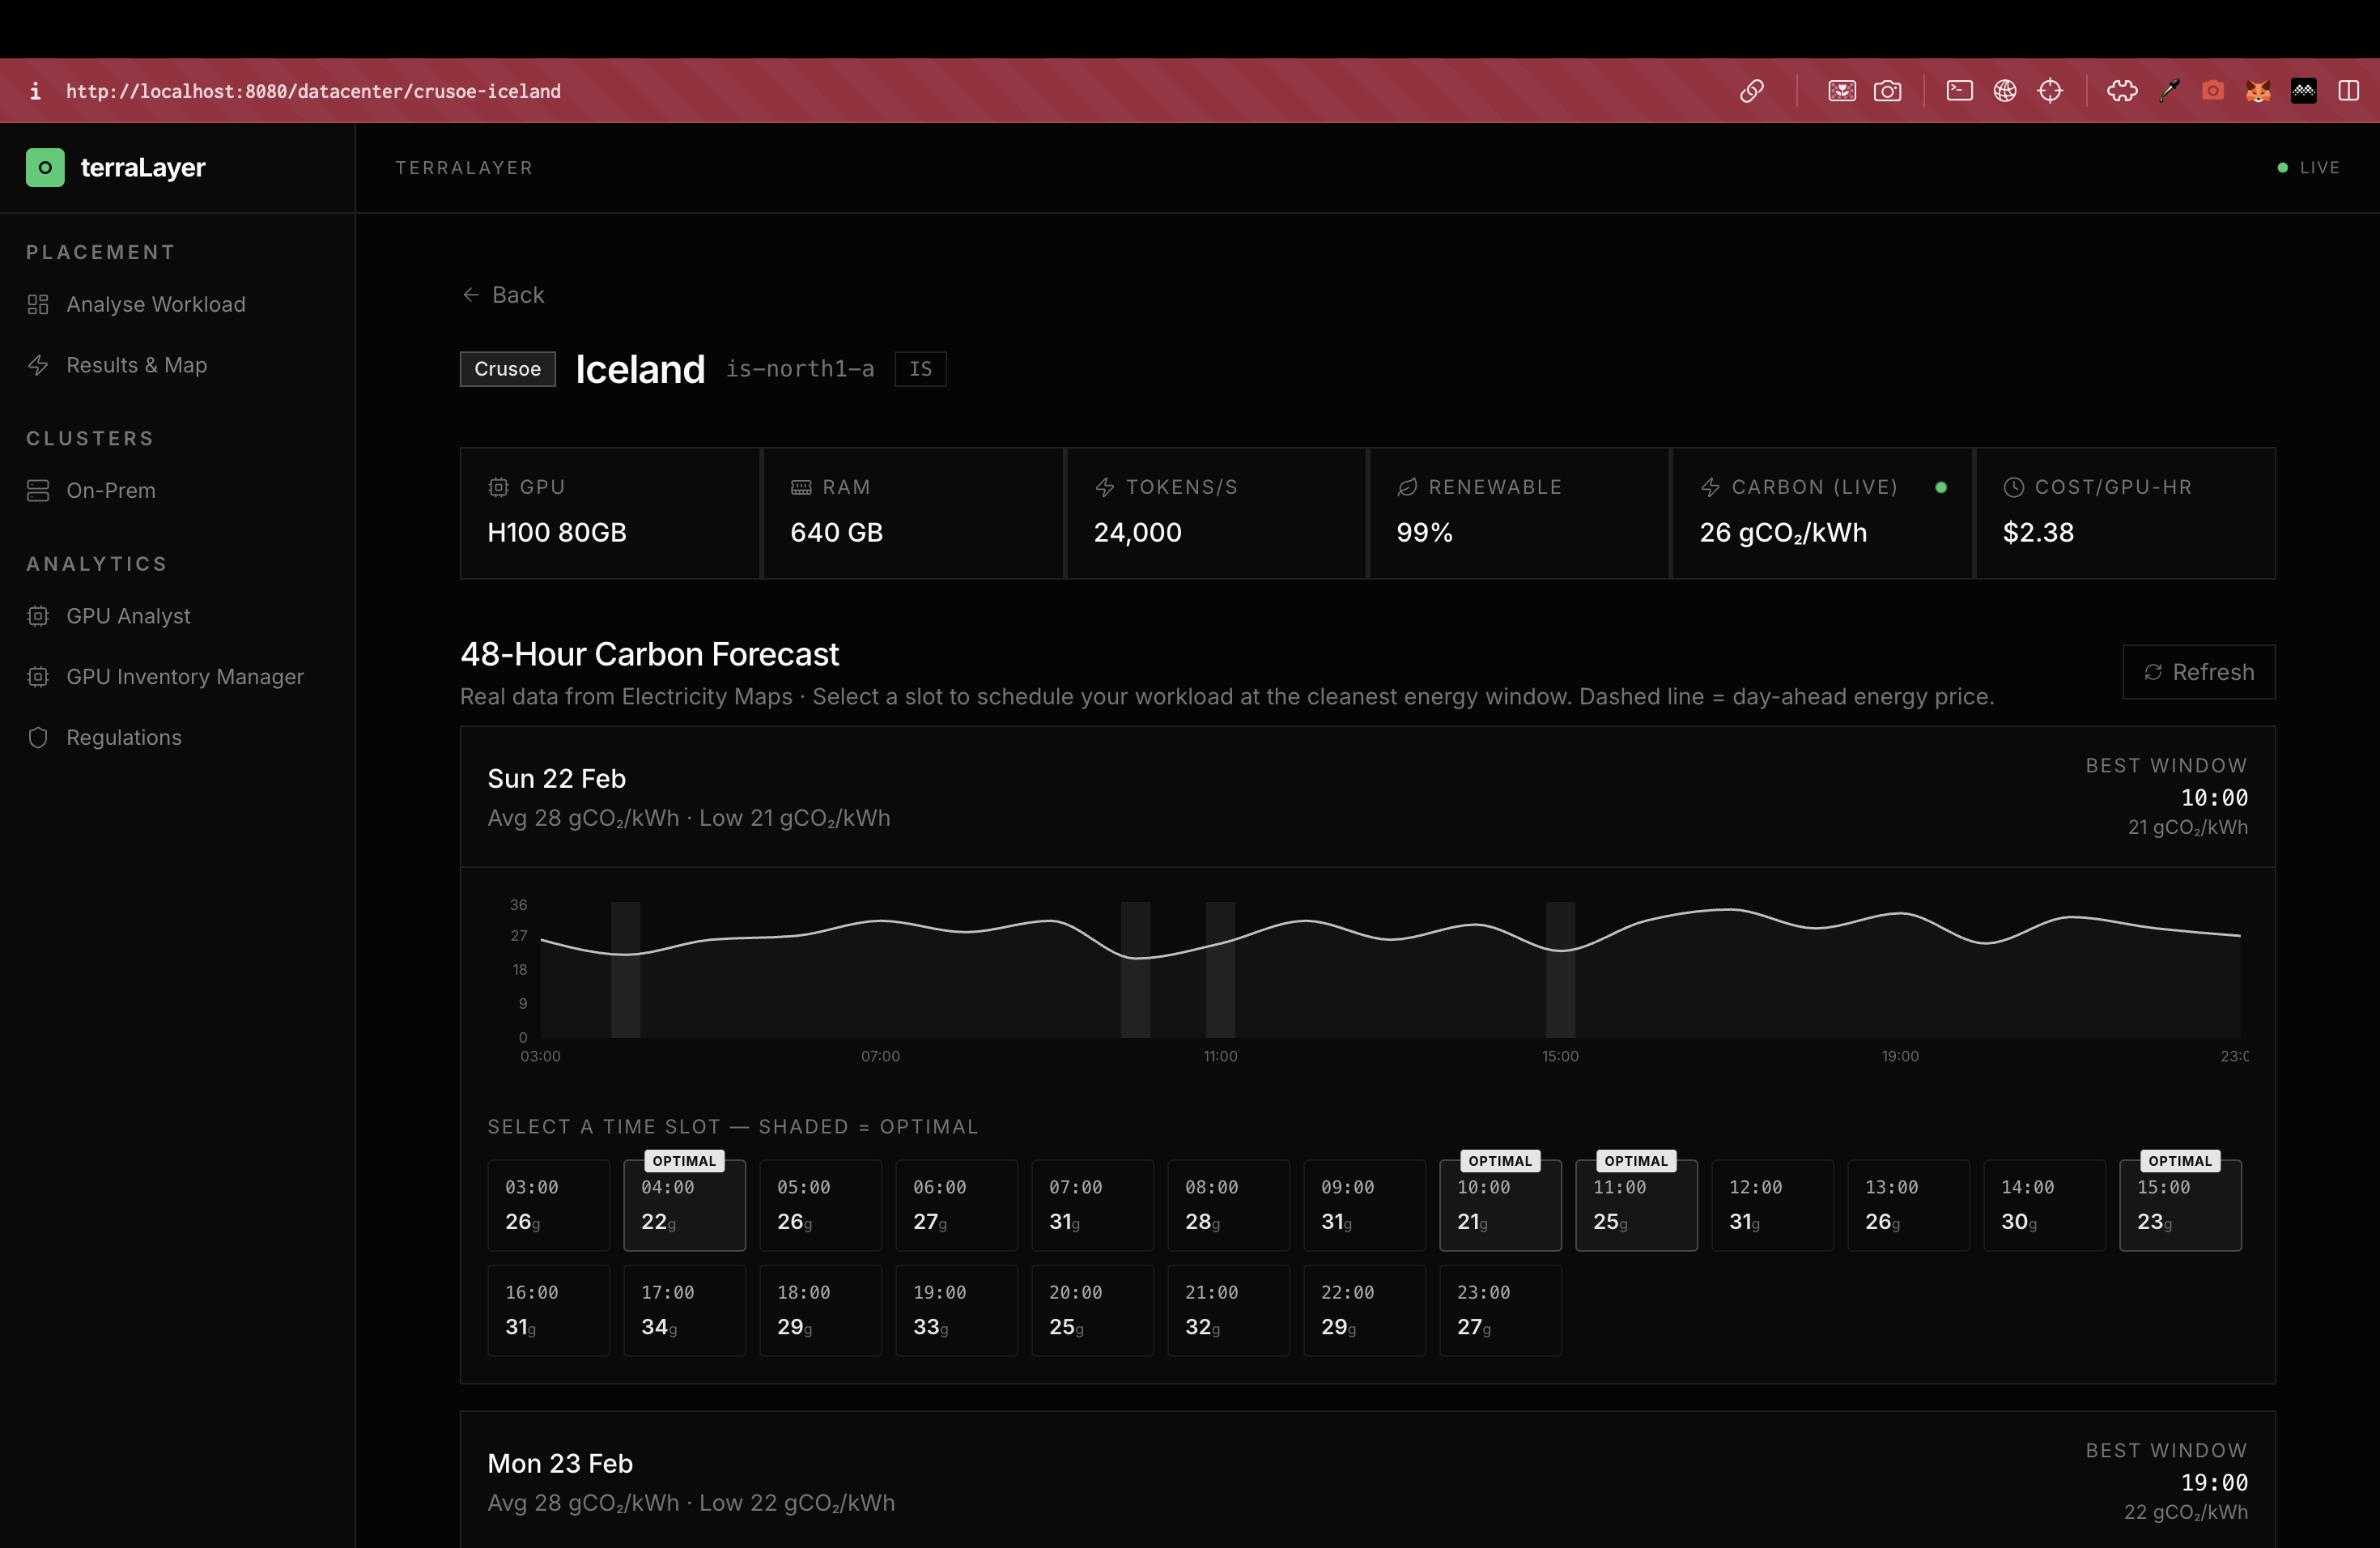
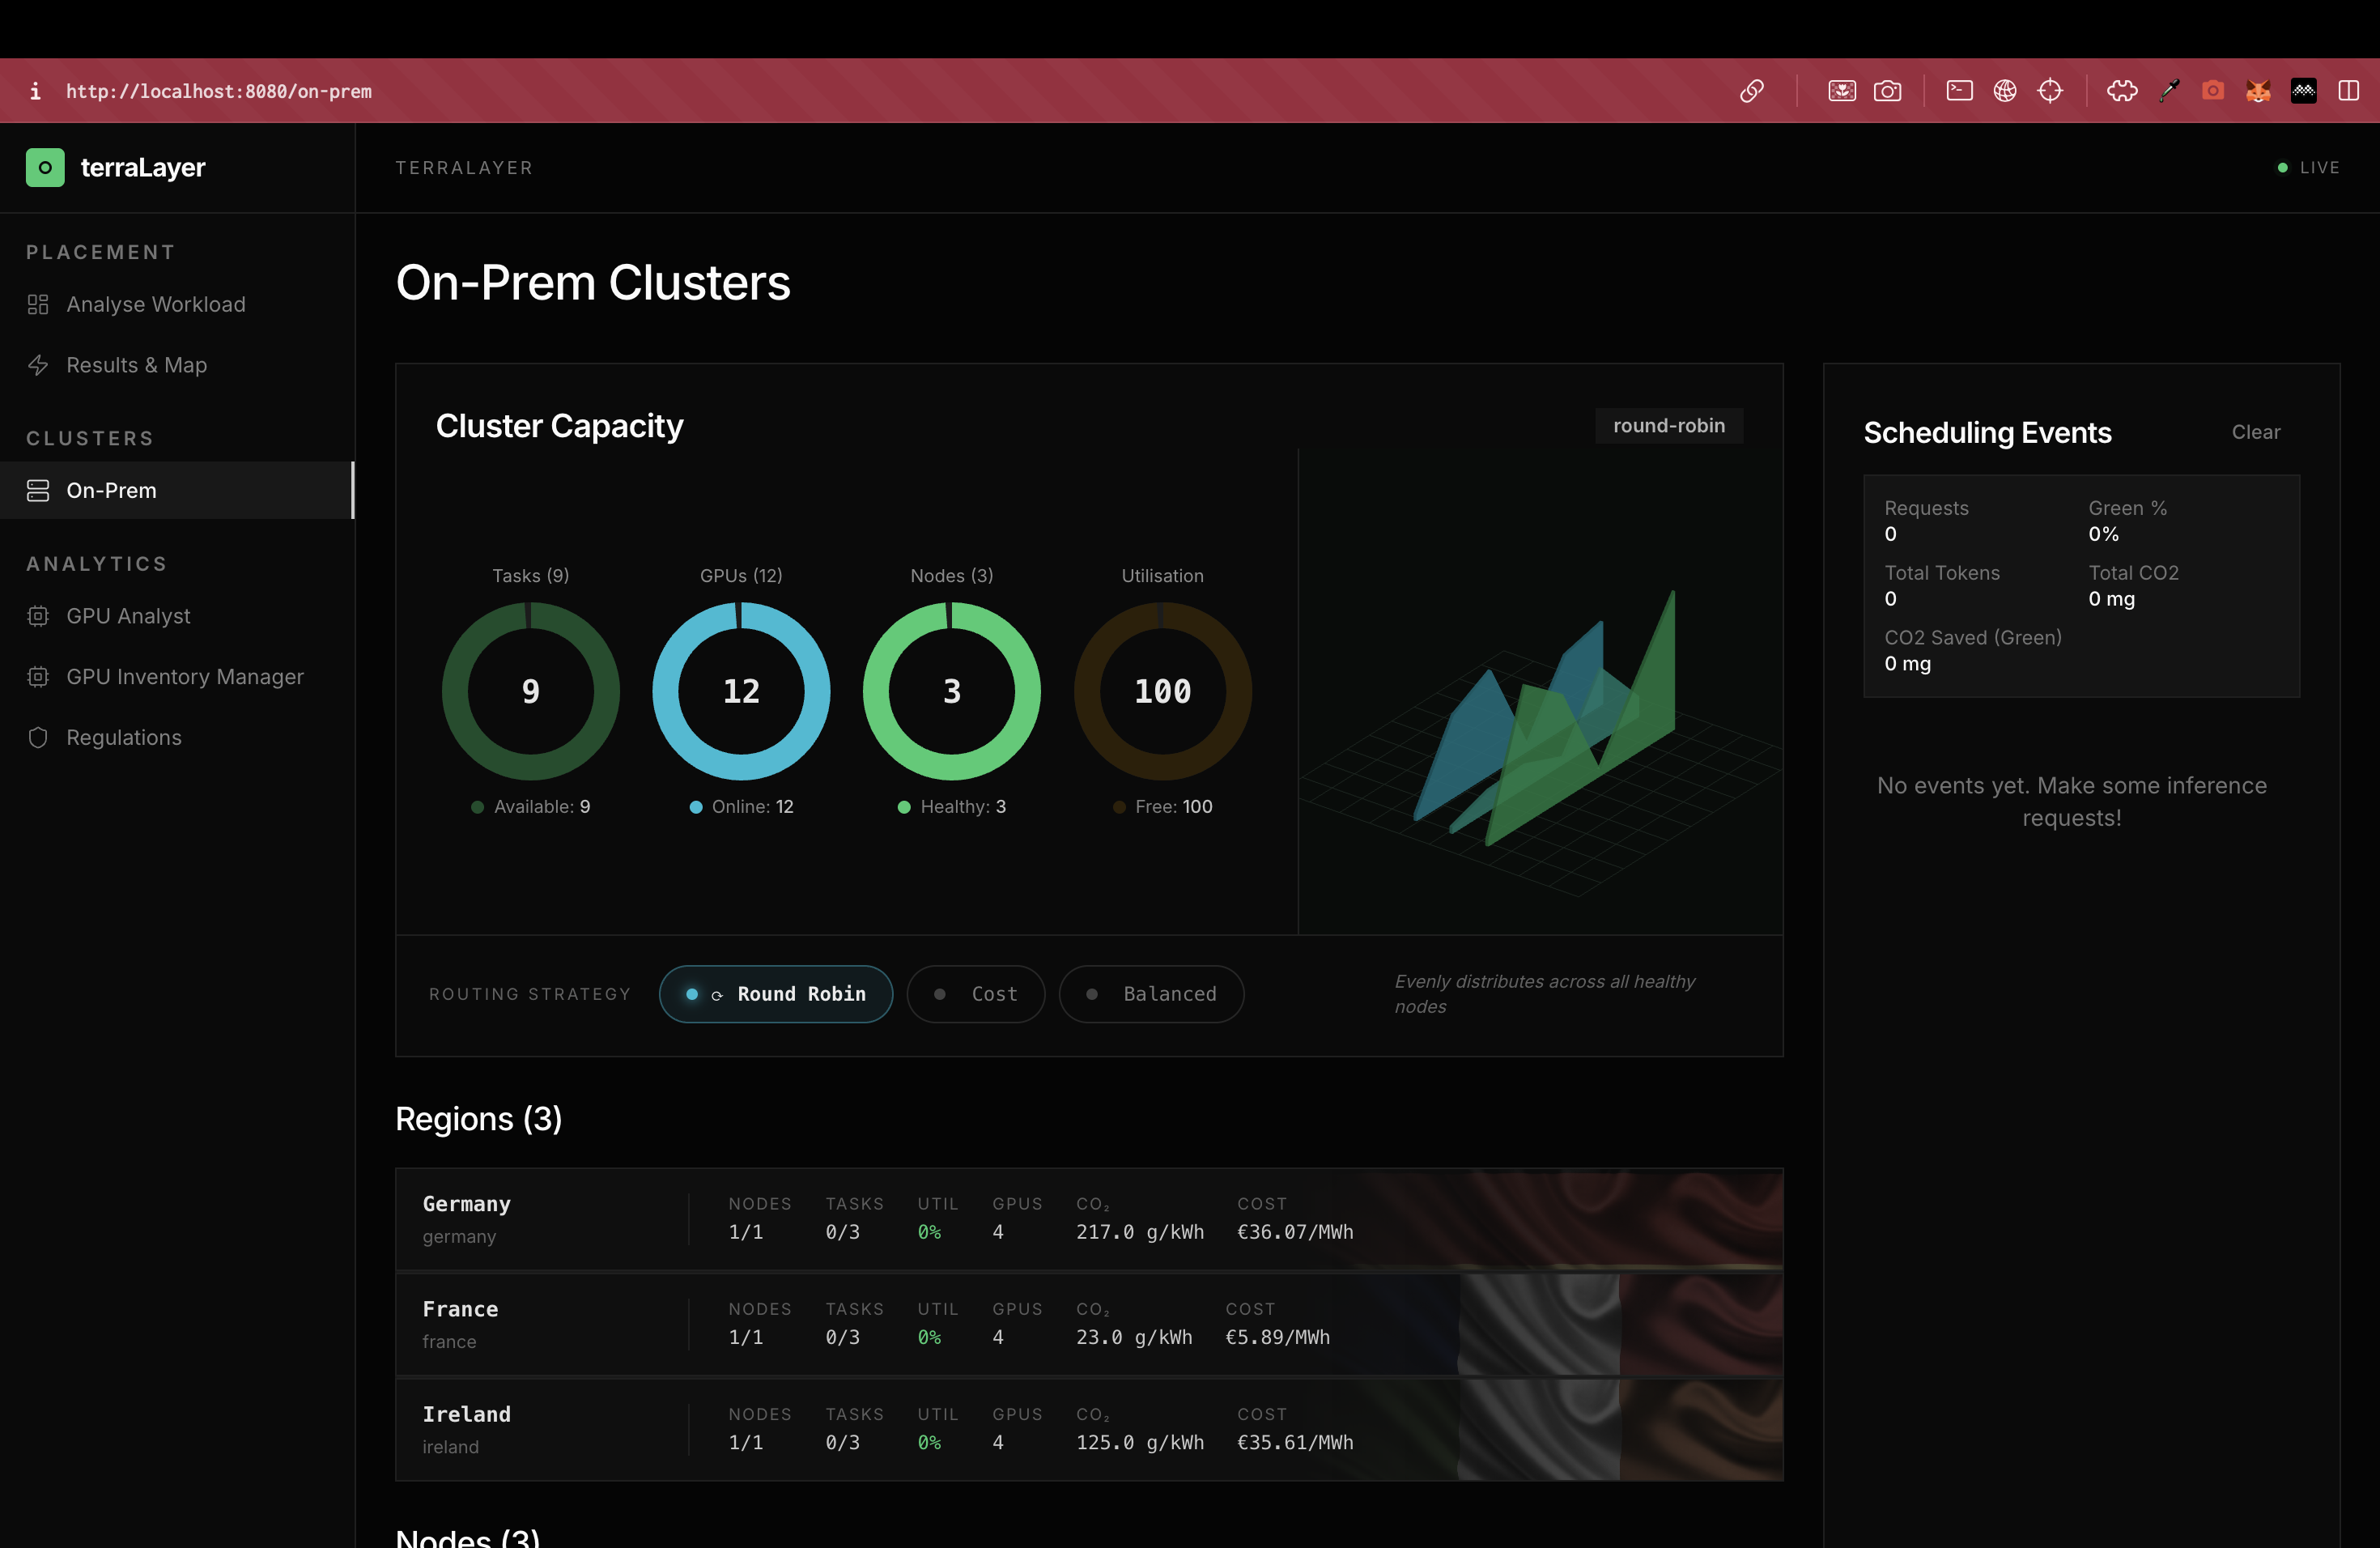
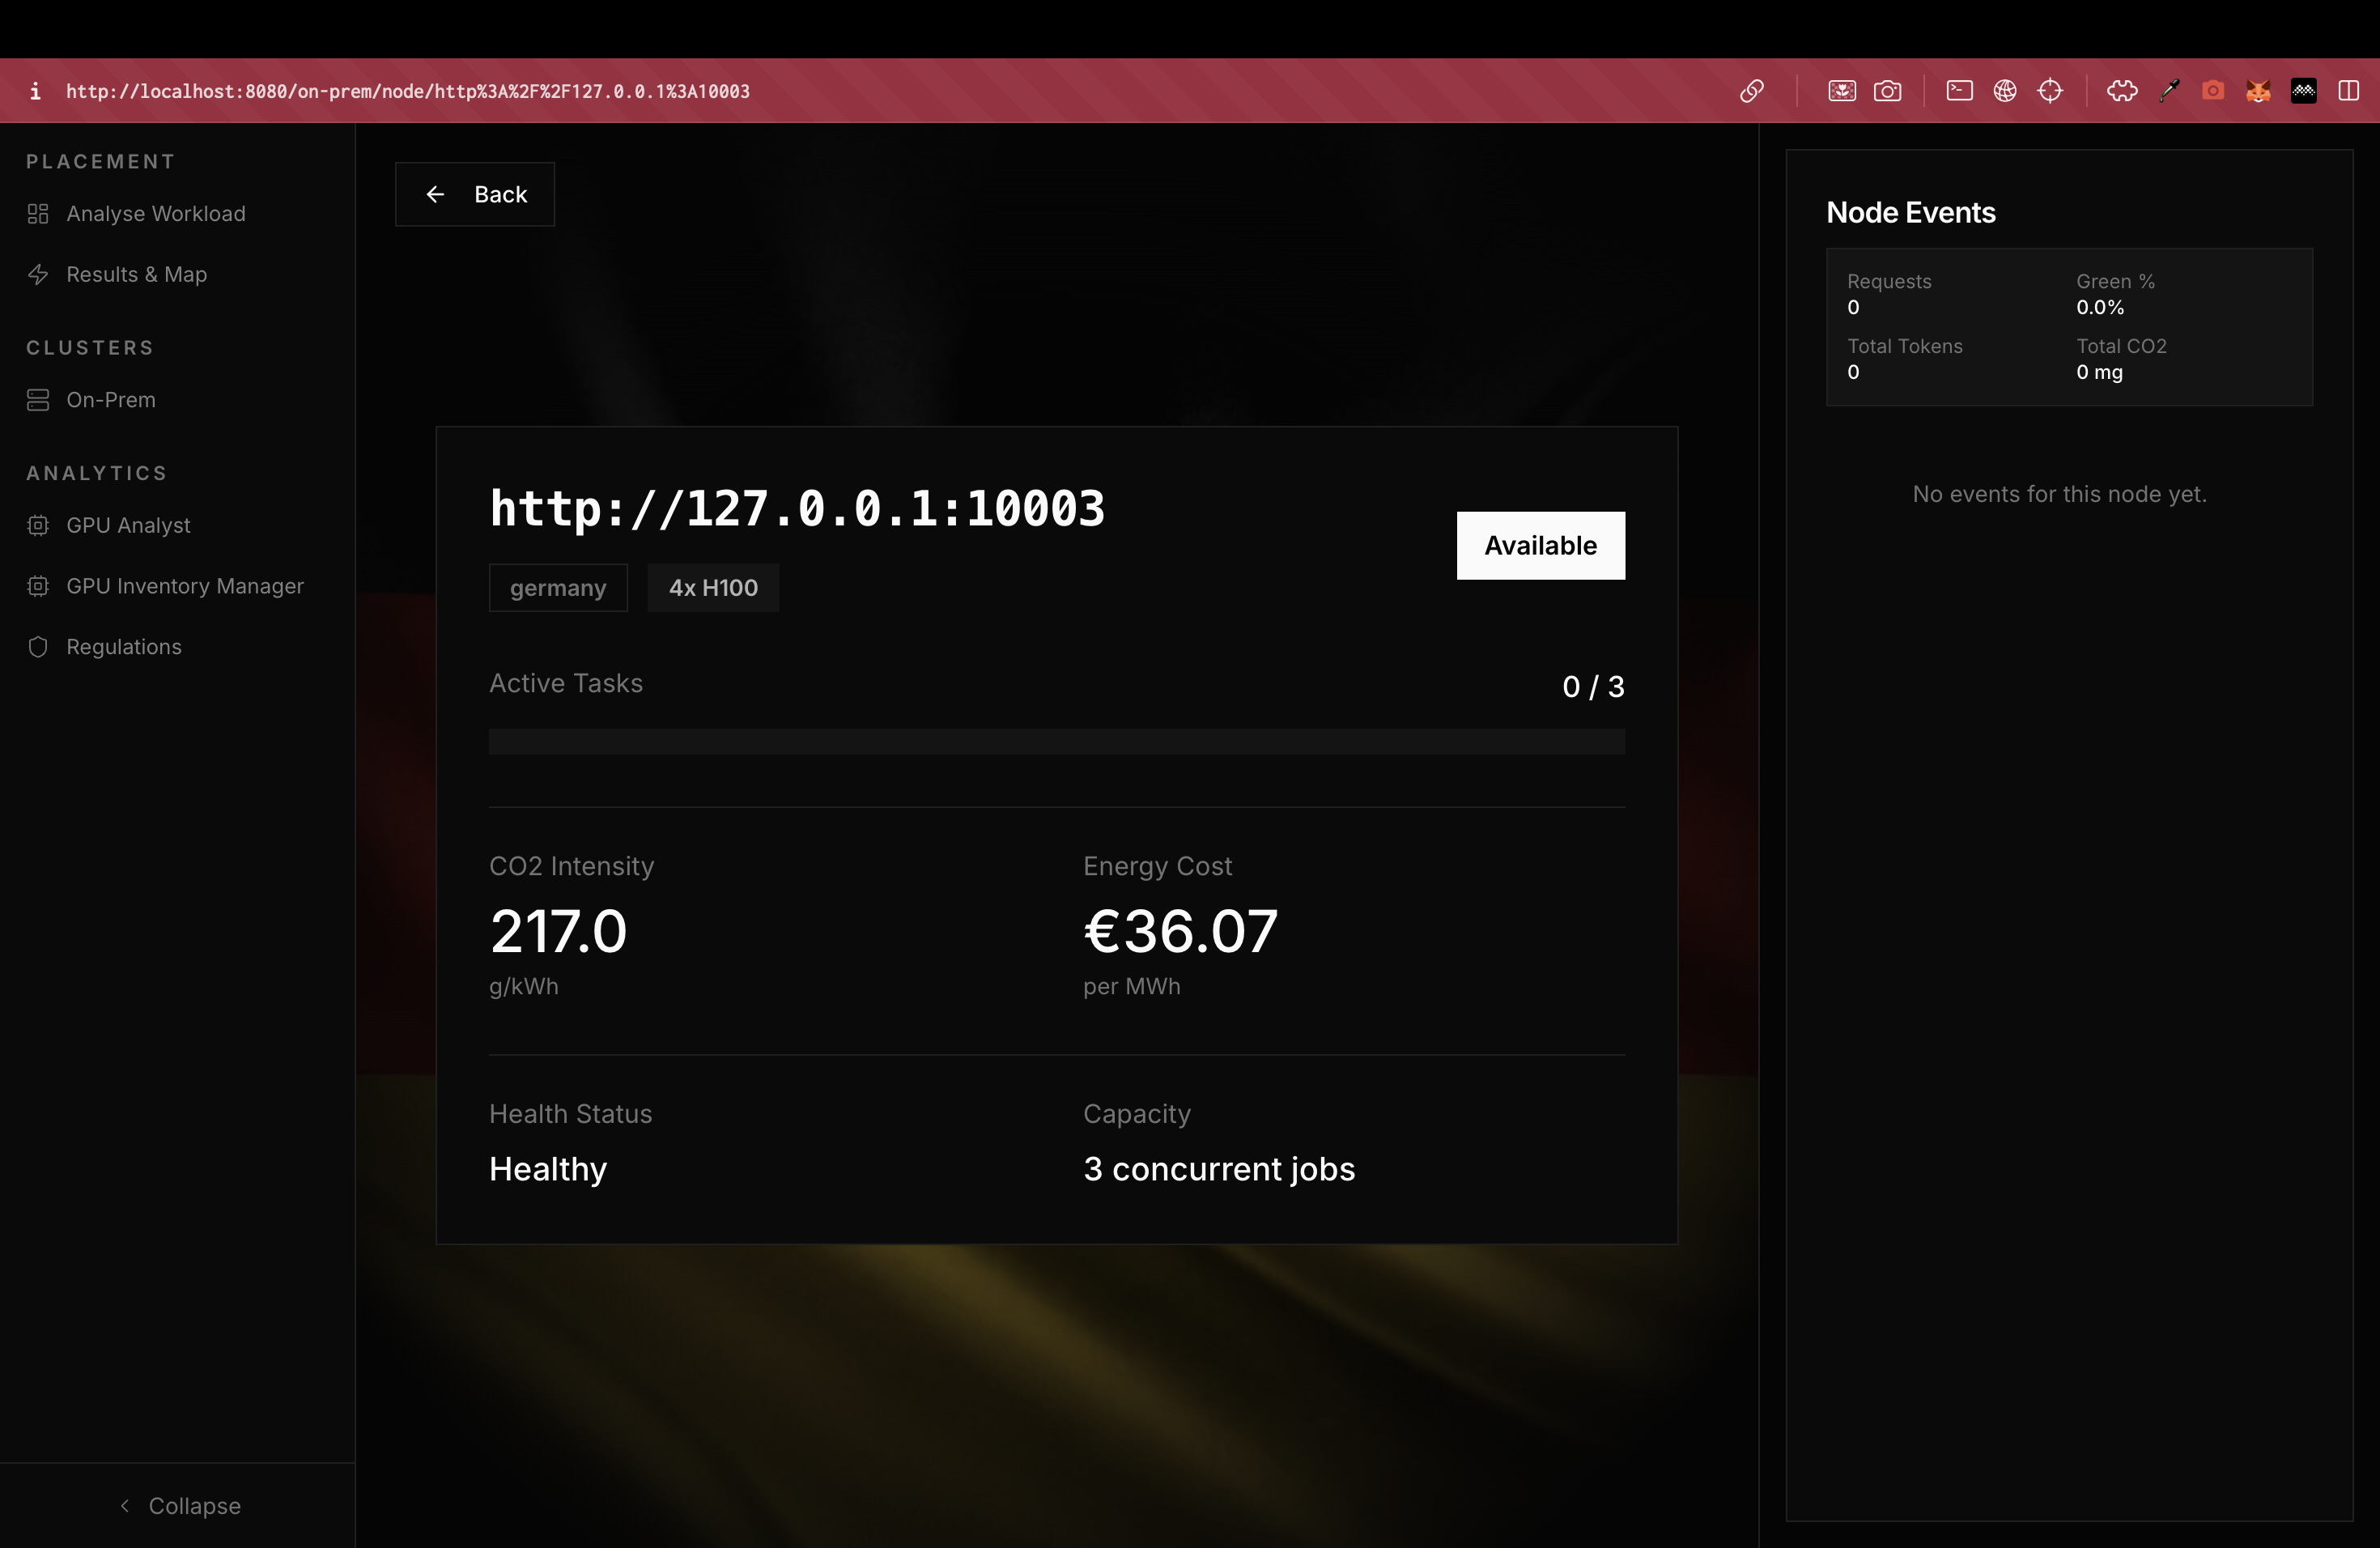
It also has a 72-hour renewable energy forecast per region so you can schedule batch jobs to hit solar and wind energy generation peaks, a GPU shelf-life analyser that predicts how long a datacenter GPU stays competitive before being superseded, a European regulatory compliance checker covering PUE limits and renewable mandates across 8 countries, and a live on-prem cluster router that switches between carbon-aware, cost-optimised, round-robin, and least-loaded scheduling strategies in real time.
How we built it
We split the project into three main parts:
1. Model Analyzer We built a backend engine that estimates GPU usage based on model size, expected traffic, and runtime. From that, we calculate energy consumption using typical GPU power draw values (like A100 estimates).
2. Carbon Data Integration We integrated grid carbon intensity data using Electricity Maps for selected regions. This allows us to estimate emissions based on where the workload runs.
3. Region Comparison Engine We created a pricing + carbon comparison layer across selected cloud regions. The system calculates total cost and emissions per region and ranks them based on a scoring formula that weighs cost and carbon. The frontend dynamically updates recommendations based on user inputs, making the experience interactive and decision-driven rather than static.
4. Simulating Real-time Inference Scheduling We have also implemented an scheduling simulation that splits high time priority tasks, such as AI inference in real time across a number of available datacenters based on their sustainability score, computation cost and compute availability.
Challenges we ran into
One big challenge was realizing how complex this problem actually is. Cloud pricing isn’t straightforward, and real GPU performance varies a lot depending on configuration. Another challenge was mapping cloud regions to actual grid carbon zones. Cloud providers don’t directly expose carbon intensity per region in a standardized way, so we had to simplify and make reasonable assumptions.
We also had to avoid overengineering. There’s a temptation to simulate everything perfectly, but for a hackathon we focused on making the logic clear and understandable rather than laying out every single datapoint.
Accomplishments that we're proud of
- We built a working model analyzer instead of just a static comparison dashboard.
- We connected AI workload characteristics directly to carbon impact.
- We made the optimization interactive with a cost vs sustainability slider.
- We created something that feels like a real decision-support tool. Overall, we managed to turn a vague sustainability idea into a quantitative system.
What we learned
We learned that AI infrastructure decisions are rarely made with sustainability in mind. We also learned how much energy math sits underneath AI systems GPU power draw, runtime, carbon intensity, and how small changes in region or timing can significantly change emissions.
What's next
Next, we want to:
- Integrate real-time carbon forecasting instead of static values.
- Add support for training workloads at larger scale.
- Provide downloadable carbon reports for ESG or compliance use cases.
- Expand region coverage beyond our initial set.
Built With
- crusoe
- electricitymapsapi
- fastapi
- lovable
- next.js
- ollama
- python
- react
- tailwind.css
- typescript


Log in or sign up for Devpost to join the conversation.