-
-
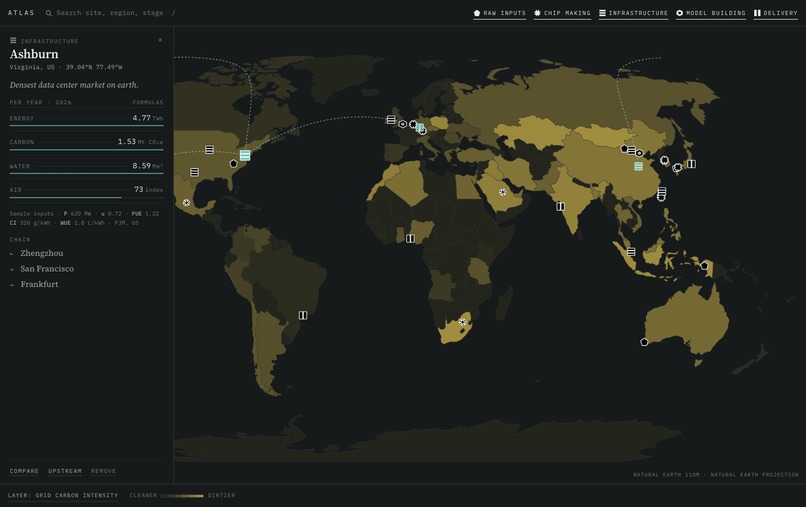
v1
-
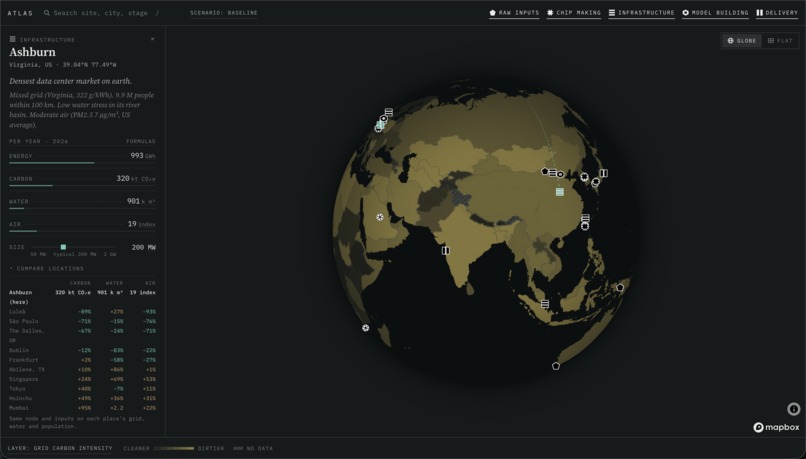
v2
-
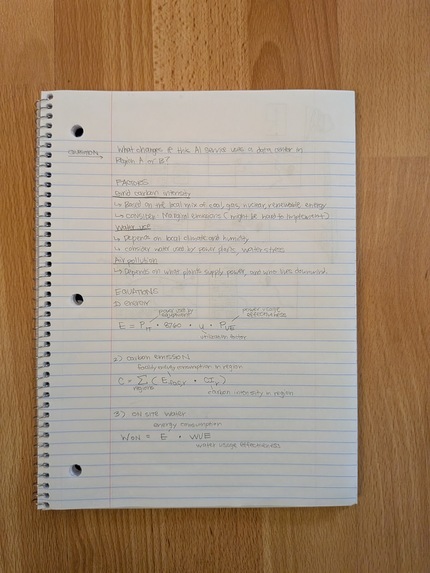
sketch
-
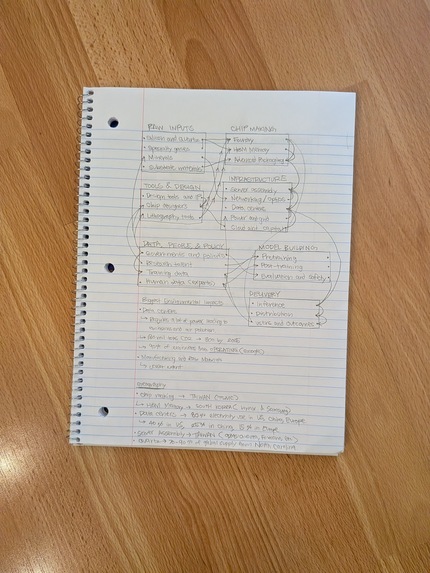
sketch
-
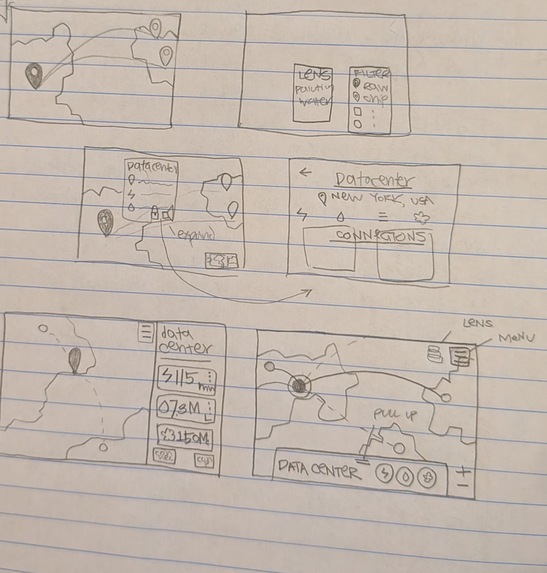
sketch of ui
-
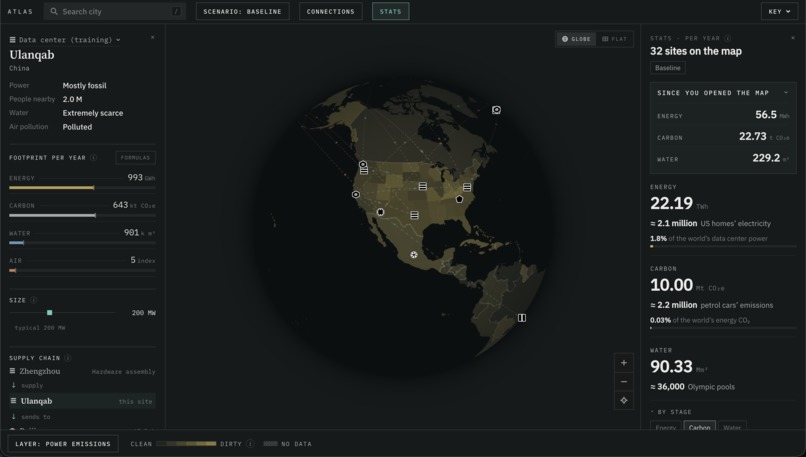
v3
-
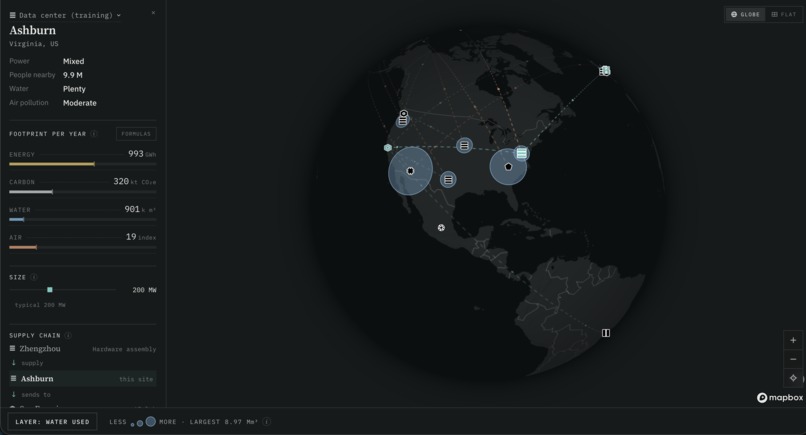
lens
-
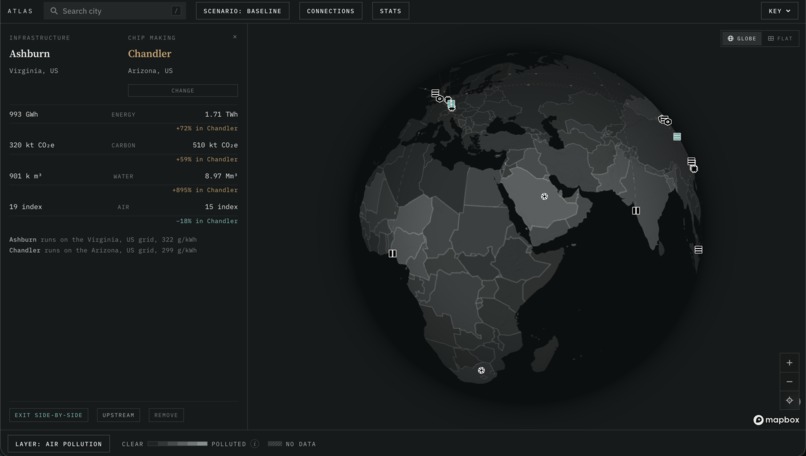
comparison
-
connections
-
scenario
Inspiration
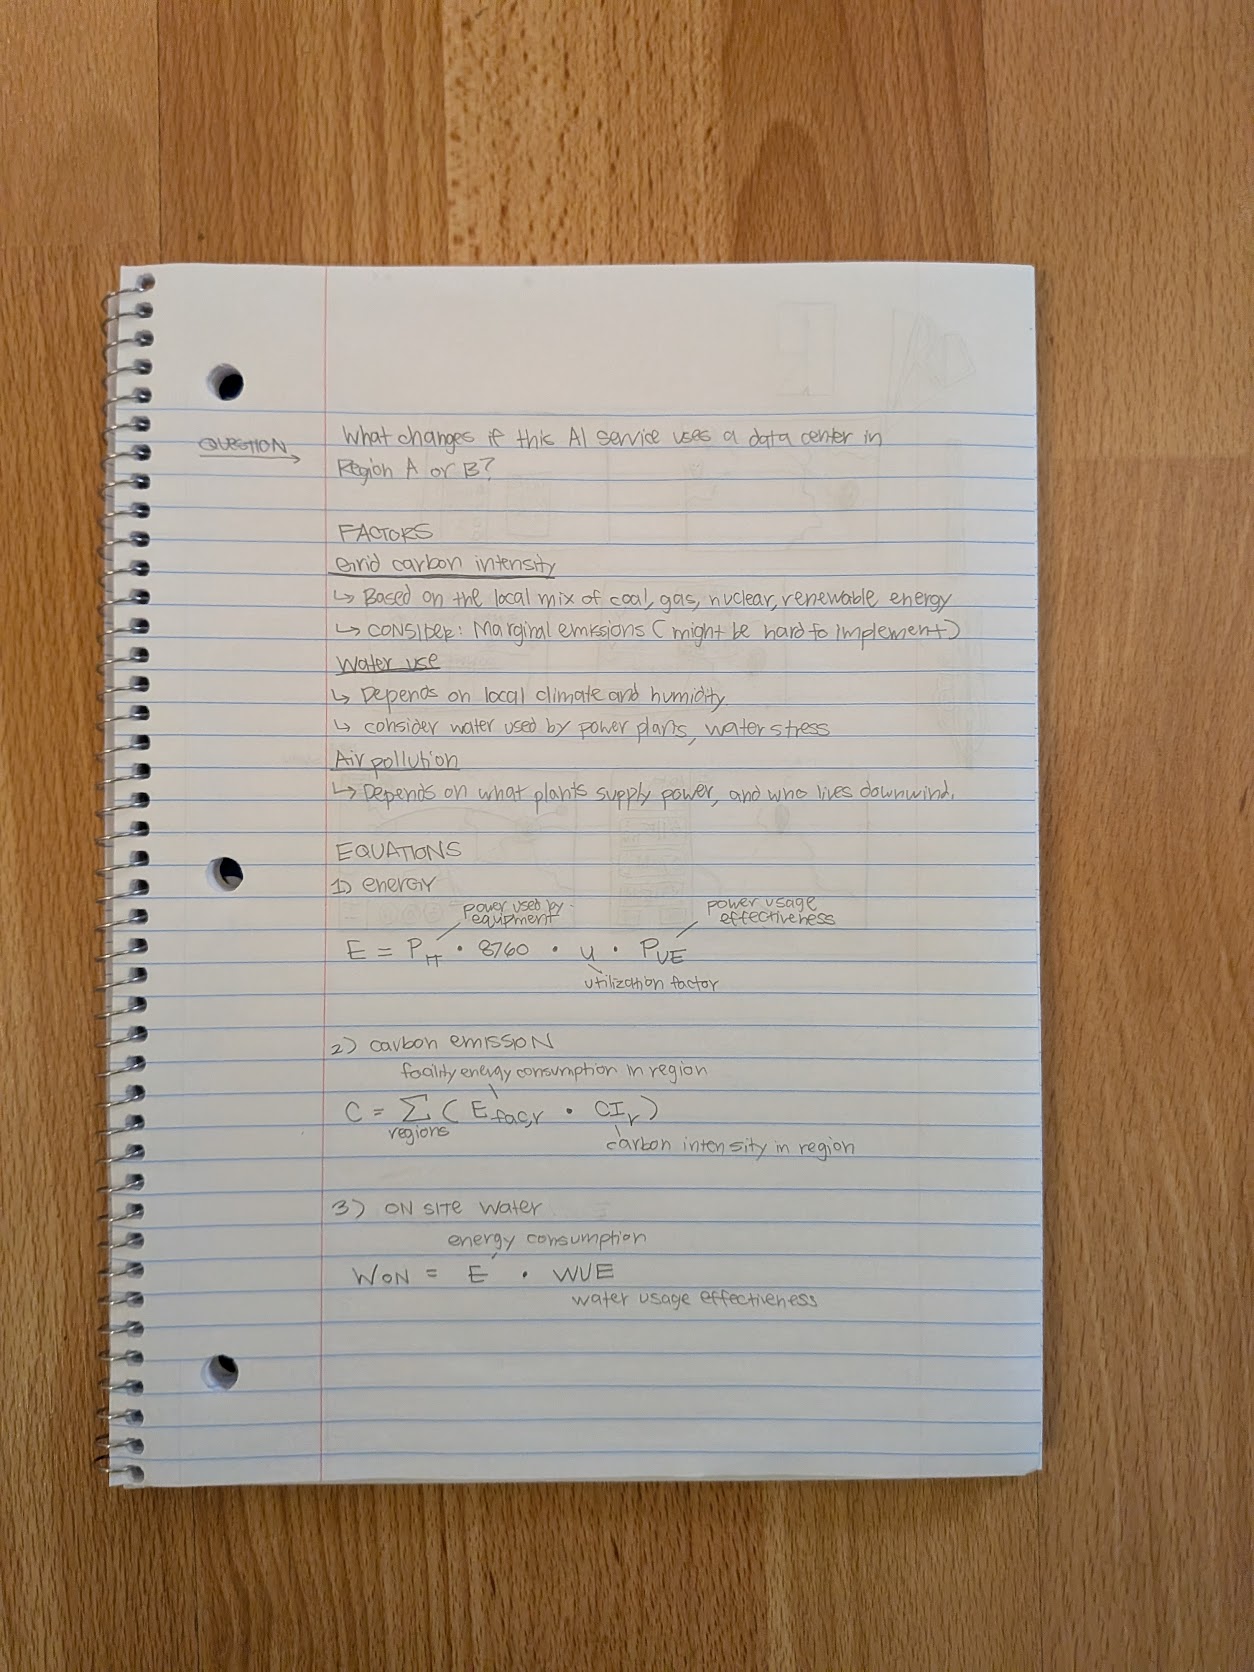
The environmental impact of AI, and the supply chain behind it, is often poorly understood. I created this app to make that process more visible, showing how AI is built and how each step affects the environment.
What it does
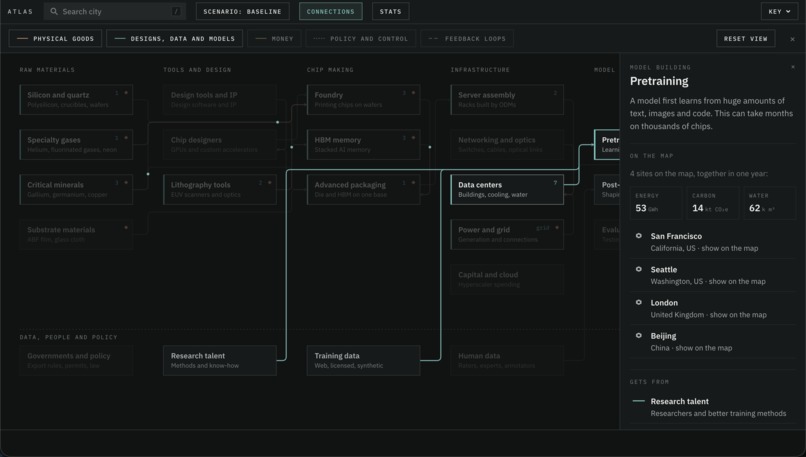
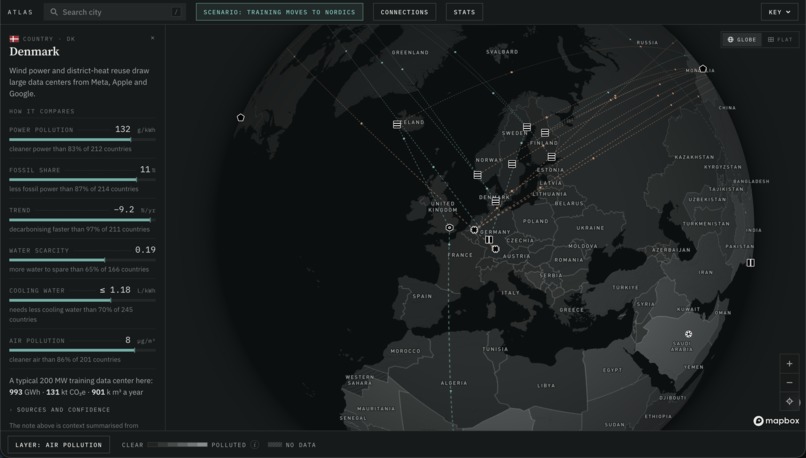
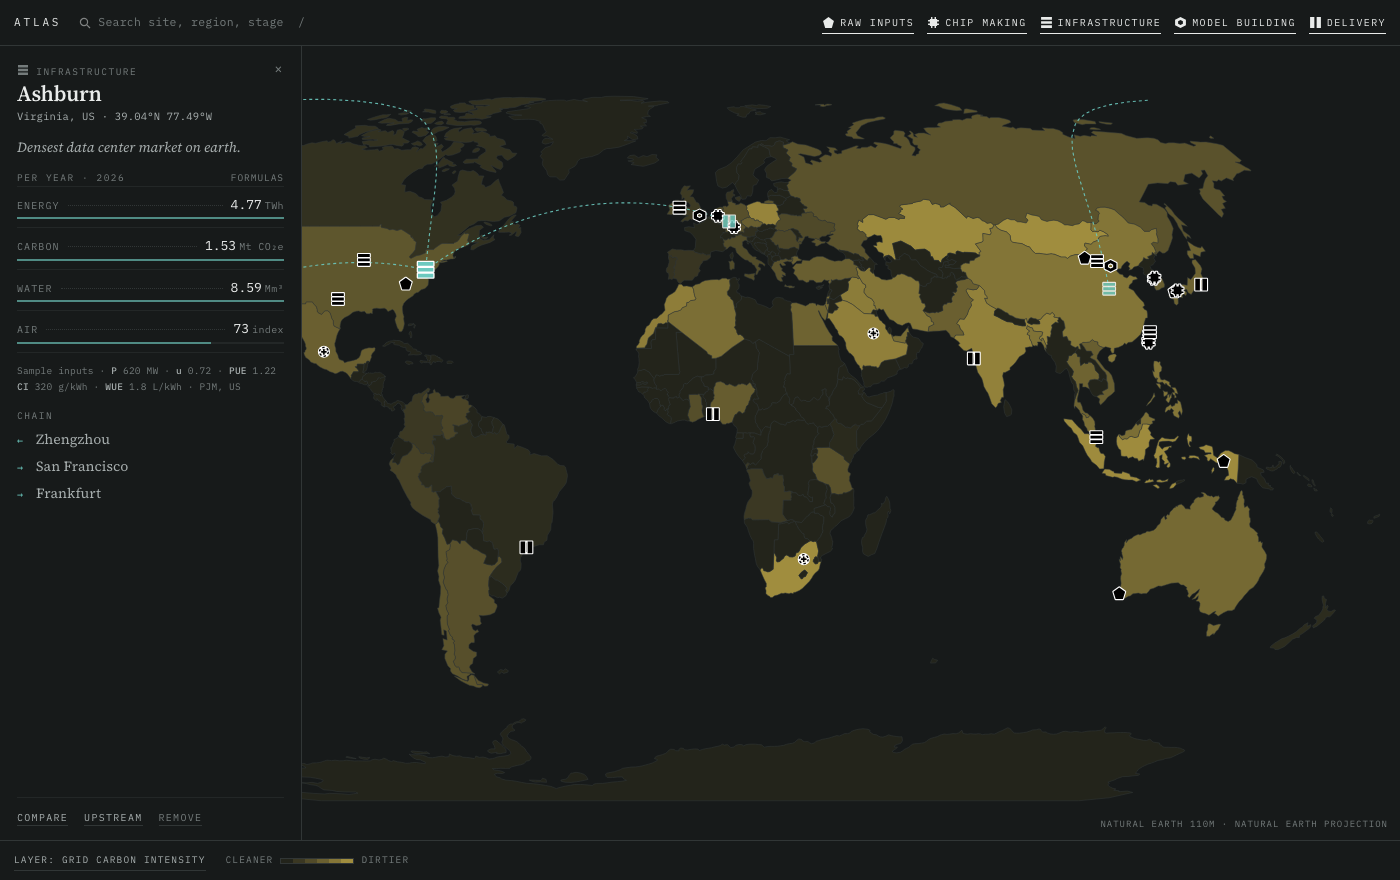
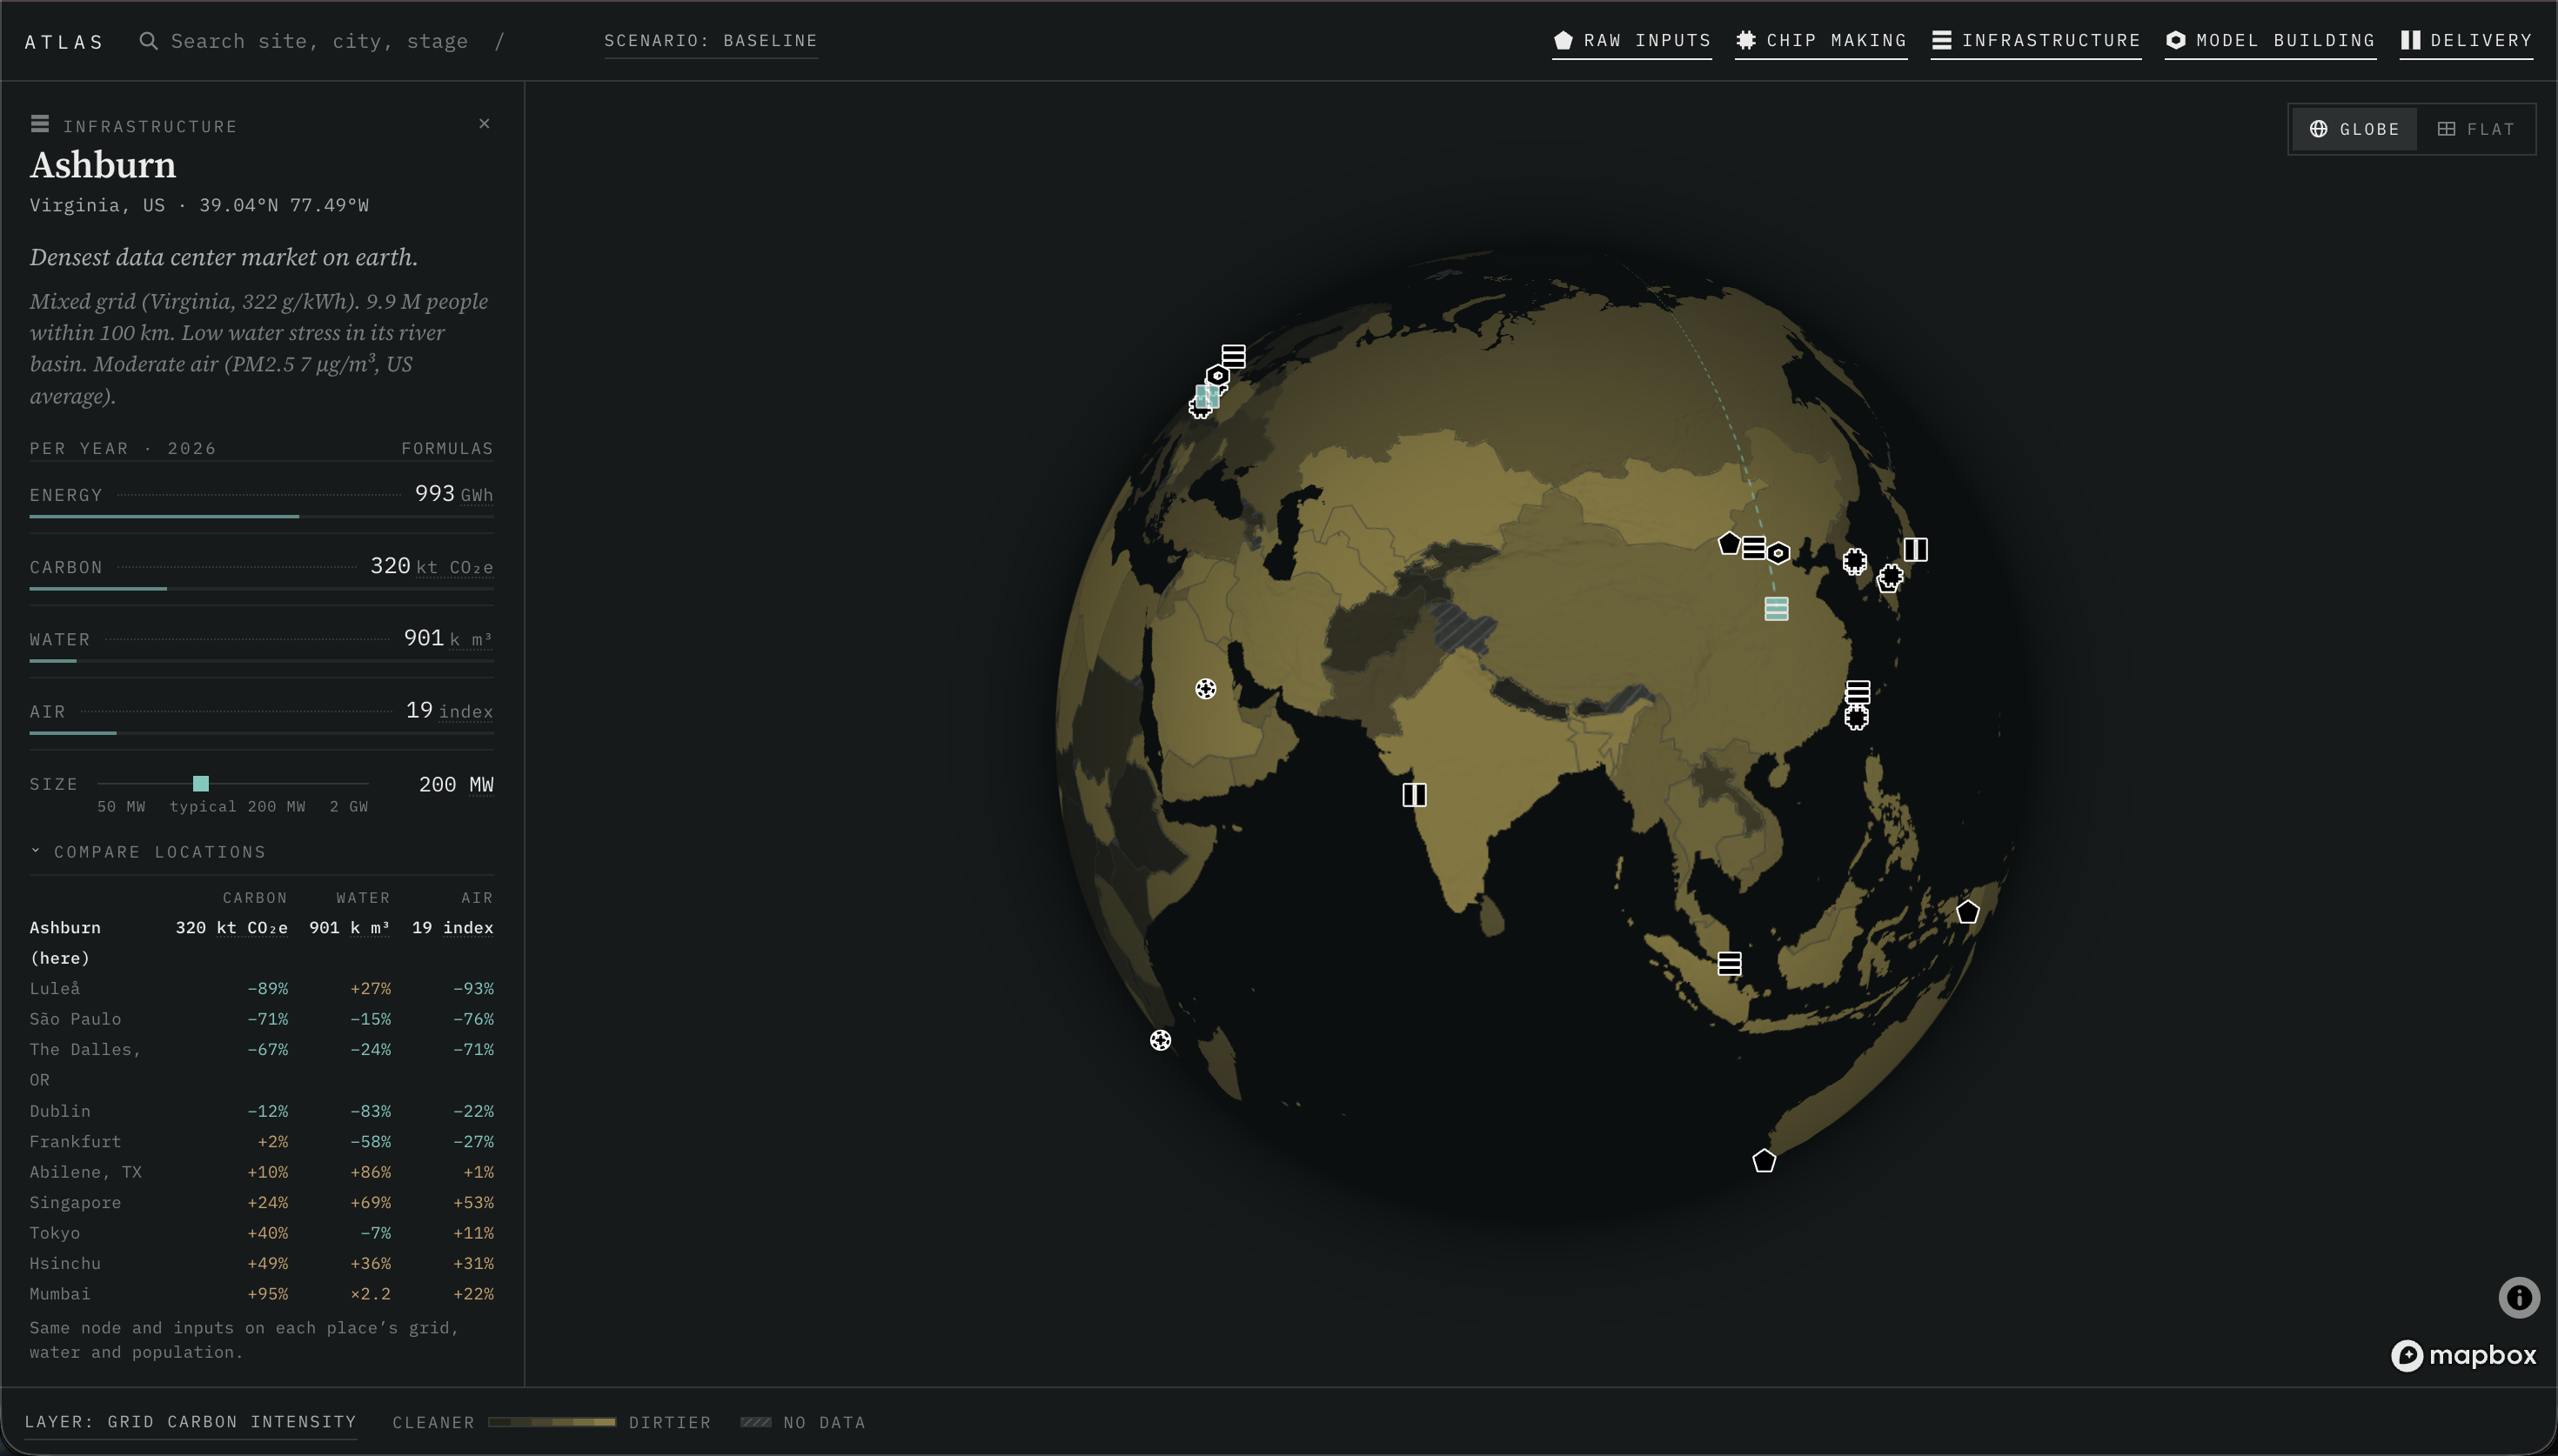
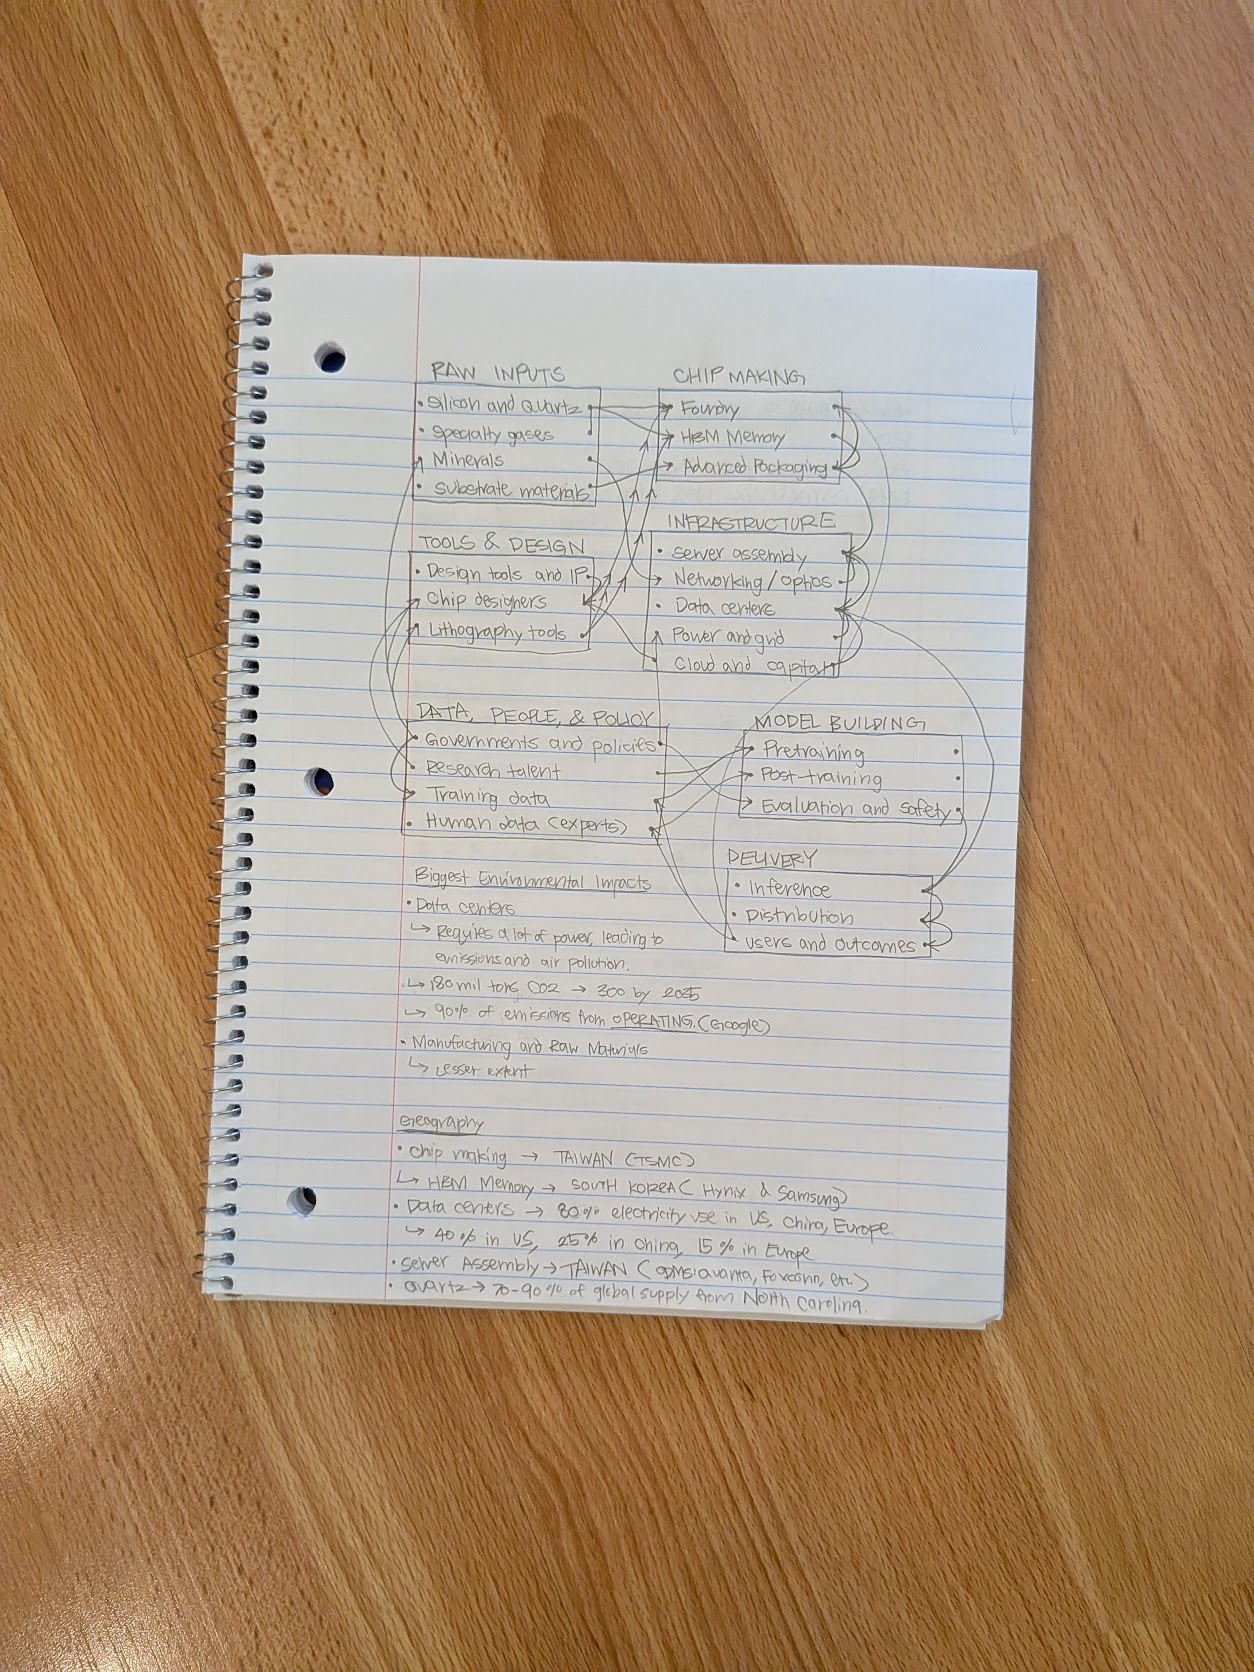
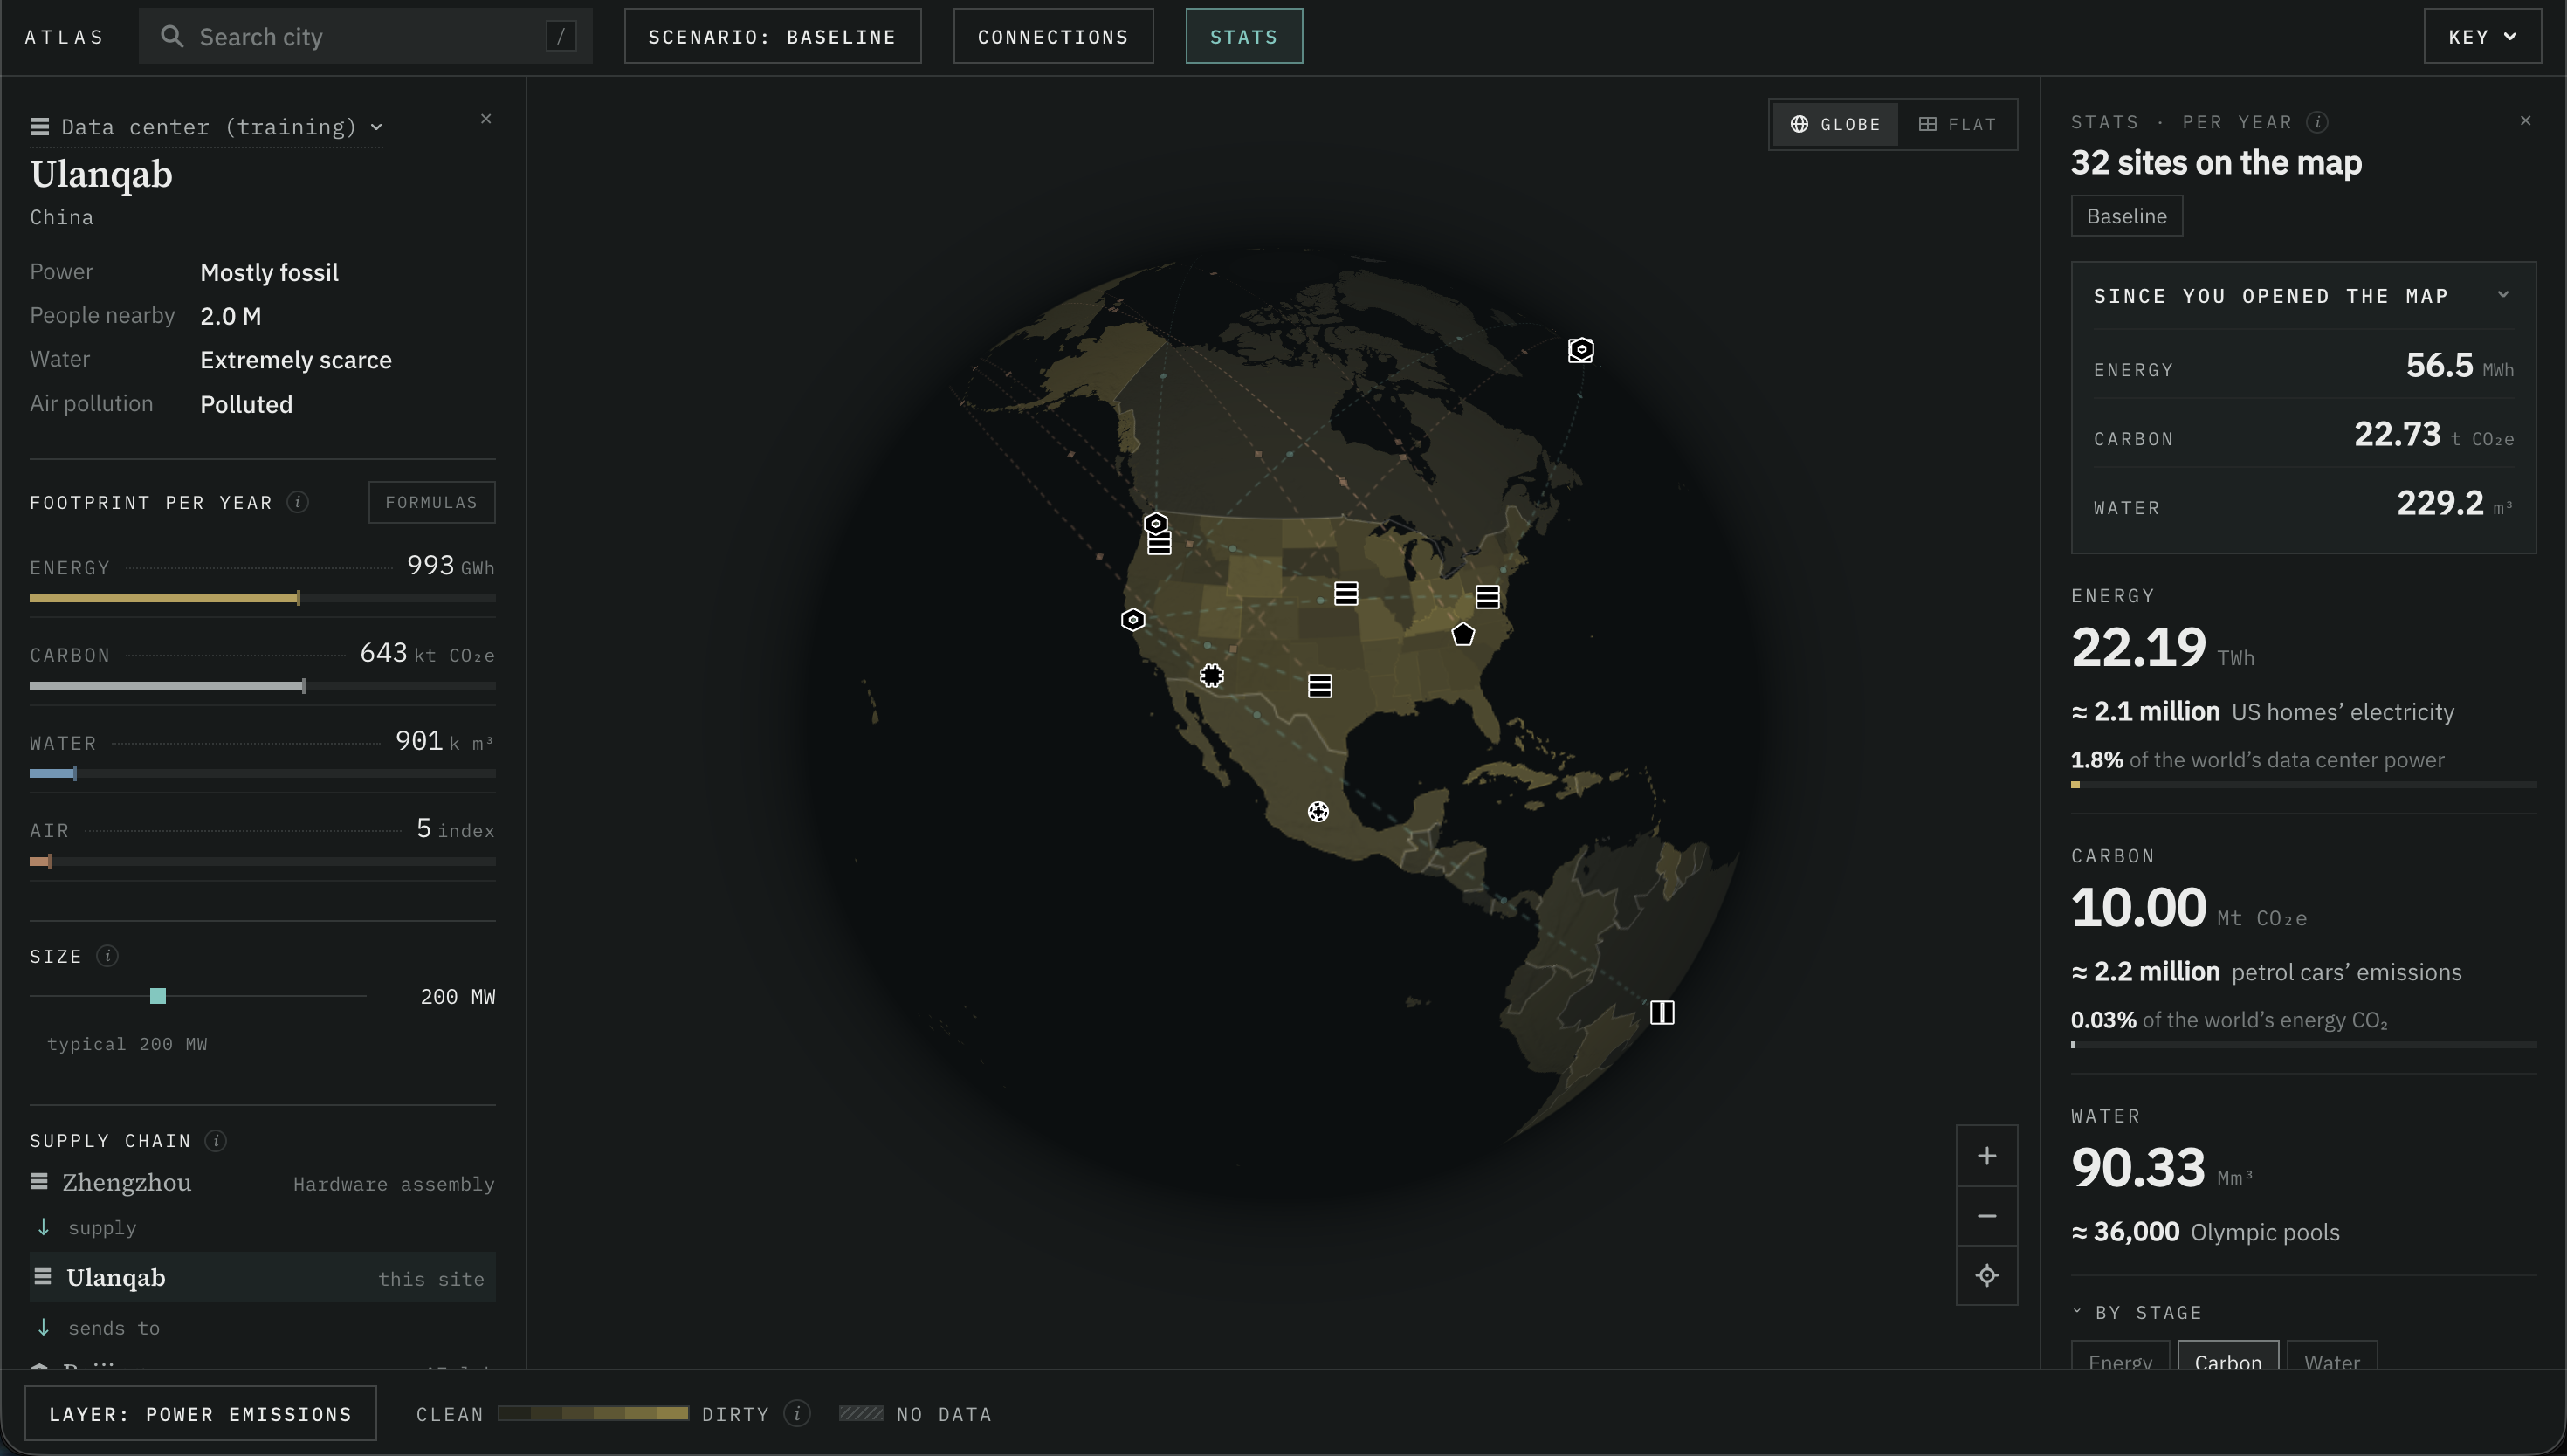
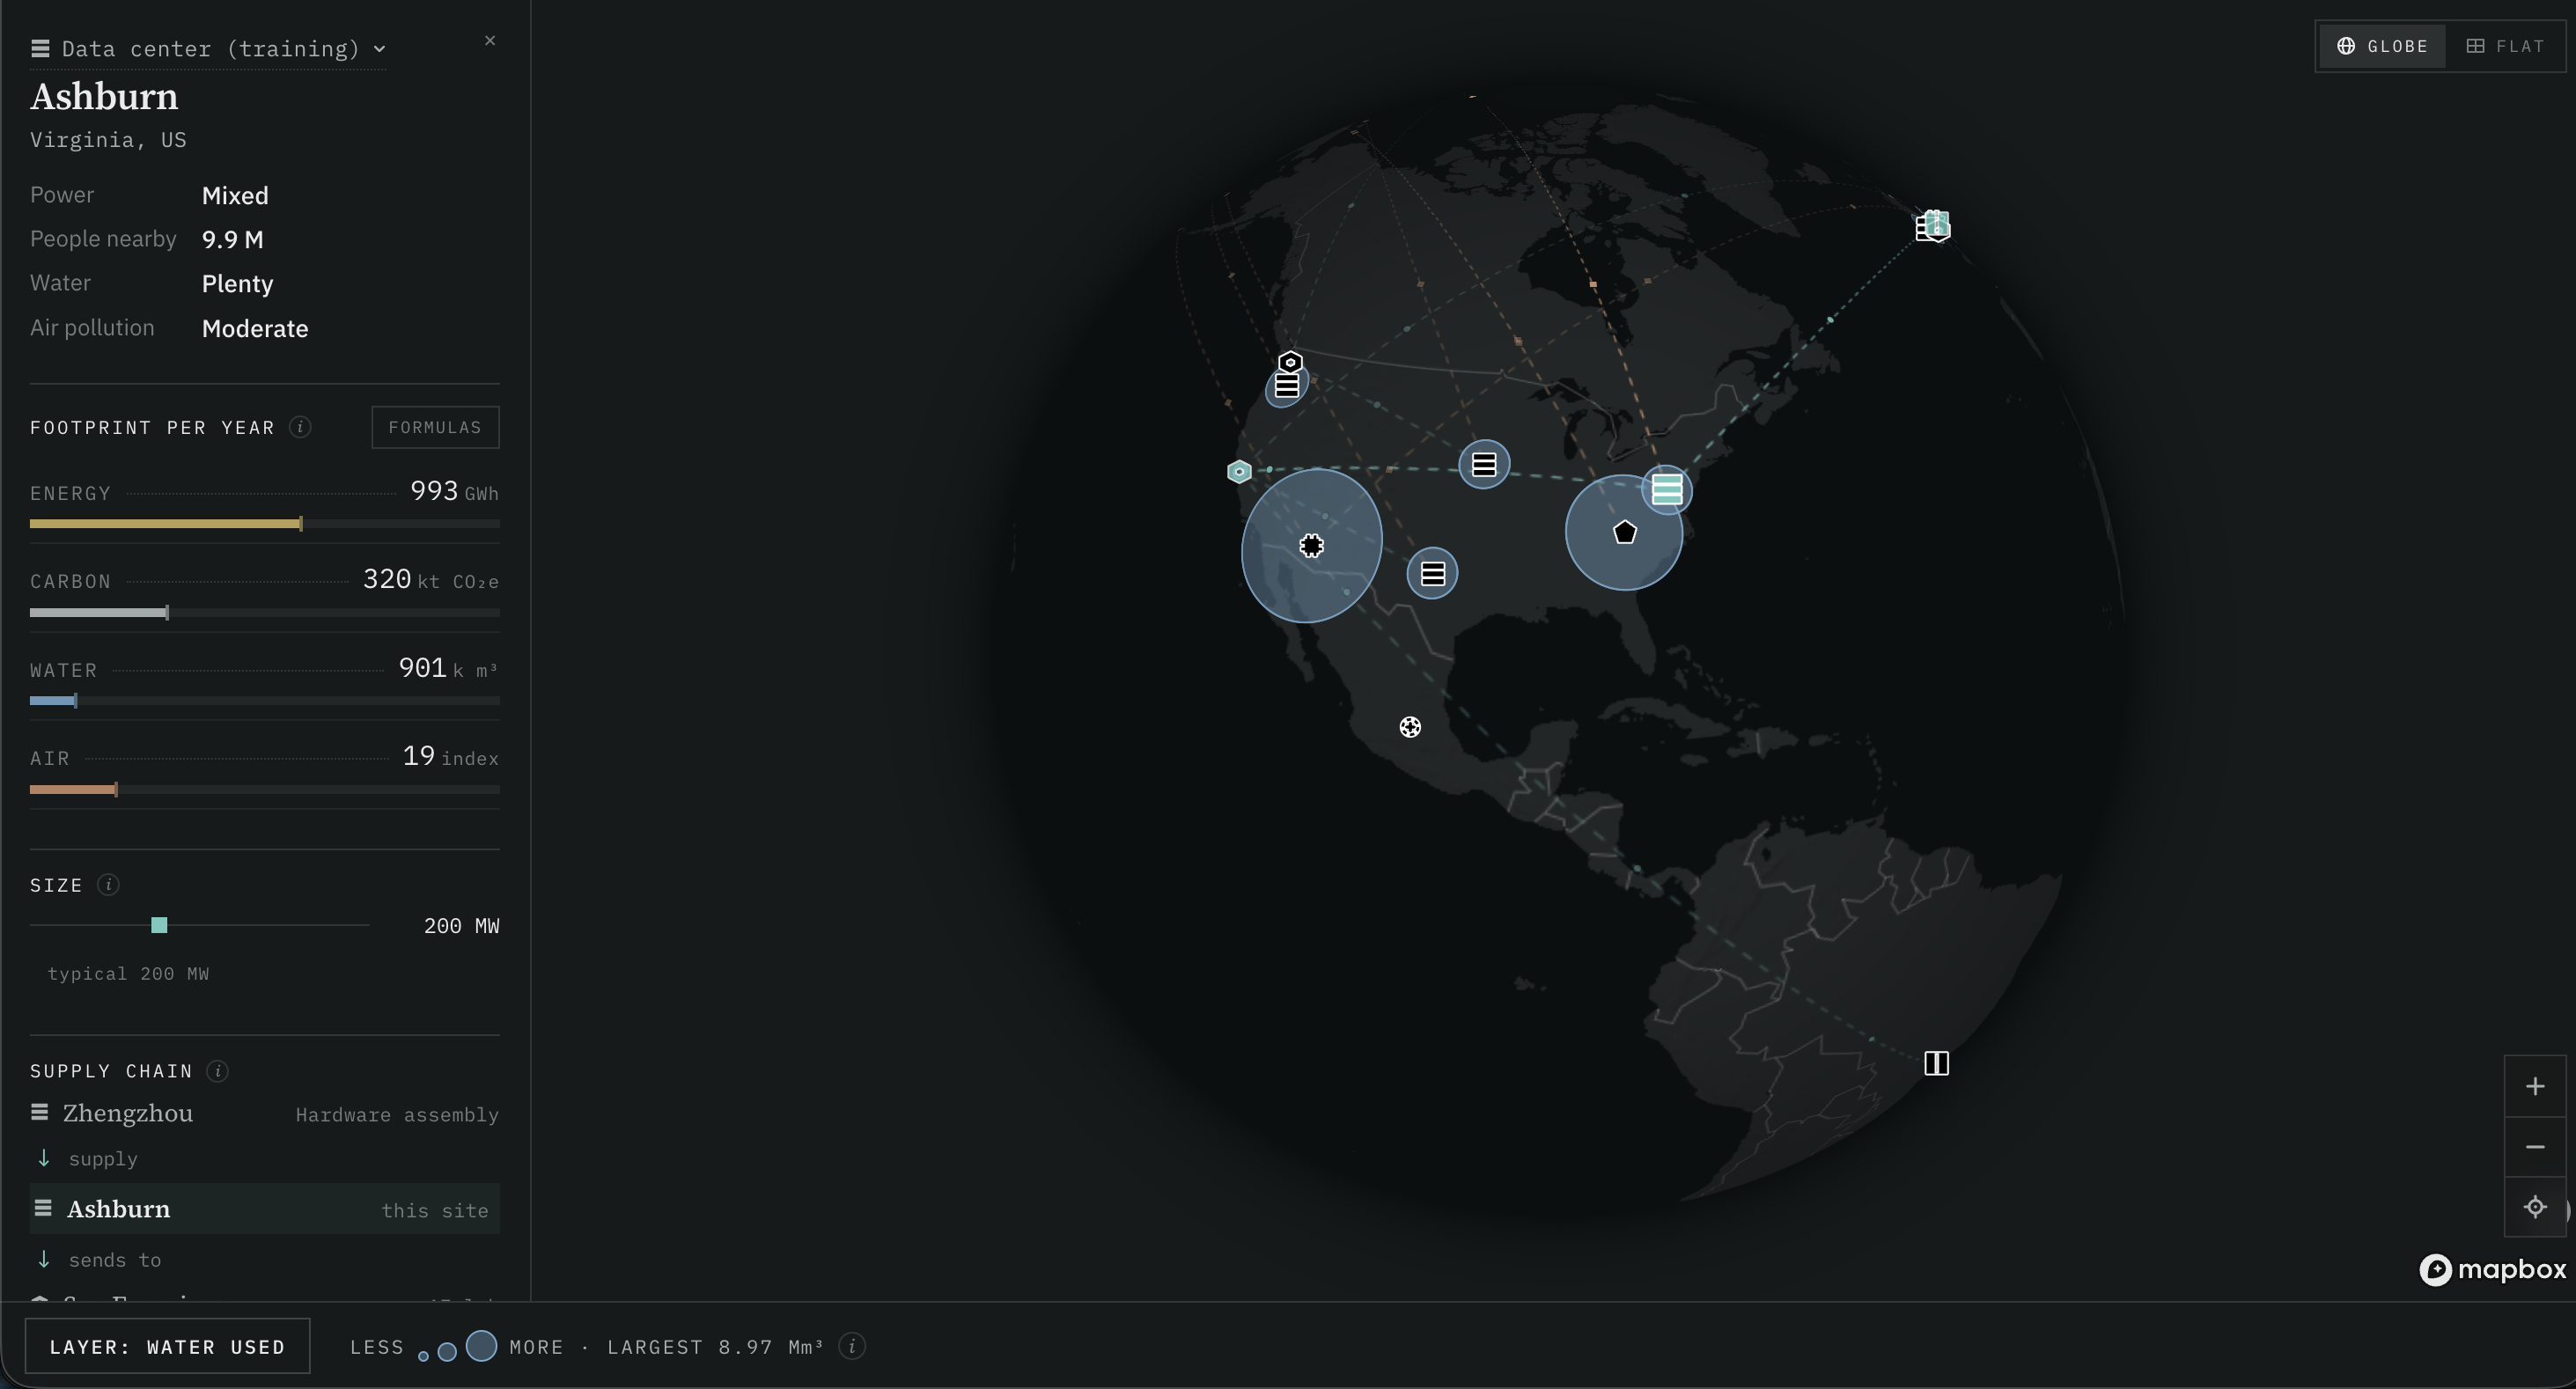
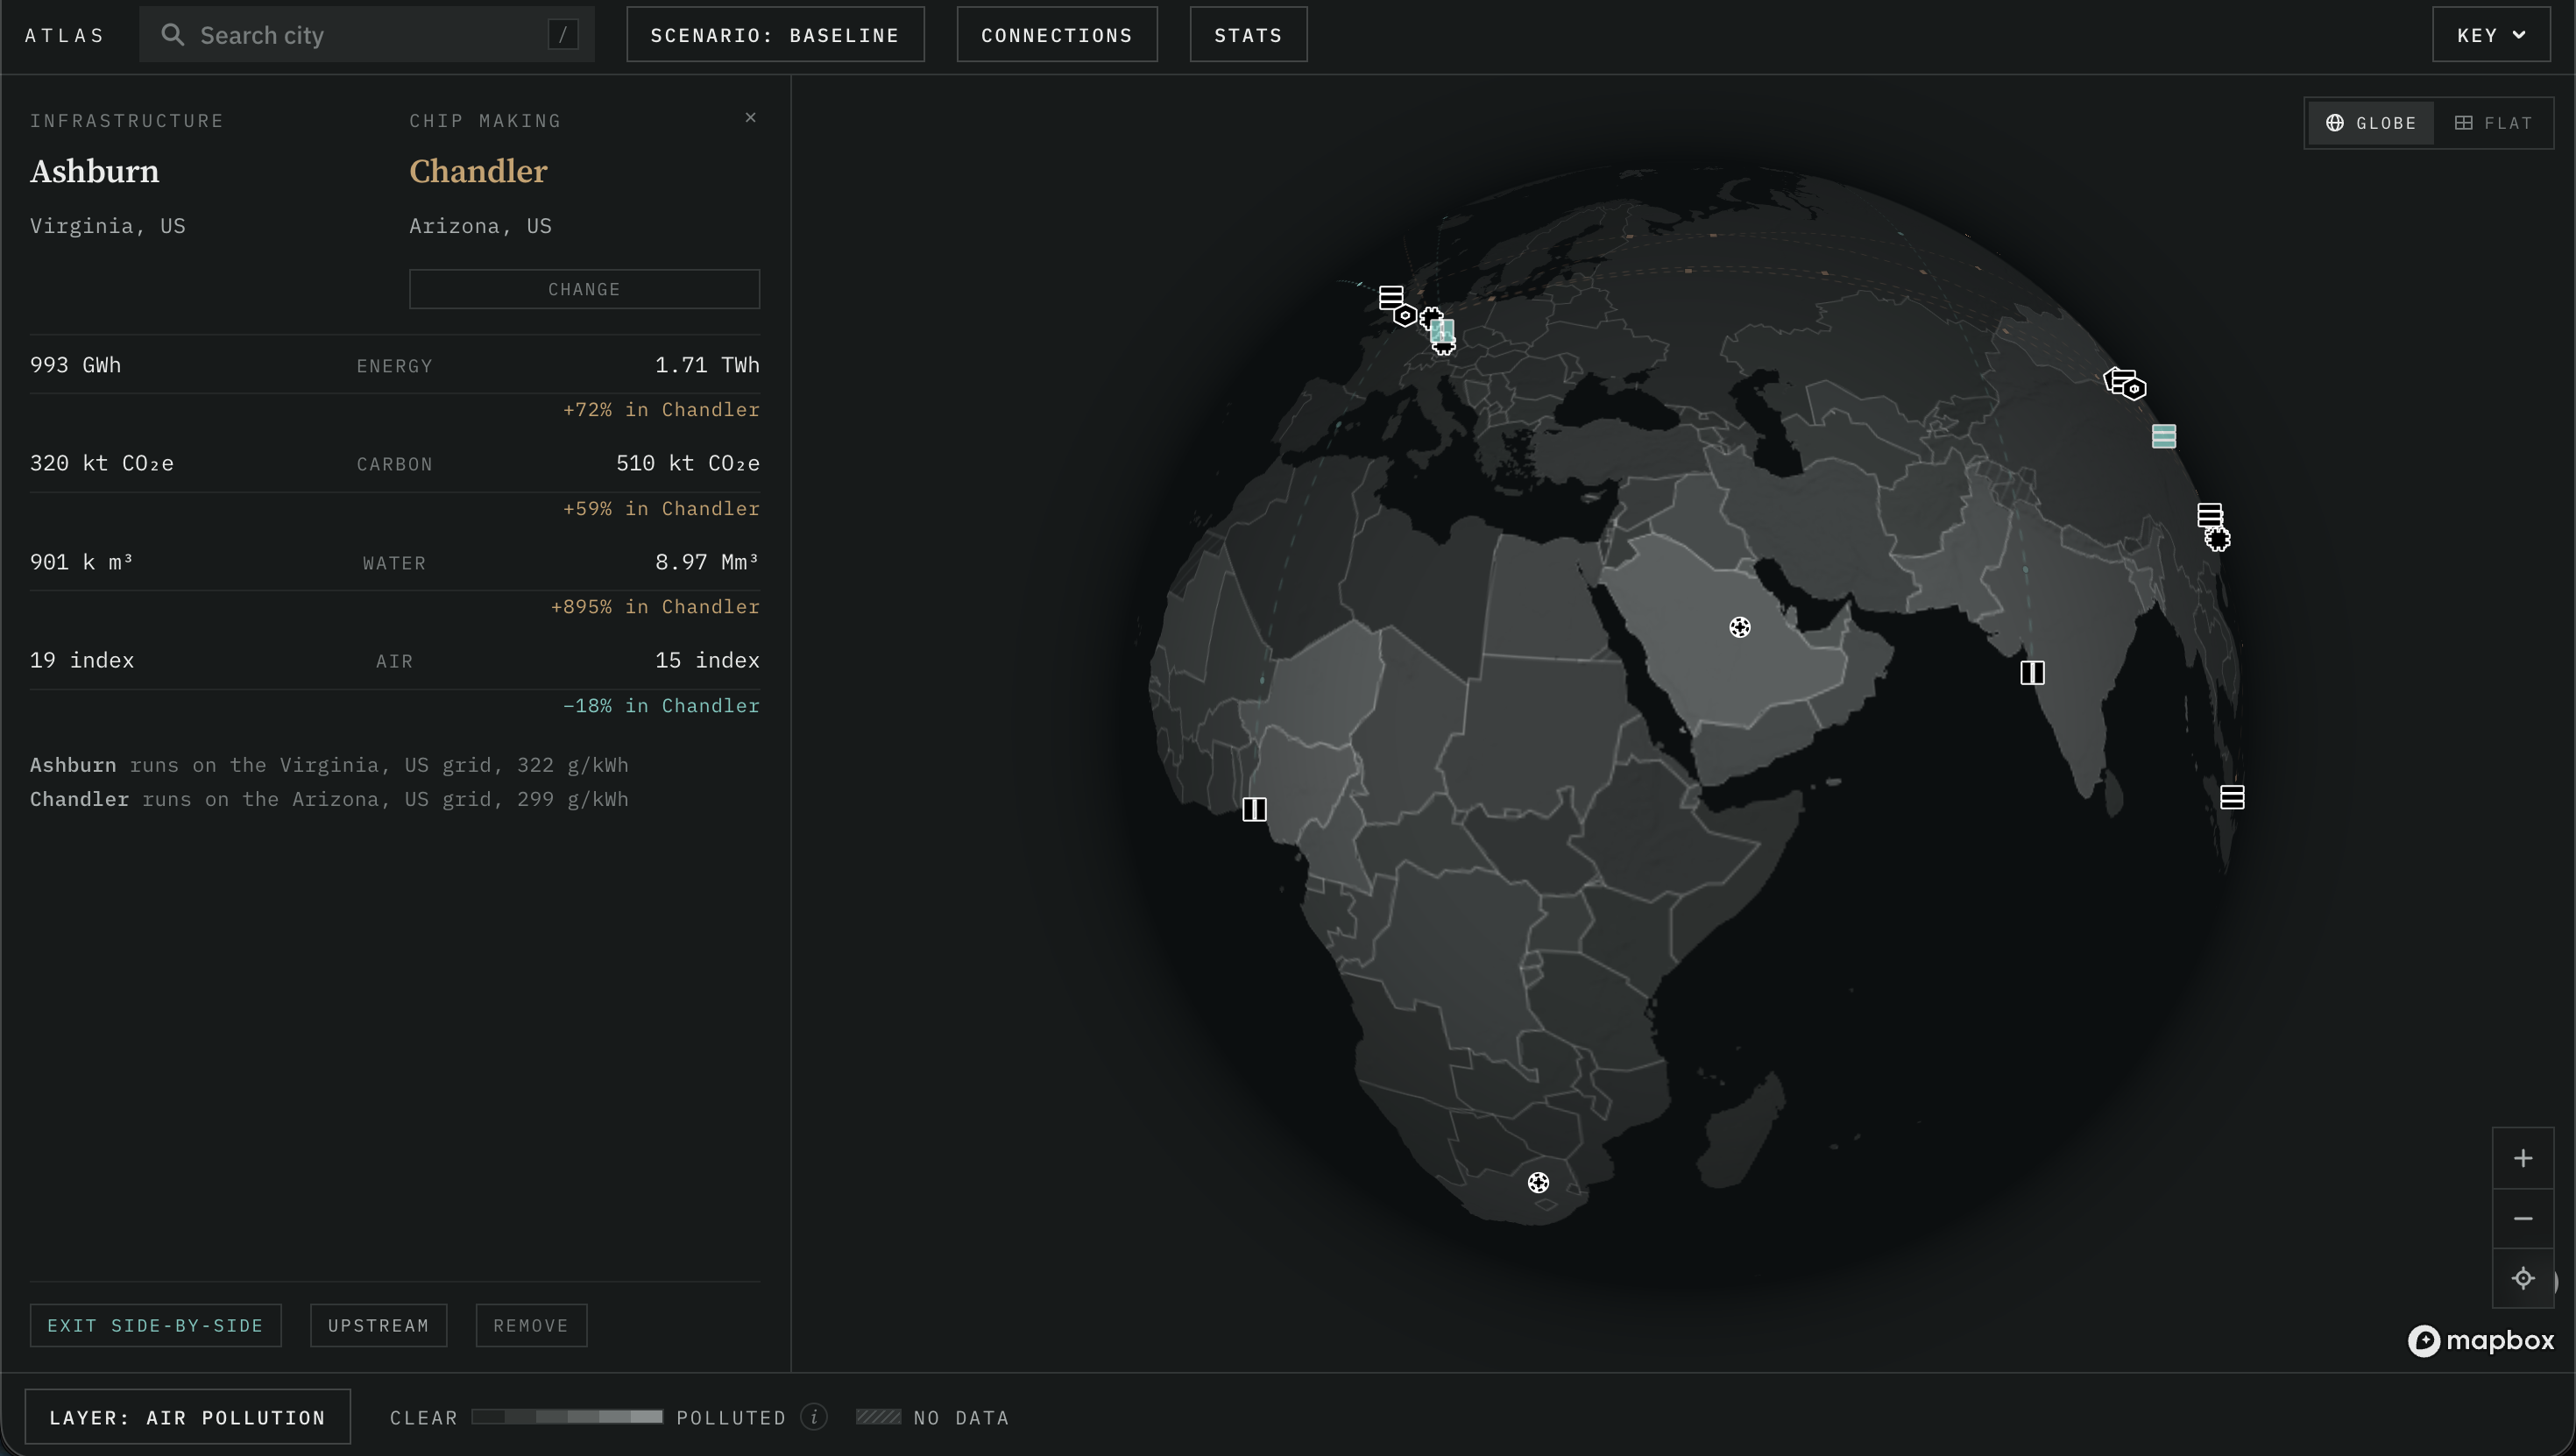
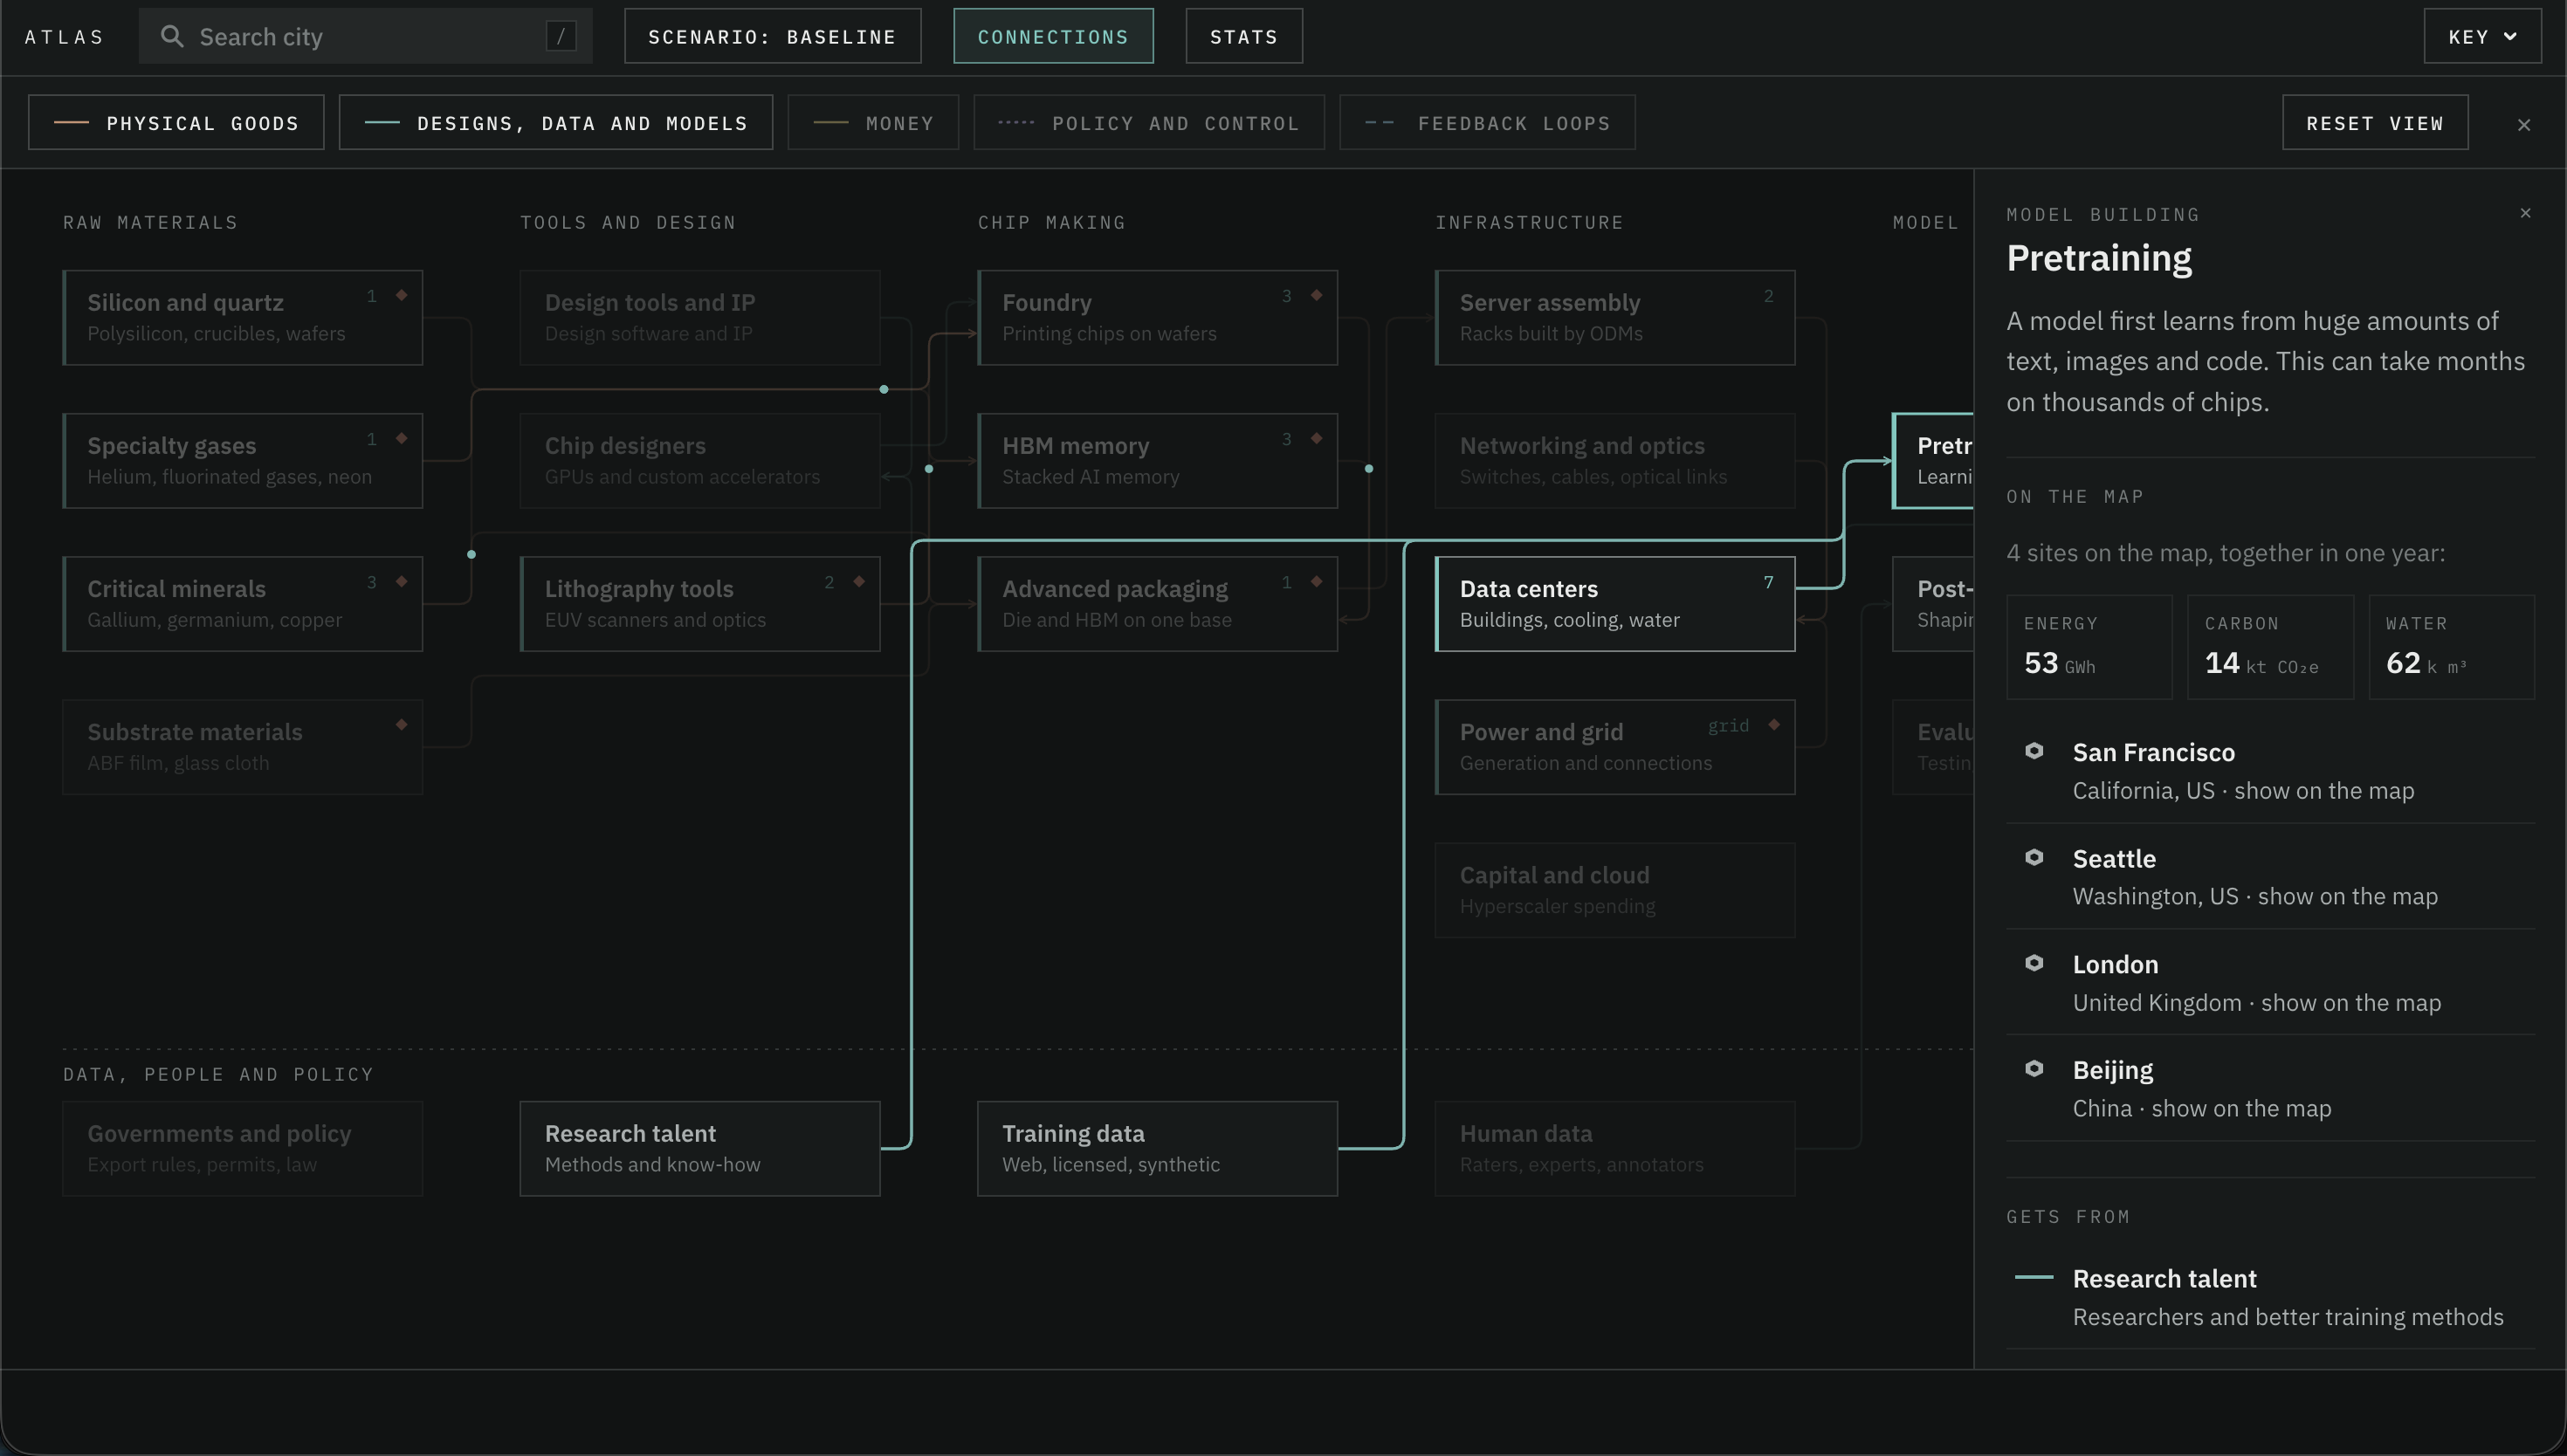
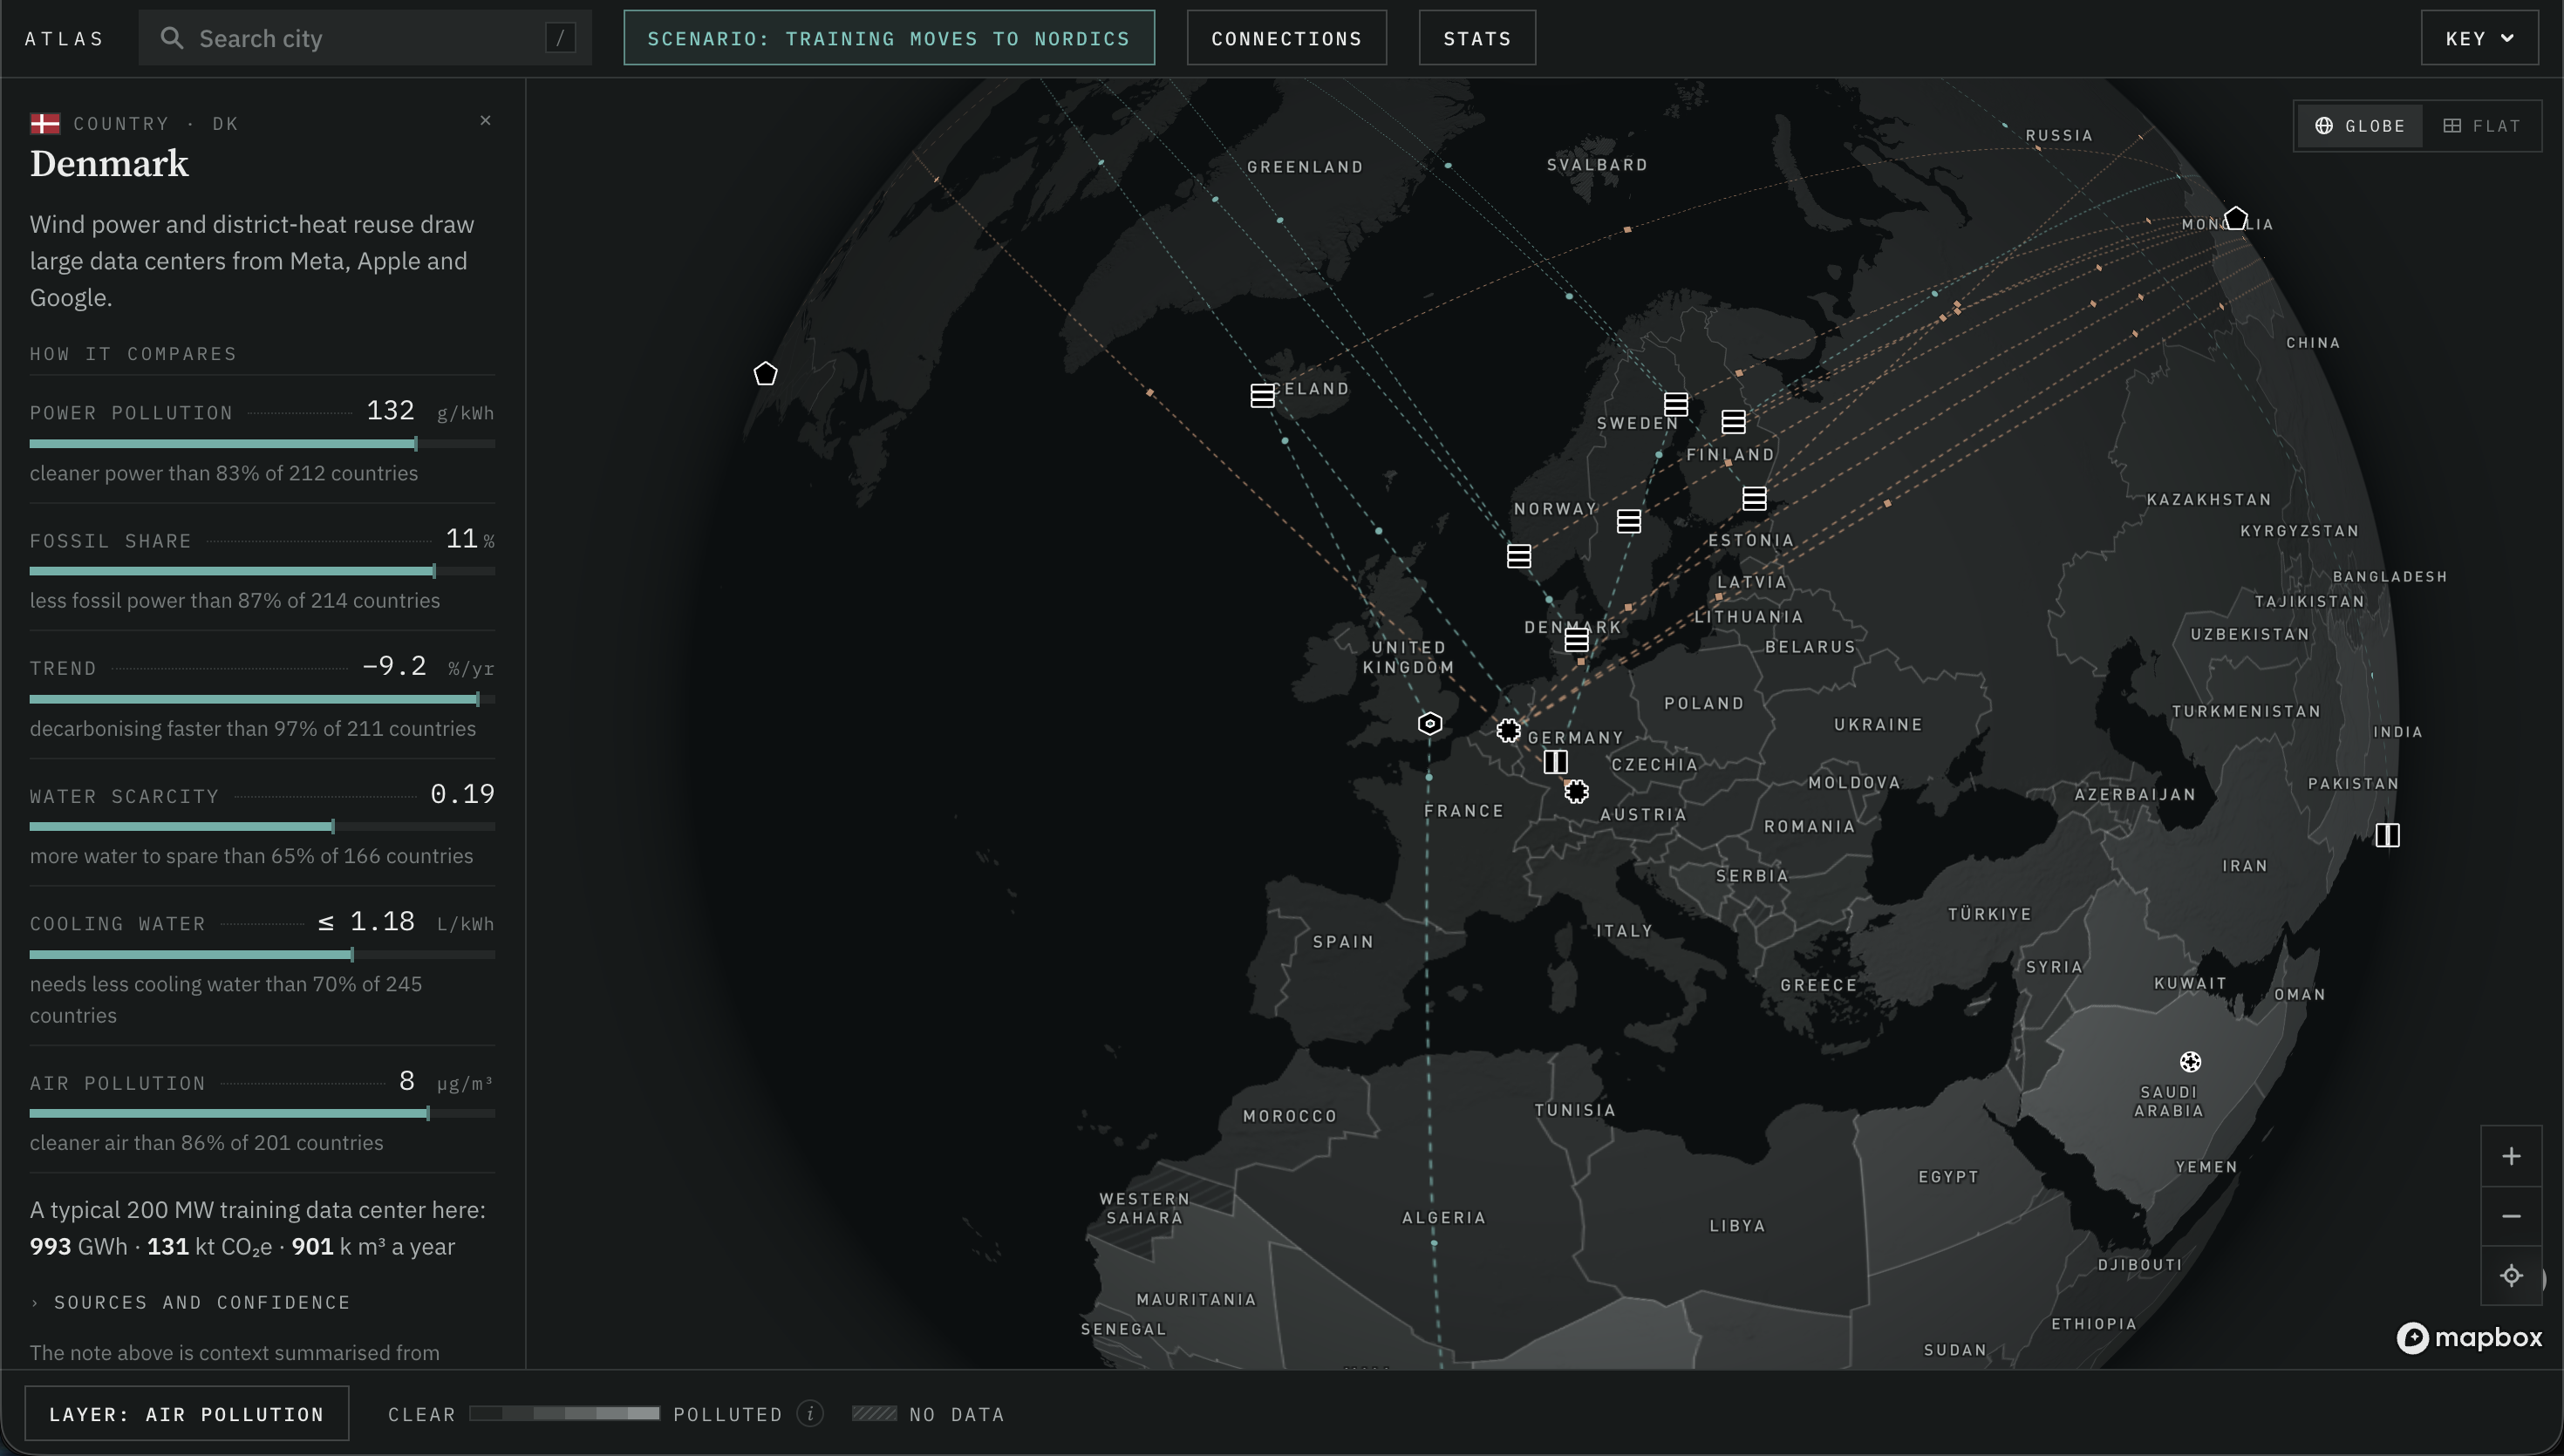
The Atlas shows steps of the AI supply chain on a map of the world. They are grouped into five stages: raw materials, chip making, infrastructure, model building, and delivery. For each site, it estimates yearly energy use, carbon emissions, water use, and air pollution impact. You can search for a city or right-click anywhere on land to add a new site. The app uses local population, water stress, and electricity data for that location. Every number includes its source and confidence level. You can also view map layers for carbon, water stress, and PM2.5, trace supply links across the globe, see key chokepoints, and compare how different locations or scenarios change the results. Can add nodes using right click, which will automatically populate with connections so you can visualize your own changes.
How we built it
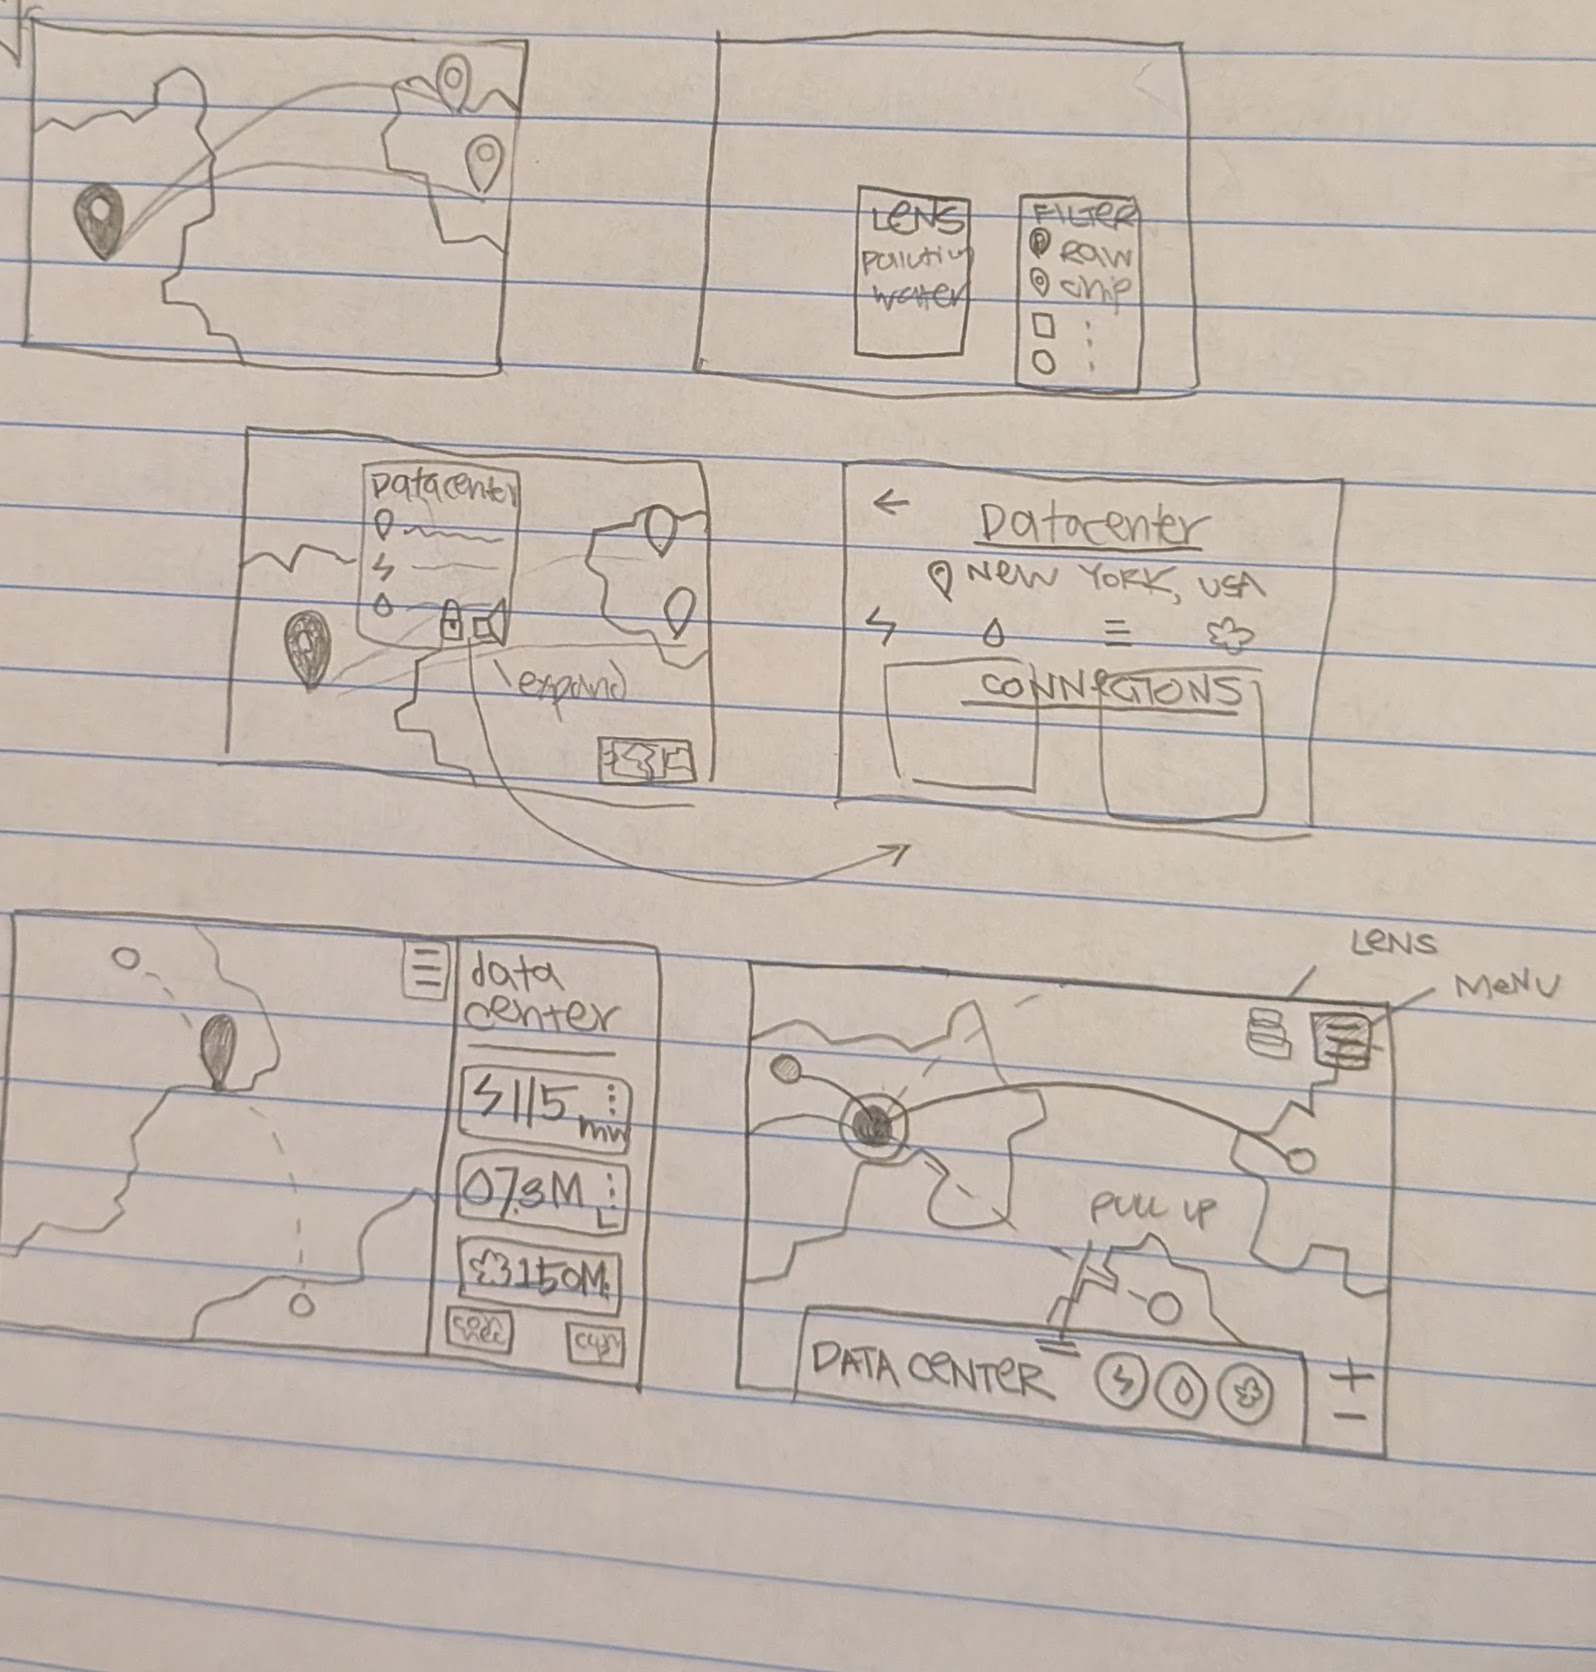
I started by doing research and creating a rough diagram of the AI supply chain on paper. Most of the initial drafting process was similar, done on paper through sketches and drawings. I worked in tandem with Claude Code for the development of the app itself.
Challenges we ran into
The biggest challenge I ran into was the simplification of the app. AI supply chains and their environmental impacts are complex and hard to visualize without it looking too complicated for a general audience. I had to find a good balance between accuracy and simplification, as well as fitting in definitions and instructions wherever I could. The UI in particular was hard to get right, as there was a lot of information to show at once. I spent a lot of time simplifying the interface so users wouldn't feel overwhelmed. Finding consistent data was also quite difficult, with many sources conflicting with each other or having sparse sample sizes.
Accomplishments that we're proud of
As a first-time hackathon participant, I'm genuinely most proud of creating a working app, as well as figuring out a way to visualize the AI supply chain. I learned a lot of valuable skills along the way, and I think the app reflects this journey as well.
What we learned
One of the biggest things I learned was the importance of user convenience. Even if an app has useful data and features, it can still be difficult to use if too much information is shown at once. Overall, I think that properly organizing information in a clear way and thinking about how a first-time user would move through the app during development contributes to a much more accessible product.
What's next for AI Supply Chain Atlas
I would like to add a manual for first-time users to guide them through the features and purpose of the app, as it might seem quite complex at first. I also want to add more real supply-chain sites, improve the environmental models, and add more detailed data for different facility types. Over time, I would like the Atlas to become a clearer and more complete way of understanding the supply chain and environmental impact of AI.


Log in or sign up for Devpost to join the conversation.