-
-
Real-Time Vehicle Detection
-
Live Traffic Intelligence Engine


🚦 AI-Powered Traffic Management System
🌟 Inspiration
Urban traffic congestion is a daily challenge in major Indian cities like Bengaluru, where fixed-time traffic signals fail to adapt to real-world traffic conditions. A widely discussed incident involving entrepreneur Prashant Pitti, who was stuck for nearly two hours on an 11 km stretch, highlighted how inefficient traffic management directly impacts productivity and quality of life.
This incident inspired us to design a smart, AI-driven traffic management system that dynamically adapts to real-time traffic intensity instead of relying on static signal timings. Our goal was to demonstrate how computer vision and real-time data streaming can be used to build scalable and intelligent urban traffic solutions.
🛠️ What We Built
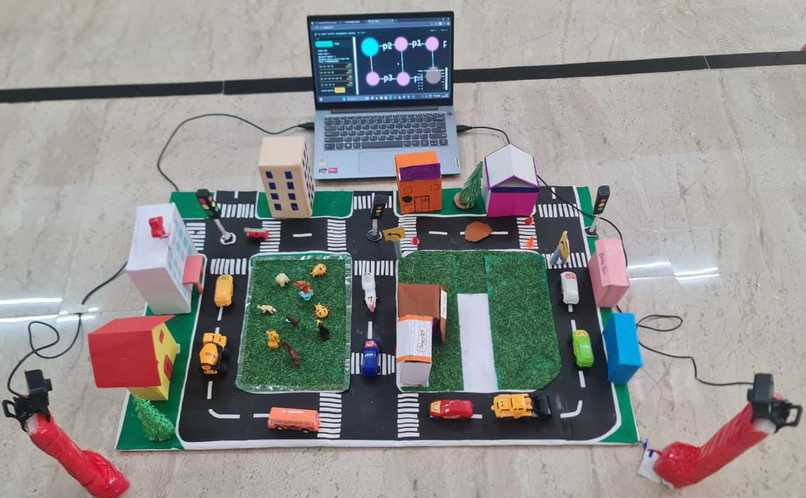
We developed an AI-Powered Traffic Management System for a city-like prototype consisting of:
- 6 junction points
- 7 connecting roads
- A graph-based city layout (two connected squares)
The system is capable of:
- Detecting vehicles using a deep learning model
- Assigning each detected vehicle to a specific road
- Calculating real-time traffic intensity
- Streaming live traffic data to a web dashboard
- Updating traffic conditions every second
- Displaying route comparisons between selected source and destination points
This enables users to analyze congestion levels and choose the least congested route in real time.
🔁 Scalability and Dynamic Road Expansion
The system is designed to be scalable and dynamically extensible. New roads can be added to the city layout without retraining the deep learning model.
When a new road is introduced:
- The road region is defined using a polygon
- Connections with existing roads are updated in the city graph
- The camera feed automatically detects vehicles on the new road
- Traffic intensity for the new road is calculated in real time
Since vehicle detection is independent of road count, the camera system identifies traffic on both existing and newly added roads using the same YOLOv11 model. This allows the system to adapt to changing city layouts, making it suitable for real-world urban expansion and smart city deployments.
⚙️ How We Built the Project
🔍 Deep Learning Model (YOLOv11)
We fine-tuned a pre-trained YOLOv11 object detection model specifically for vehicle detection.
- Traffic images were annotated using Roboflow
- Training was performed on Google Colab
- The model was trained for 100 epochs
- The best-performing weights were saved as
best.pt
Model performance:
- mAP@50: 99%
- Precision: 97%
- Recall: 98%
This ensured fast and highly reliable real-time vehicle detection.
Each detected vehicle is also assigned a confidence score, indicating how certain the model is about the detection.
🖥️ Backend Architecture (Software-Only Simulation)
To keep the solution fully software-based, we simulated live traffic cameras using a merged traffic video instead of physical cameras.
1️⃣ Camera Server (WebSocket – Port 8000)
- Implemented in
main.py - Continuously extracts frames from a video
- Merges two camera feeds into a 640 × 640 frame
- Streams frames in real time using WebSockets
- Loops the video to behave like a live camera feed
This allows full system testing without real hardware.
2️⃣ Road Mapping Module (draw.py)
- Used to manually define road regions
- Polygons are drawn around each road
- Coordinates are saved in
polygons.json - This step is done only once, unless the camera position changes
This ensures vehicles are accurately mapped to roads even if the camera angle changes.
3️⃣ Detection & Traffic Analysis (detect.py)
This is the core logic of the system:
- Receives frames from the camera server
- Runs YOLOv11 (
best.pt) for vehicle detection - Loads road polygons from
polygons.json - Checks whether detected vehicles fall inside a road polygon
- Counts vehicles for each road
- Computes traffic intensity
- Streams processed data via WebSocket (Port 8080)
Traffic Intensity Formula:
$$ \text{Traffic Intensity} = \frac{\text{Number of Vehicles}}{\text{Road Area}} $$
This provides a normalized congestion measure independent of road size.
4️⃣ Frontend (React + Vite)
- Built using React + Vite
- Connects to backend WebSocket (Port 8080)
Features:
- Live city graph
- Road-wise traffic intensity
- Real-time vehicle movement
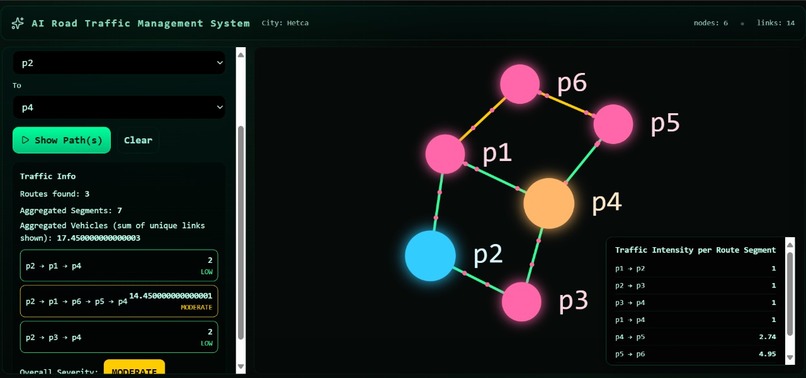
User capabilities:
- Select a source node (e.g., P1)
- Select a destination node (e.g., P4)
- View all possible routes
- Compare routes based on current traffic conditions
This creates a real-time traffic decision-making dashboard.
🚧 Challenges We Faced
- Fine-tuning YOLOv11 on a custom traffic prototype
- Achieving accurate polygon-based road mapping
- Handling real-time WebSocket communication
- Synchronizing backend AI outputs with frontend visuals
- Managing camera position changes without retraining the model
- Ensuring smooth real-time updates without lag
Each challenge helped us improve our system design, optimization techniques, and engineering skills.
📚 What We Learned
Through this project, we gained hands-on experience in:
- YOLO-based deep learning object detection
- Real-time computer vision systems
- Polygon-based spatial analysis
- WebSocket-based real-time data streaming
- Full-stack integration (AI backend + React frontend)
- Designing scalable smart city traffic solutions
Most importantly, we learned how AI can be applied to solve real-world urban problems using practical and deployable system architectures.
Log in or sign up for Devpost to join the conversation.