-
-
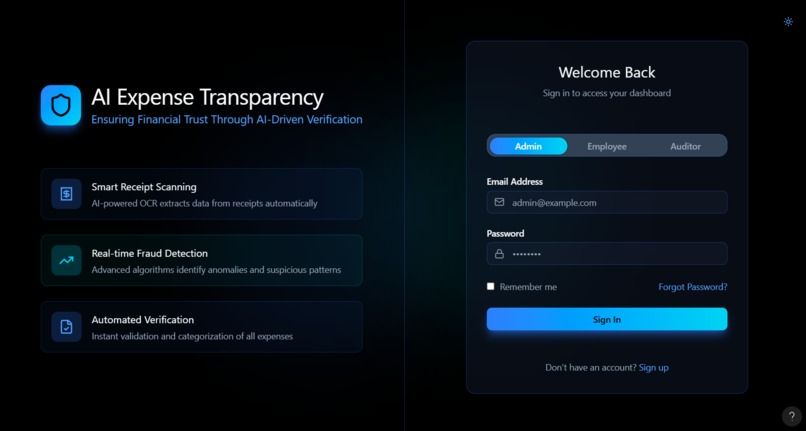
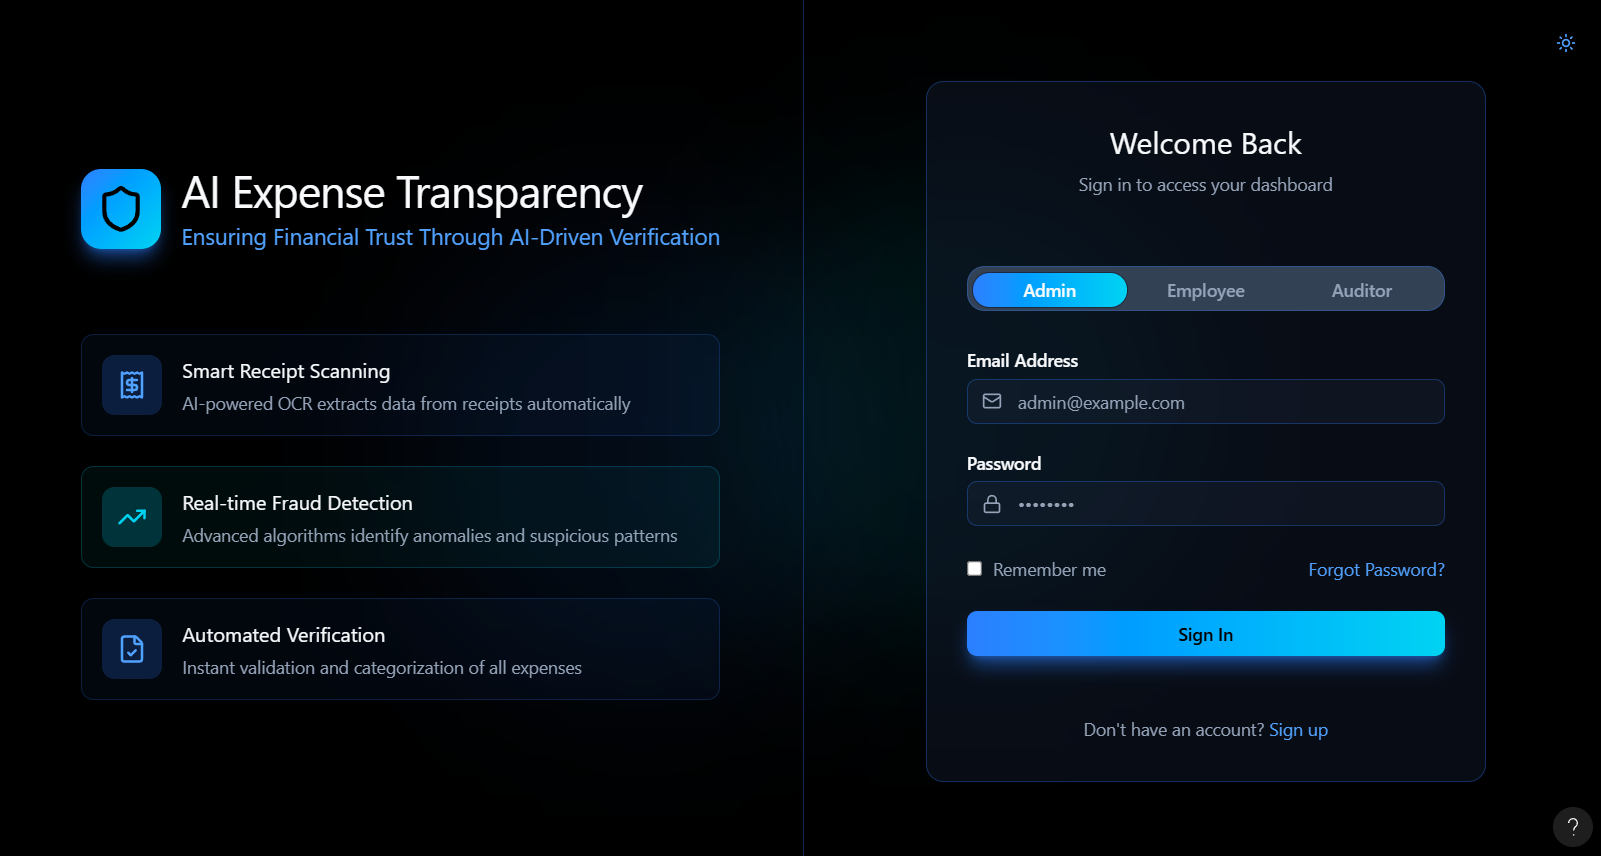
Login based users
-
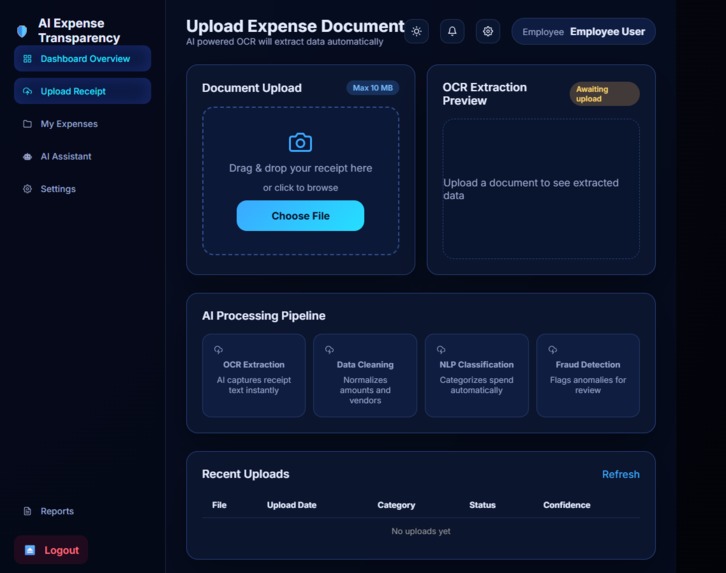
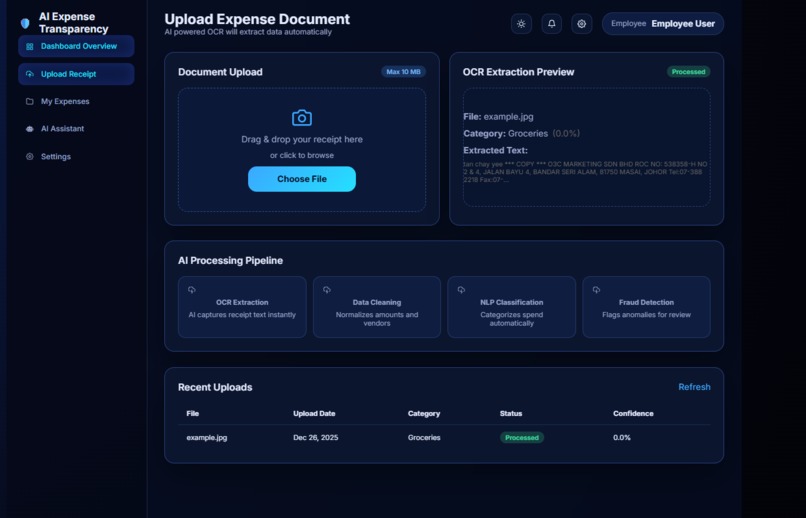
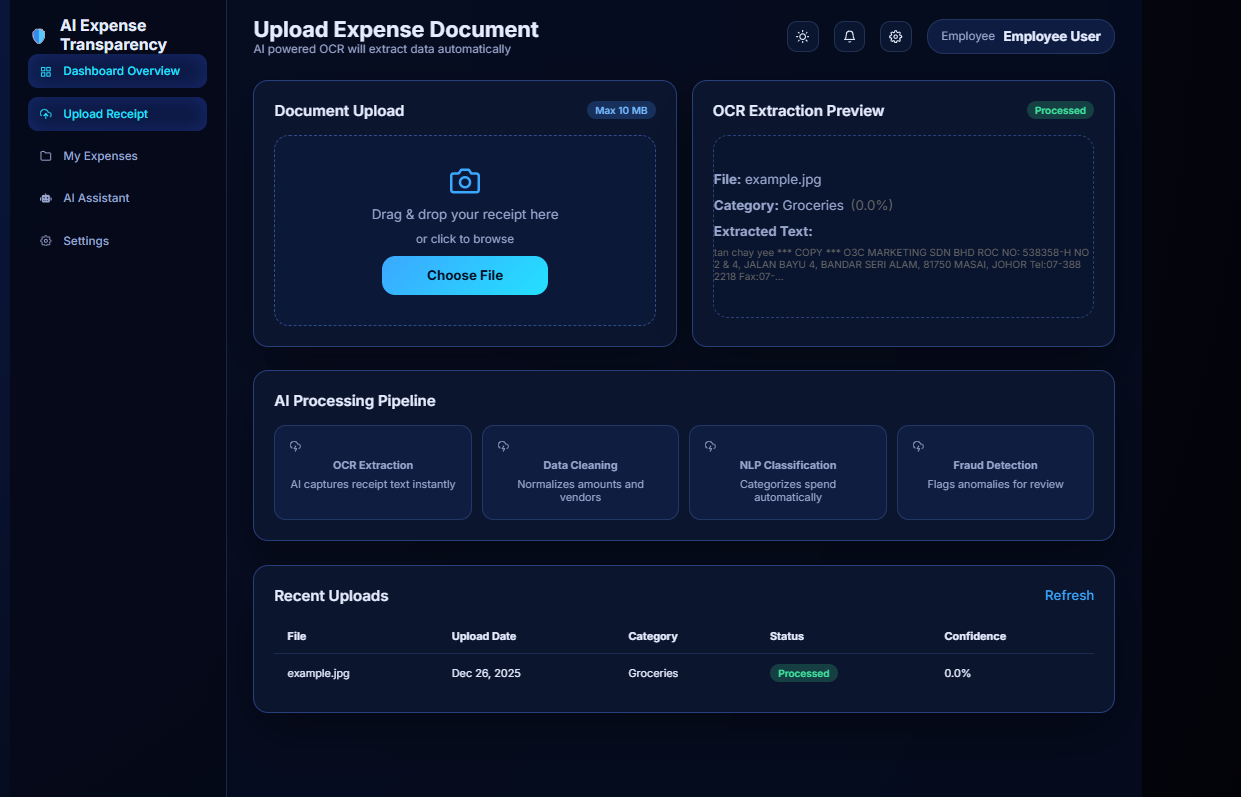
OCR extraction
-
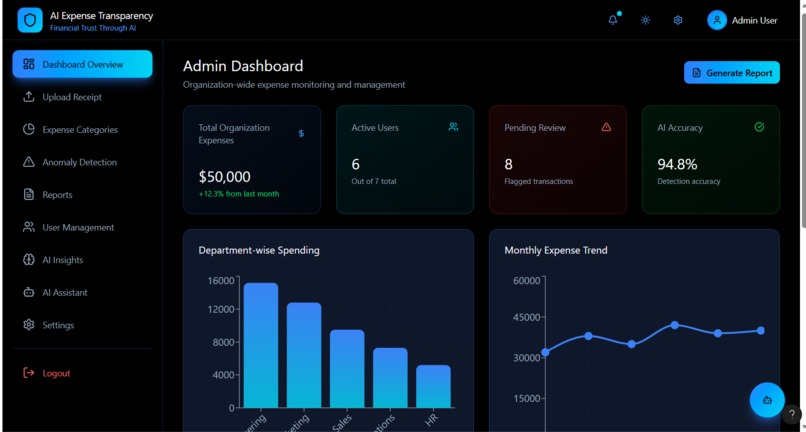
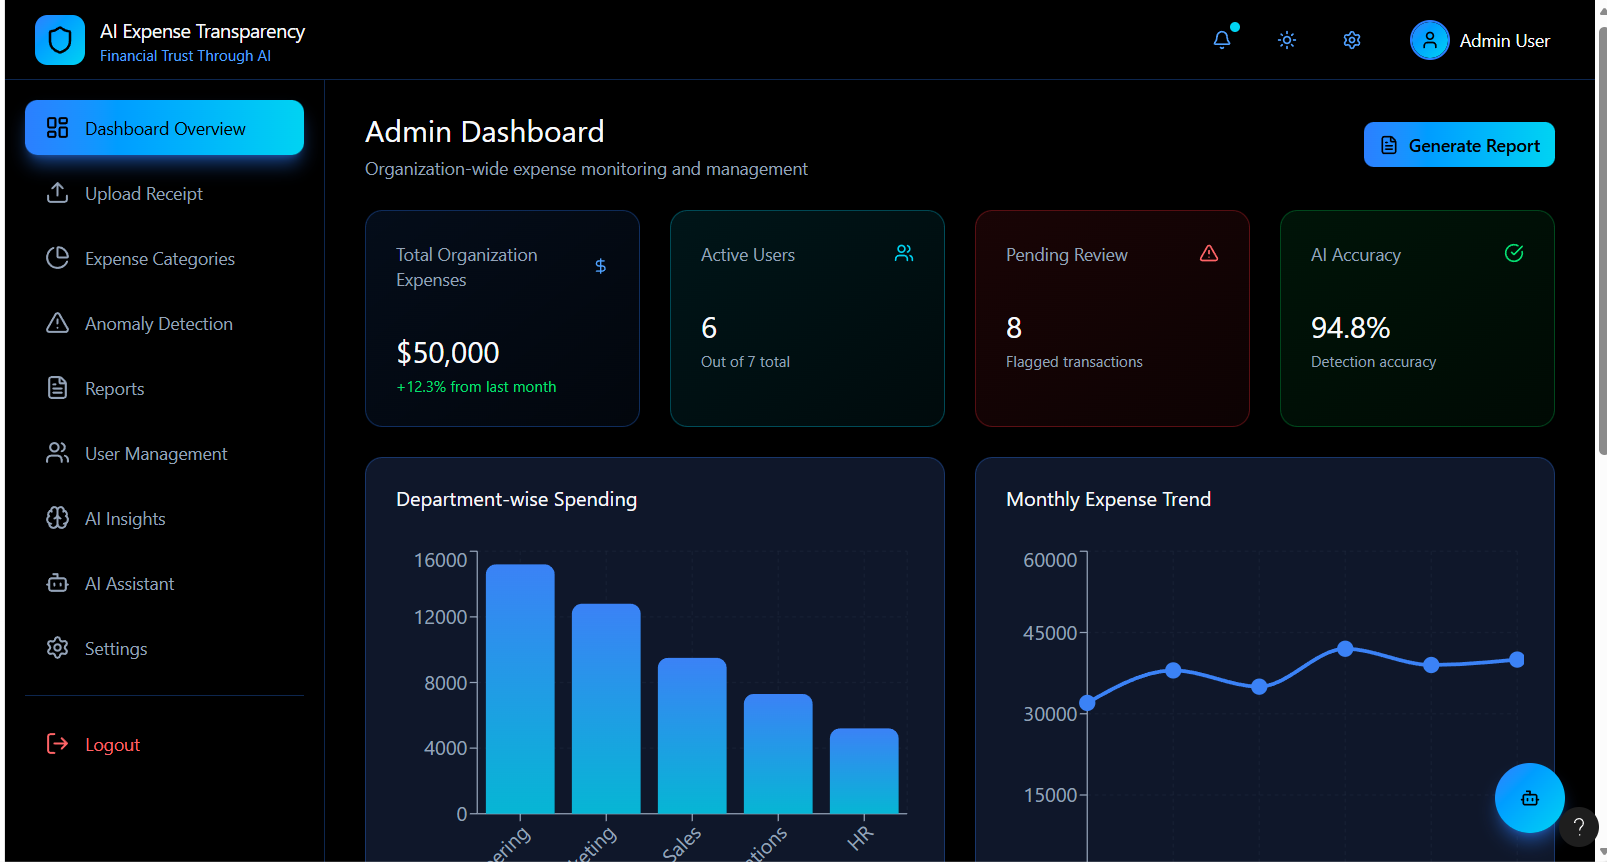
Admin users
-
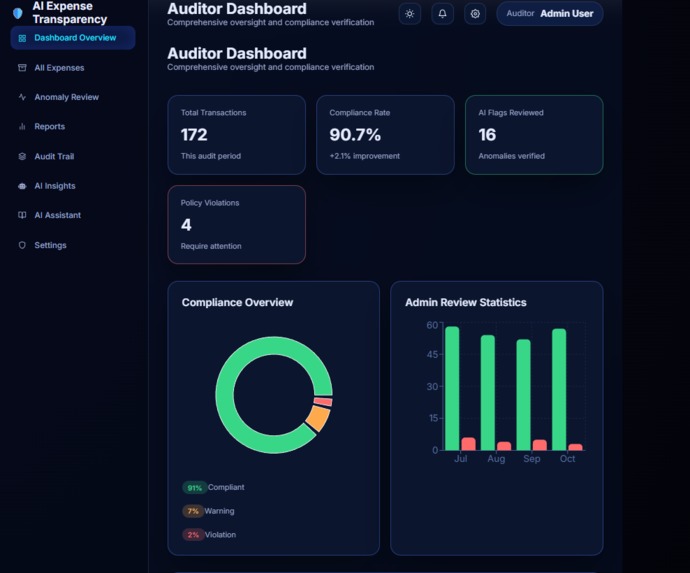
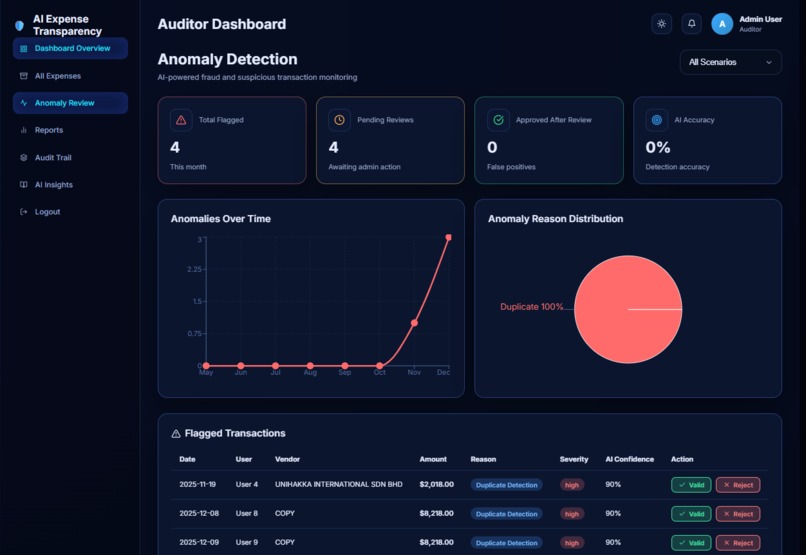
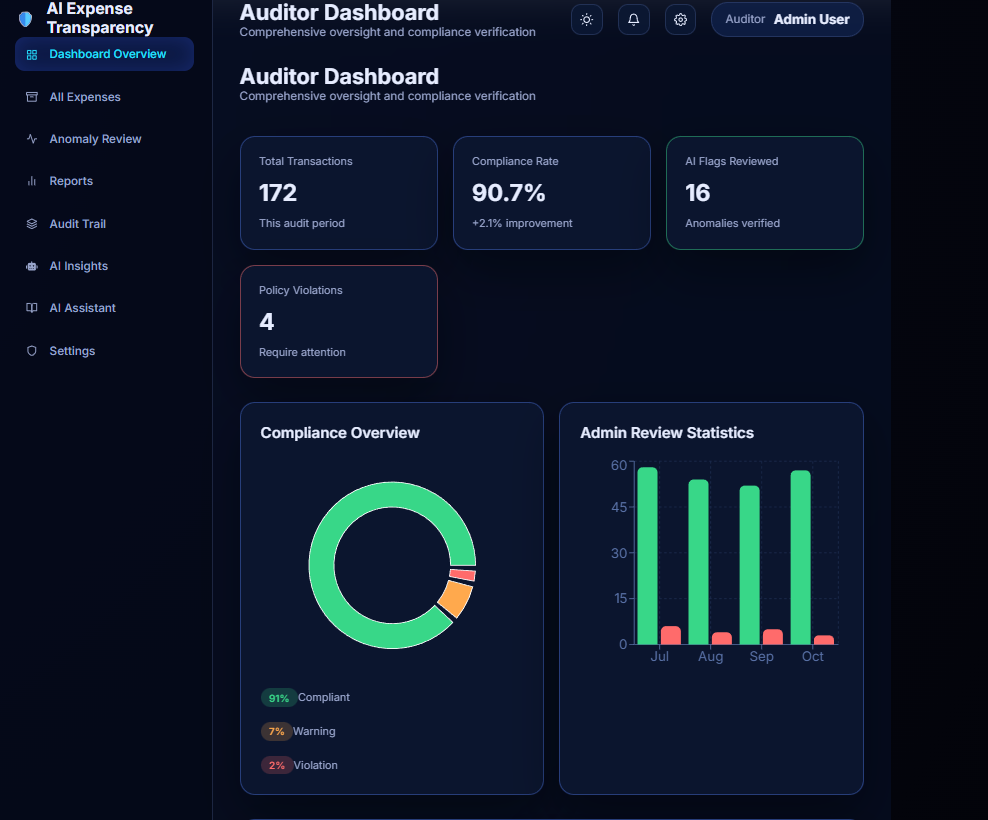
Auditor dashboard
-
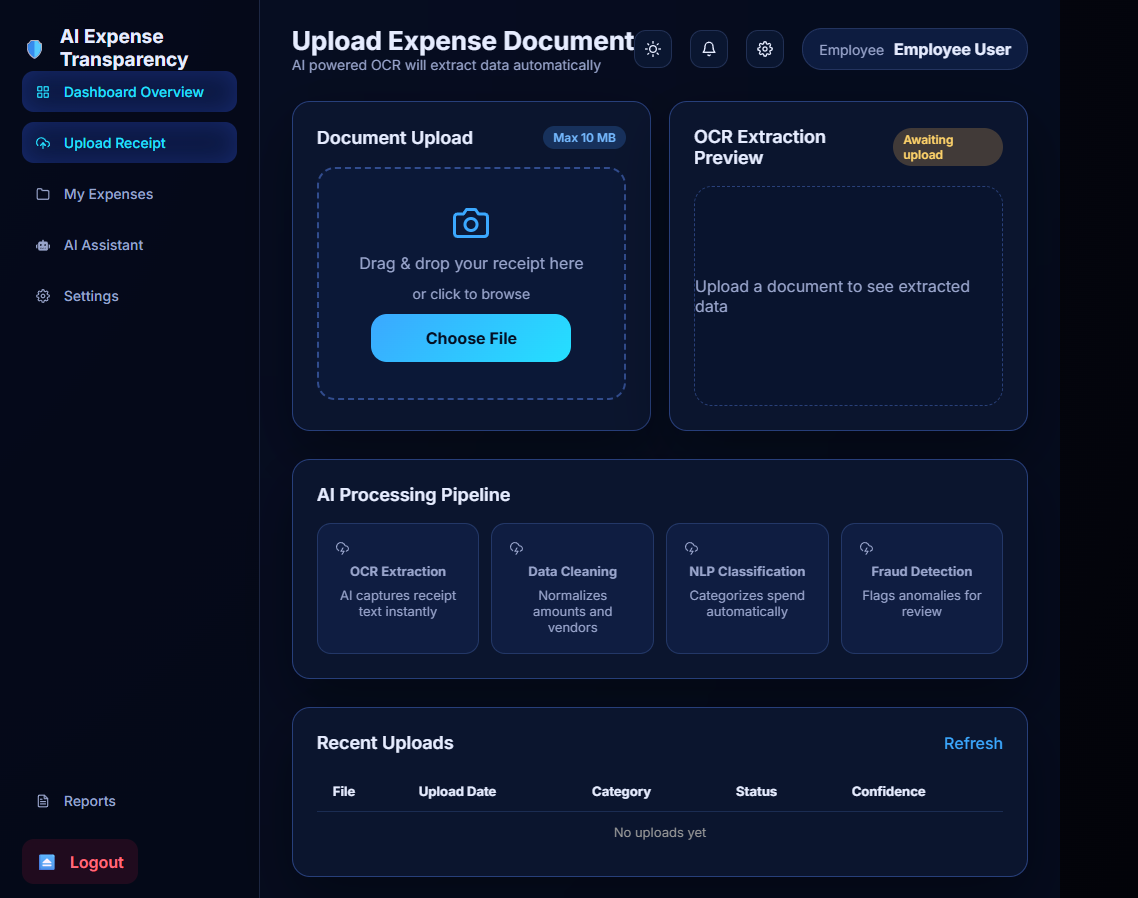
Employee user
-
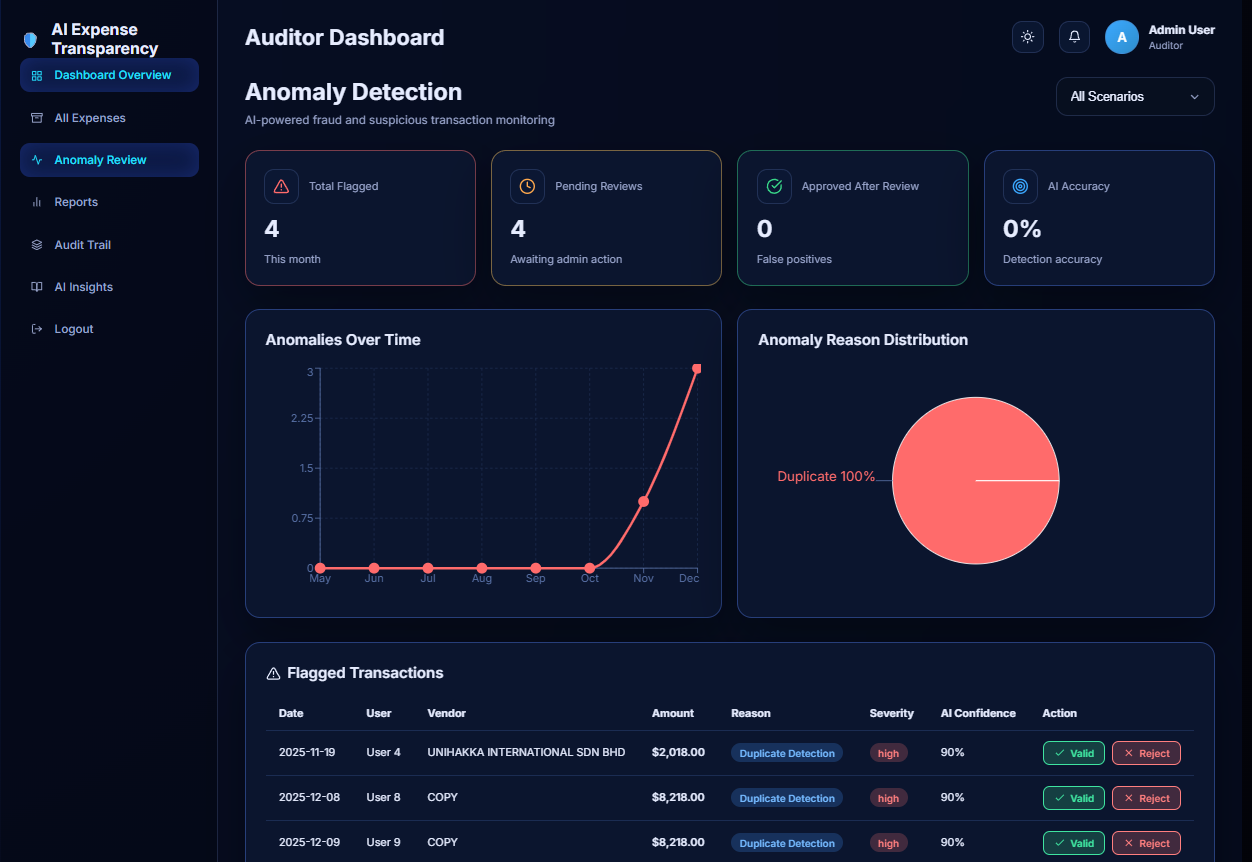
Anomaly detection
Inspiration
NGOs and small organizations play a crucial role in social development, yet many struggle with maintaining financial transparency. Manual bookkeeping, lack of real-time monitoring, and expensive audits often lead to mistrust among donors and stakeholders. We were inspired to build a system that uses AI to make financial accountability simple, affordable, and transparent for organizations working for social good
What it does
The AI Expense Transparency System automatically analyzes organizational expenses to ensure accountability and compliance. It classifies expenses, detects anomalies or unusual spending patterns, and provides explainable insights into why an expense is flagged. The system offers real-time dashboards for administrators and transparent, read-only views for donors, ensuring every rupee is traceable and justified.
How we built it
We built the platform using a web-based architecture with a React frontend and a FastAPI/Node.js backend. Expense data is ingested through manual entry, CSV uploads, or receipt images using OCR. AI models classify expenses and identify anomalies, while an explainability layer generates human-readable insights. All data is securely stored and visualized through interactive dashboards. 1.Total Expenses: Total Expenses=∑Expense Amount
- Category-wise Expense Percentage Category Share (%)=Category Expense/Total Expenses×100 3.Budget Utilization Budget Utilization (%)=Actual Spend/Allocated Budget×100
- Remaining Budget Remaining Budget=Allocated Budget−Actual Spend
- Monthly Burn Rate Burn Rate=Total Expenses in Period/Number of Months
- Expense Growth Rate Growth Rate (%)=Current Period Expense−Previous Period Expense/Previous Period Expense×100
- Anomaly Detection Score (Z-Score) Anomaly Score=Expense Amount−𝜇/𝜎 Where: μ = Mean expense amount σ = Standard deviation
(Flag as anomaly if |Score| > 2)Duplicate Expense Flag 8.Duplicate Flag={1,Same Vendor + Amount + Date {0,Otherwise
- Transparency Score (Composite Metric) Transparency Score=(0.4×Documented Expenses)+(0.3×(1−Anomaly Rate))+(0.3×Budget Compliance)
- Donor Impact Ratio Donor Impact Ratio=Total Expenses/Program Expense
Challenges we ran into
Handling inconsistent and incomplete expense data Designing explainable AI instead of black-box predictions Balancing simplicity for NGOs with analytical depth Ensuring scalability for organizations of different sizes
Accomplishments that we're proud of
Built a complete end-to-end AI expense auditing system
Successfully integrated PaddleOCR-VL with ERNIE in a multi-agent architecture
Created an explainable system that shows why an expense is flagged
Demonstrated real-world applicability for NGOs and small organizations
Aligned the project with transparency, accountability, and social impact
What we learned
Real-world financial documents are messy and inconsistent
Deep-learning OCR performs much better than traditional OCR methods
Multi-agent systems improve modularity and explainability
Combining statistical models with LLM reasoning leads to more reliable decisions
Explainability is essential for trust in financial AI systems
What's next for AI-Powered NGO Financial Transparency
Fine-tune PaddleOCR-VL for handwritten and multilingual receipts
Further fine-tune ERNIE for financial auditing and compliance reasoning
Add real-time alerts for suspicious transactions
Generate automated audit and donor-ready reports
Enable offline and edge deployment for low-connectivity environments
Built With
- charts
- distillbert
- forest
- isolation
- javascript
- matplotlib
- numpy
- pandas
- tesseract
- typescript
- typescript+javascript(tsx)-backend:-python-(flask/django-framework)-database:-sqllite-ai-&-ml:-scikit-learn
- visualization:

Log in or sign up for Devpost to join the conversation.