-
-
Mainpage
Inspiration
Made during AIDEV summit. What truly inspired us was the urgent need to make climate action accessible and engaging for everyone. We realized that while many people are aware of climate change, the concept of a "carbon footprint" often feels abstract and overwhelming. We wanted to transform this abstract idea into something tangible, measurable, and even enjoyable. Our goal was to build an application that empowers individuals to understand their environmental impact and provides clear, personalized pathways to reduce it, turning a global challenge into a series of achievable personal victories.
What it does
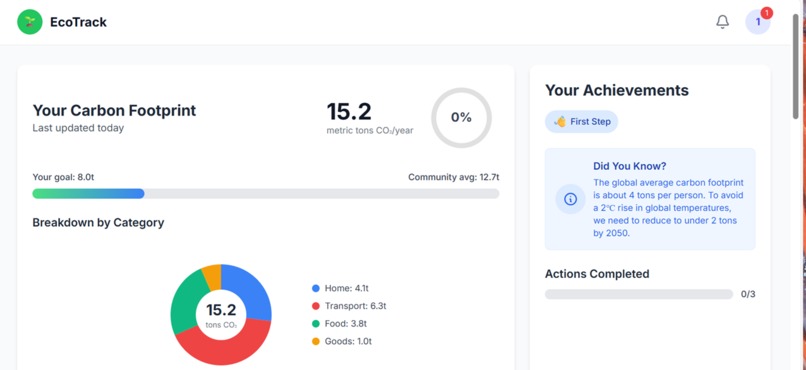
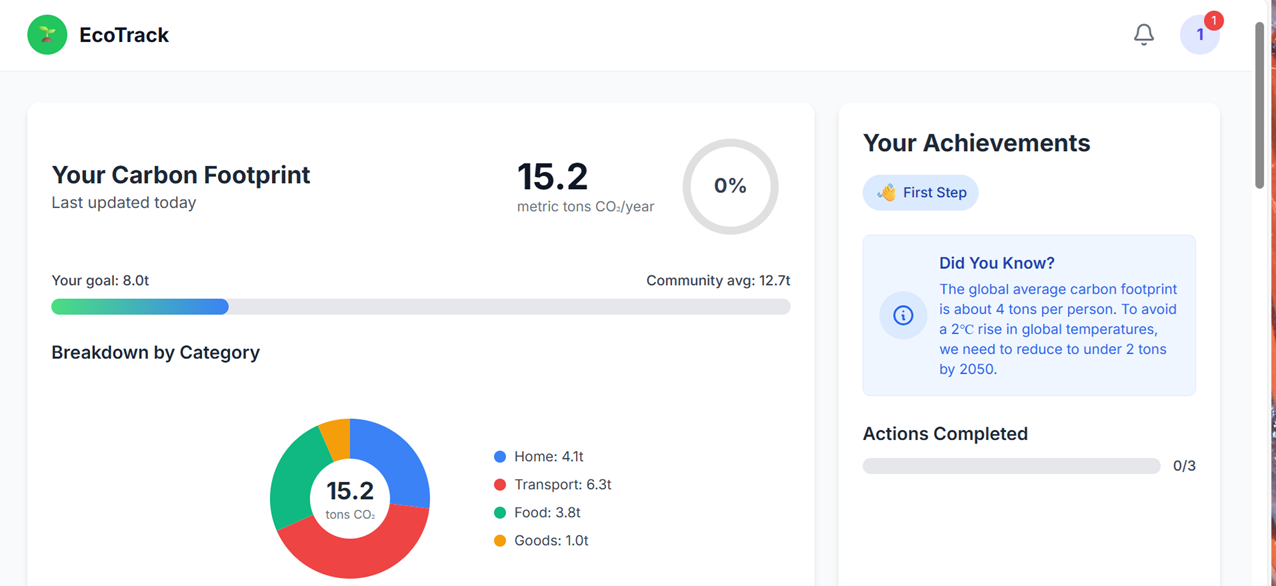
Our AI-Powered Carbon Footprint Tracker App helps users understand and reduce their environmental impact through a highly personalized and interactive experience. It features:
- AI-Powered Personalization: A simulated AI recommendations engine provides tailored actions to reduce your footprint, complete with impact calculations and difficulty ratings.
- Advanced Data Visualization: Interactive doughnut charts show your footprint breakdown, animated progress rings track your journey, and a trend line chart visualizes your progress over time. Community impact is also visualized to foster collective action.
- Gamification Elements: Earn achievement badges, track completed actions, and see how your efforts compare to the community, adding a fun and motivating layer to sustainability.
- Educational Value: Contextual information and clear explanations about carbon footprints and impact metrics empower users with knowledge to make informed decisions.
How we built it
We built the application using a modern web development stack designed for performance and responsiveness. The frontend is powered by React, providing a dynamic and component-based user interface. For robust state management, we integrated Redux, which efficiently handles all user data, recommendations, and progress tracking. Tailwind CSS was used for rapid and responsive UI development, ensuring a beautiful and adaptable experience across different devices. The core of our data visualization relies on Chart.js, enabling us to create interactive and animated charts like the doughnut and trend line graphs. We simulated API calls to demonstrate proper loading states and a dynamic user experience, and all dependencies are loaded via CDNs to ensure the application runs smoothly in any modern browser environment.
Challenges we ran into
One of the primary challenges was simulating a convincing AI recommendations engine without a live backend. We had to design intricate logic to ensure recommendations adapted intelligently to user actions and progress, providing a personalized feel. Another significant hurdle was optimizing the data visualizations for both aesthetic appeal and performance. Crafting smooth animations and interactive charts with Chart.js, especially with multiple data points, required careful fine-tuning. Furthermore, integrating gamification elements seamlessly into the educational and tracking aspects while maintaining a clear user flow presented an interesting design challenge. Finally, ensuring the entire application could run effectively within a constrained browser environment (like the one used for the hackathon) with all dependencies loaded from CDNs required meticulous dependency management.
Accomplishments that we're proud of
We are most proud of successfully creating an application that makes the abstract concept of a carbon footprint tangible and actionable for users. The AI-powered personalization stands out, offering tailored advice that genuinely feels responsive to individual progress. The advanced data visualizations are another major accomplishment; they transform complex data into easily understandable and engaging visuals, making the journey of reducing one's footprint truly motivating. The seamless integration of gamification elements to foster engagement and community spirit is something we're particularly pleased with, as it adds a unique layer to environmental action. Finally, the technical sophistication of using Redux for state management and creating a responsive design showcases our ability to build a robust and user-friendly application.
What we learned
This project was a fantastic learning experience across multiple domains. Technically, we gained deeper expertise in Redux patterns for complex state management and mastered advanced techniques with Chart.js for dynamic and interactive data visualization. We also learned invaluable lessons in designing user experiences that are both educational and highly engaging, balancing detailed information with clear, actionable insights. Furthermore, the process of simulating complex backend logic (like AI recommendations and API calls) for a frontend-only project taught us a great deal about frontend architecture and anticipating real-world data interactions. We reinforced the importance of responsive design and the power of well-chosen libraries in creating a polished product.
What's next for AI-Powered Carbon Footprint Tracker App
For the future of the AI-Powered Carbon Footprint Tracker App, we envision several exciting developments:
- Integration with Real-World Data Sources: Connecting to actual APIs for more precise impact calculations (e.g., from utility providers or product databases) would significantly enhance accuracy.
- Expansion of AI Recommendation Engine: Implementing more sophisticated machine learning models to provide even more nuanced and predictive recommendations based on user behavior and broader environmental data.
- Community Features and Social Sharing: Expanding beyond simple comparisons to include team challenges, leaderboards, and easy sharing of achievements to foster a stronger community.
- Localized Recommendations: Tailoring actions to specific geographical regions, considering local infrastructure, climate, and available resources.
- Partnerships and Incentives: Exploring collaborations with sustainable businesses to offer discounts or incentives for users who achieve certain carbon reduction milestones.
- Mobile App Development: Creating native iOS and Android applications for a more integrated and accessible user experience.
Built With
- chart
- html5
- javascript
- react
- redux
- tailwind

Log in or sign up for Devpost to join the conversation.