-
-

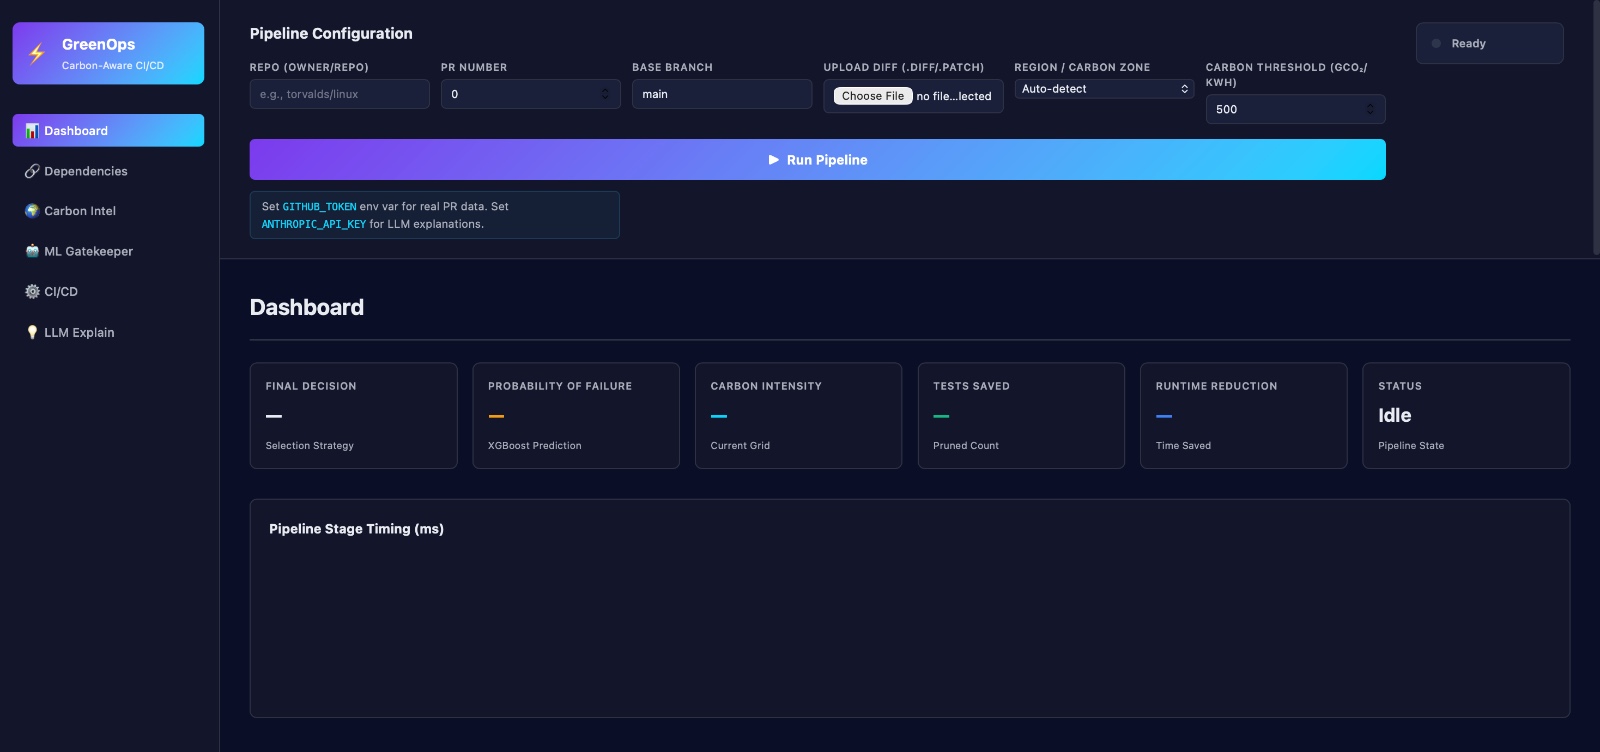
Dashboard
-

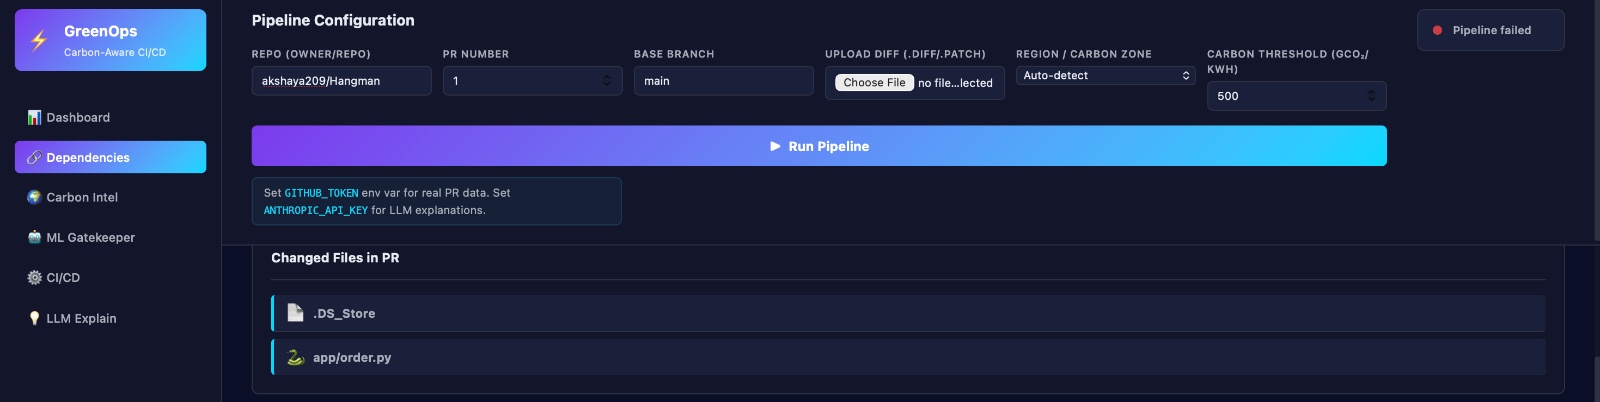
Dependency
-
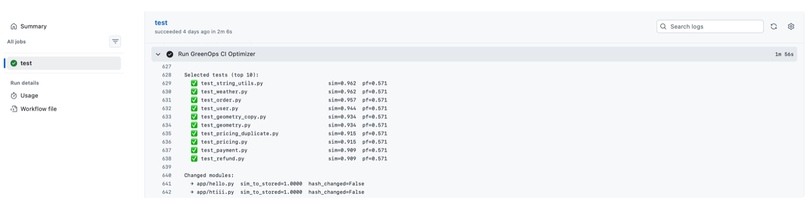
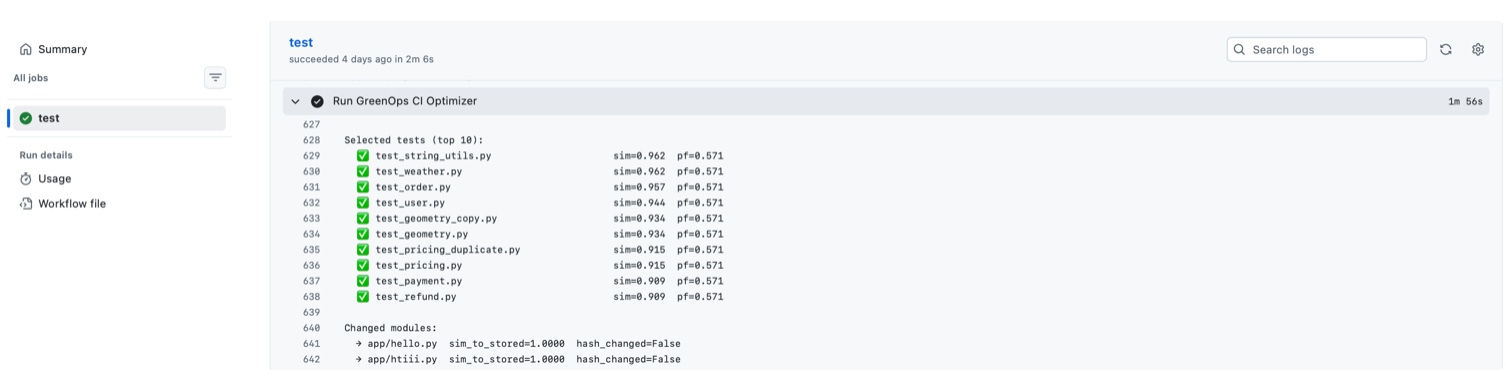
GitHub Actions integration
-

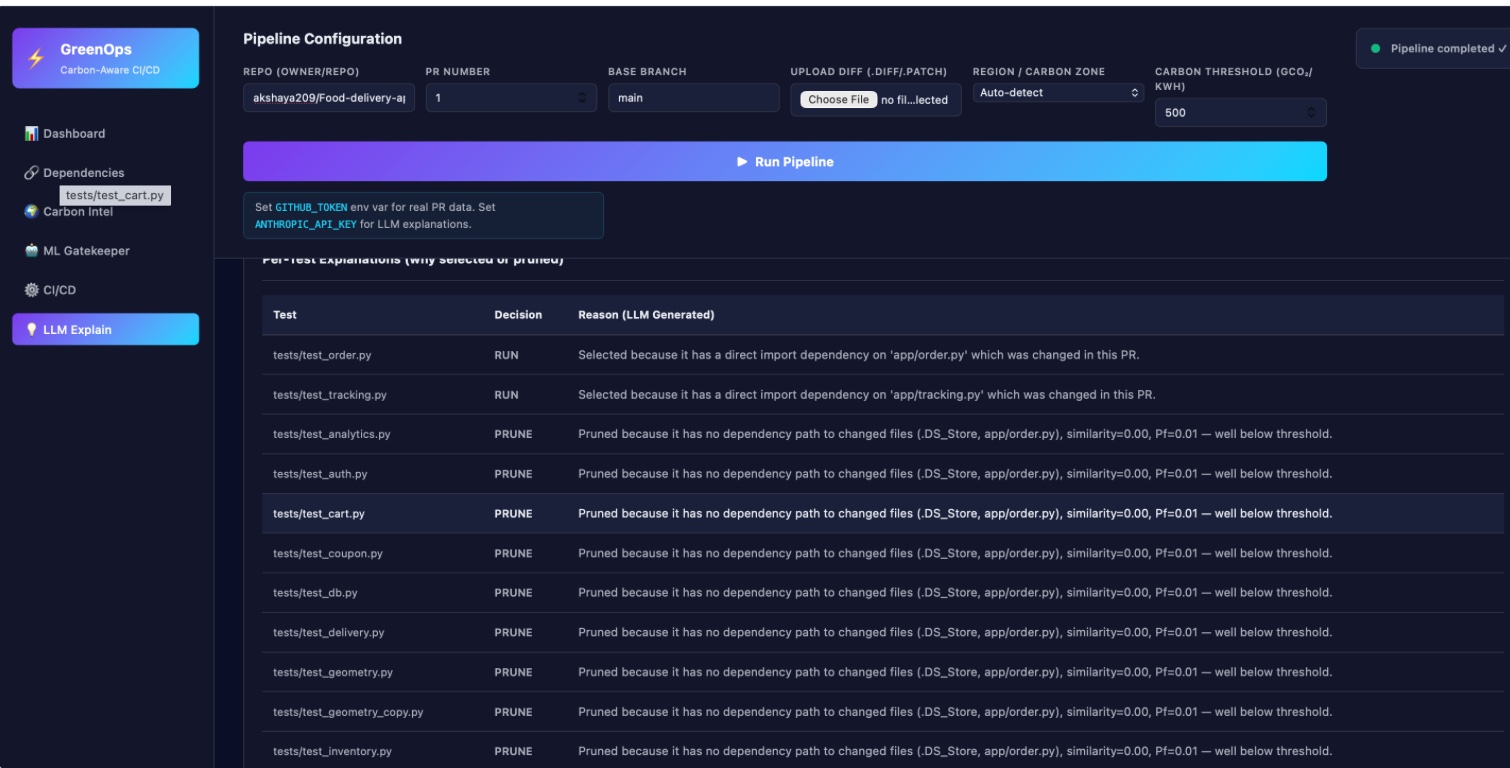
LLM explanation
Inspiration
Cloud systems that are up to date look clean, but they aren't. Every build, test run, and deployment burns energy somewhere in a data center. Ideas: Make things that are hidden clear. Your pipeline might: Show the real-time carbon intensity per job on the surface Show "this deployment puts out X grams of CO₂" Make emissions a top-notch metric, like cost or latency. This changes the way engineers think about decisions completely.
What it does
This project is an intelligent CI/CD optimization engine that cuts down on unnecessary test runs, predicts failures, and schedules workloads in a way that is good for the environment. It doesn't run all the tests for each pull request; instead, it Understands the code change in terms of structure (AST) and meaning (embeddings) Finds out exactly which modules are affected Tells you which tests are most likely to fail Only runs the tests that matter the most Plans them for the data centers with the least carbon emissions The end result:
- Lower cost of computing
- smaller carbon footprint
How we built it
We made this system by putting together smart parts that each fix a different problem with traditional CI/CD.
- Analyzing and fingerprinting PR When a PR comes in: We make a hash to make it easy to find. Make an AST (Abstract Syntax Tree) to see how things are put together. This lets us look at changes in relation to past PRs.
- Finding Similarities We see if there is already a similar AST: If so, use the dependency insights from before. If not, make a new analysis pipeline. This stops you from having to start over and do everything again.
- GraphCodeBERT for Semantic Understanding We use GraphCodeBERT embeddings to understand what code means, not just how it looks. This helps find: Dependencies that aren't direct Impact across modules Relationships that aren't obvious
- Making a Dependency Graph We put together: Structure of AST Importing relationships Shared systems (like DBs and Kafka messaging) are used to make a full dependency graph of the PR.
- The LLM Reasoning Layer An LLM gets the graph and embeddings. The LLM: Understands dependencies Makes a graph of dependency flow Finds affected modules using reasoning that takes context into account
- Using XGBoost to Predict Failure We give: Data on dependencies Telemetry of historical test failures into an XGBoost model It: Tells you which tests are likely to fail Removes test cases that aren't needed, leaving a small but valuable test suite.
- Scheduling with Carbon Awareness 🌱 This is where things get interesting. Estimating Energy We figure out how much energy each test suite uses by using: Counts of operations CPU cycles Modelling Carbon We employ: Data on the mix of energy sources (hydro, nuclear, thermal) Data sets that show how much CO₂ is in the air (like Ember) Carbon APIs for each area Smart Execution The system picks the data center that has the cleanest data. For example: Run in Mumbai or Delhi, depending on how much carbon there is.
Challenges we ran into
Graphcdebert takes too much time to get installed in the GitHub Actions, making the test suite run slower than usual
Accomplishments that we're proud of
Not only prunes test cases but also provides the dependency flow graph and llm generated explanation for each one of these pruned cases for verification
What we learned
Learned to combine ML model and LLM to solve a real world problem
What's next for Ai powered Carbon aware CI/CD pipeline optimiser
Scale it so that it works realtime with industry level codebase as well, reduce the time graphcodebert takes to generate embeddings and llm to create dependency flow graph
Built With
- anthropic-api
- electricity-api
- graphcodebert
- javascript
- python
- sql

Log in or sign up for Devpost to join the conversation.