-

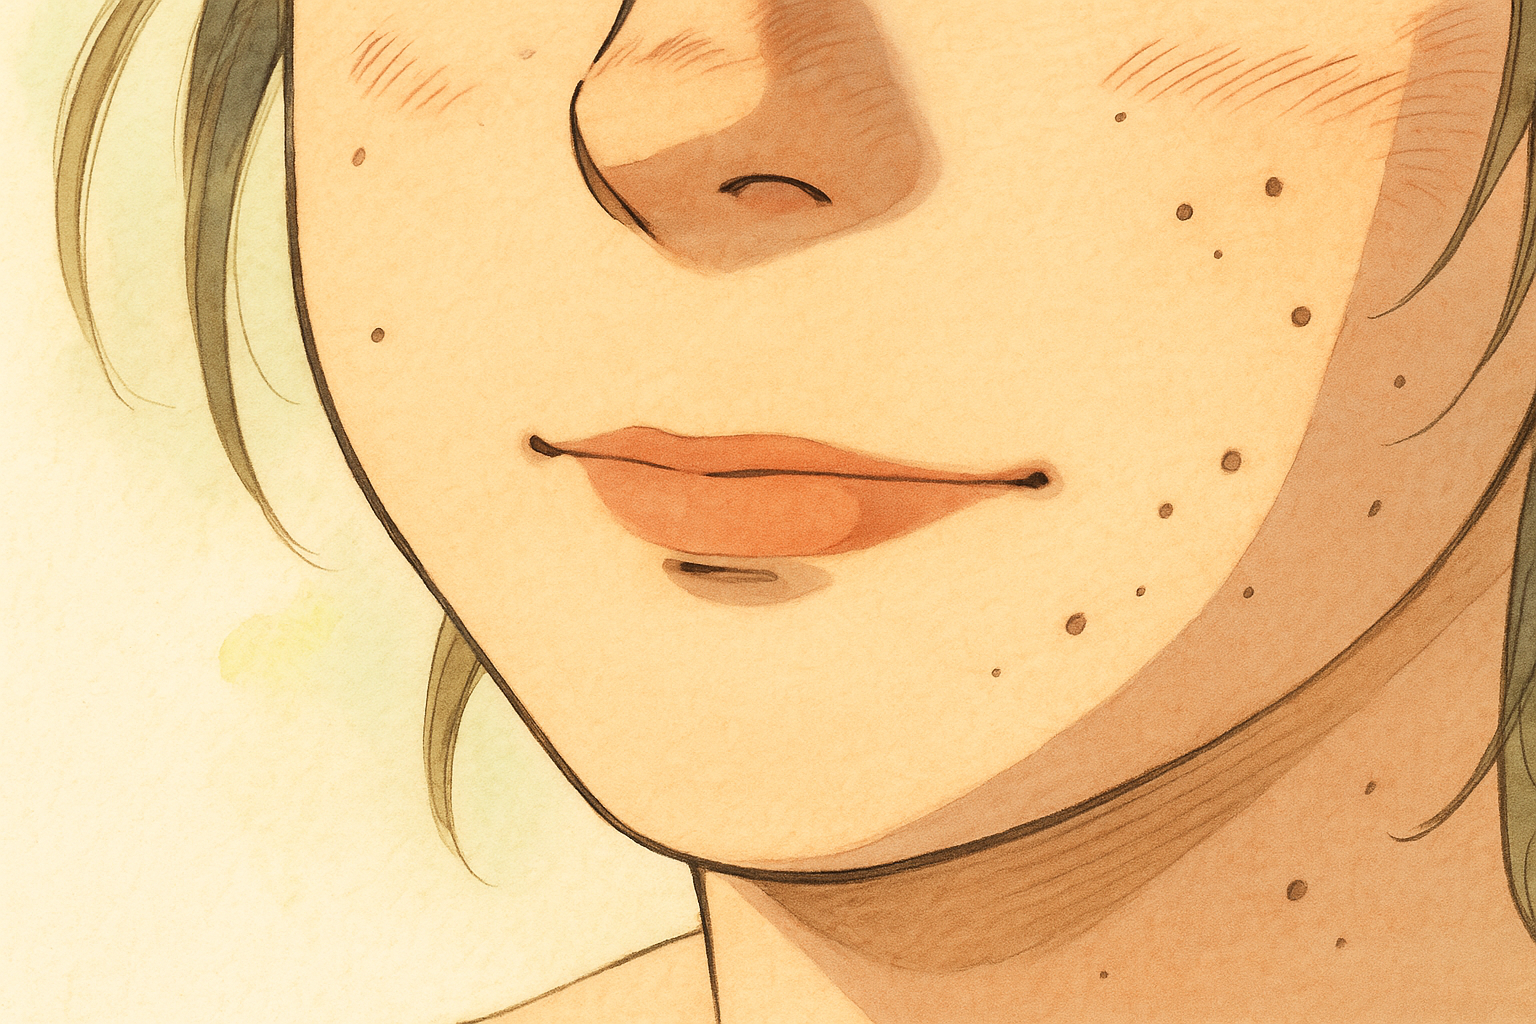
original image
-
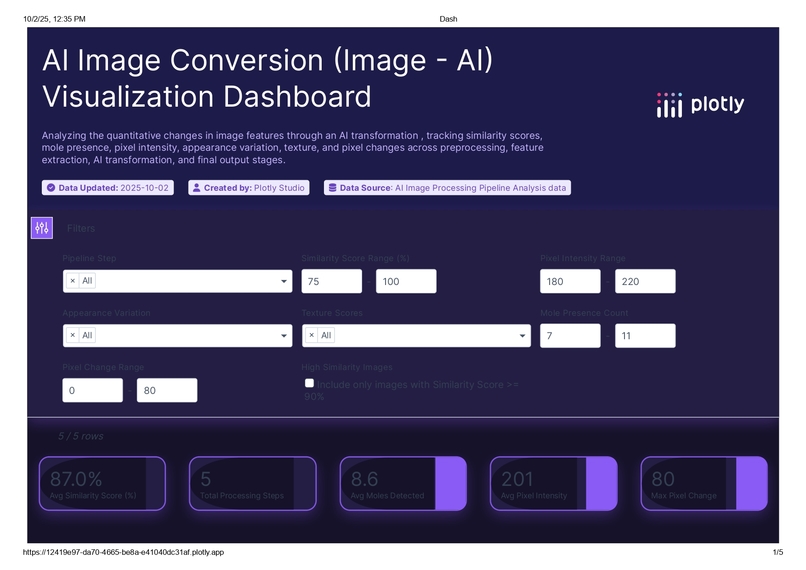
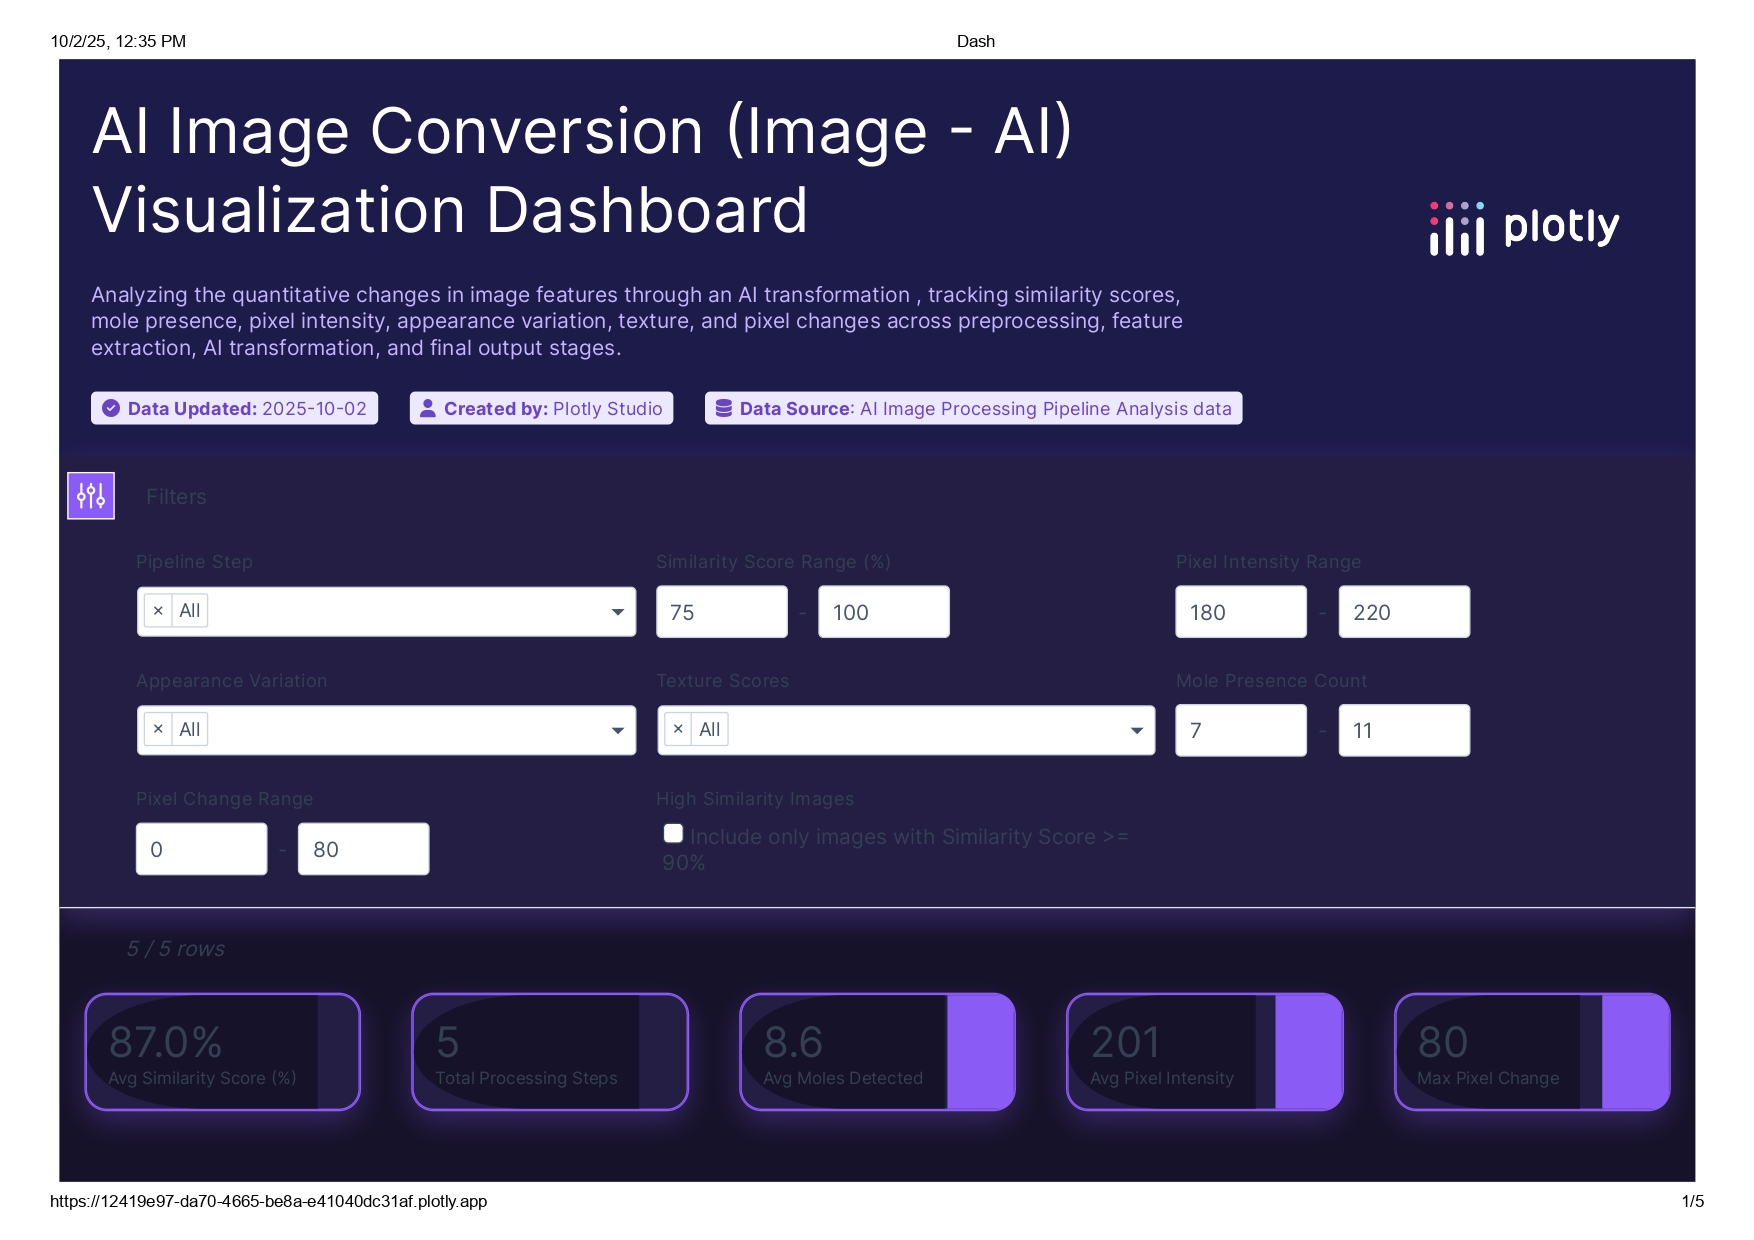
Front paghe of the dash borad
-
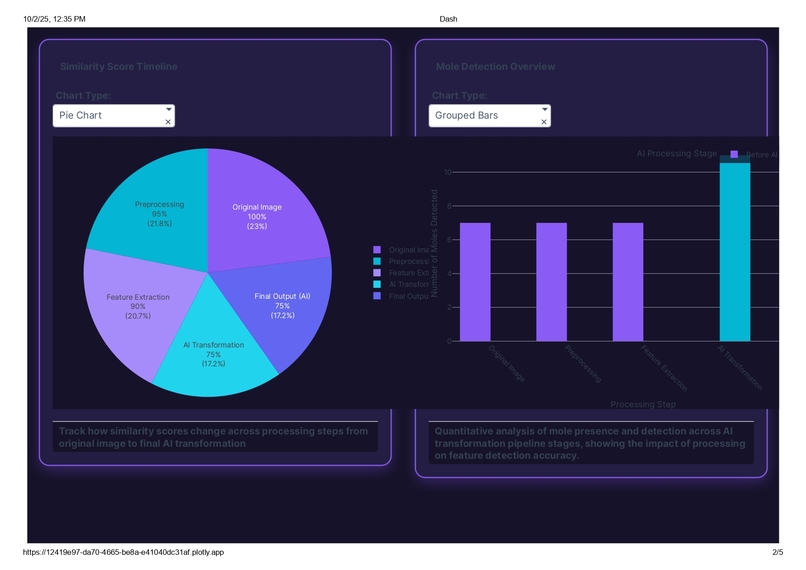
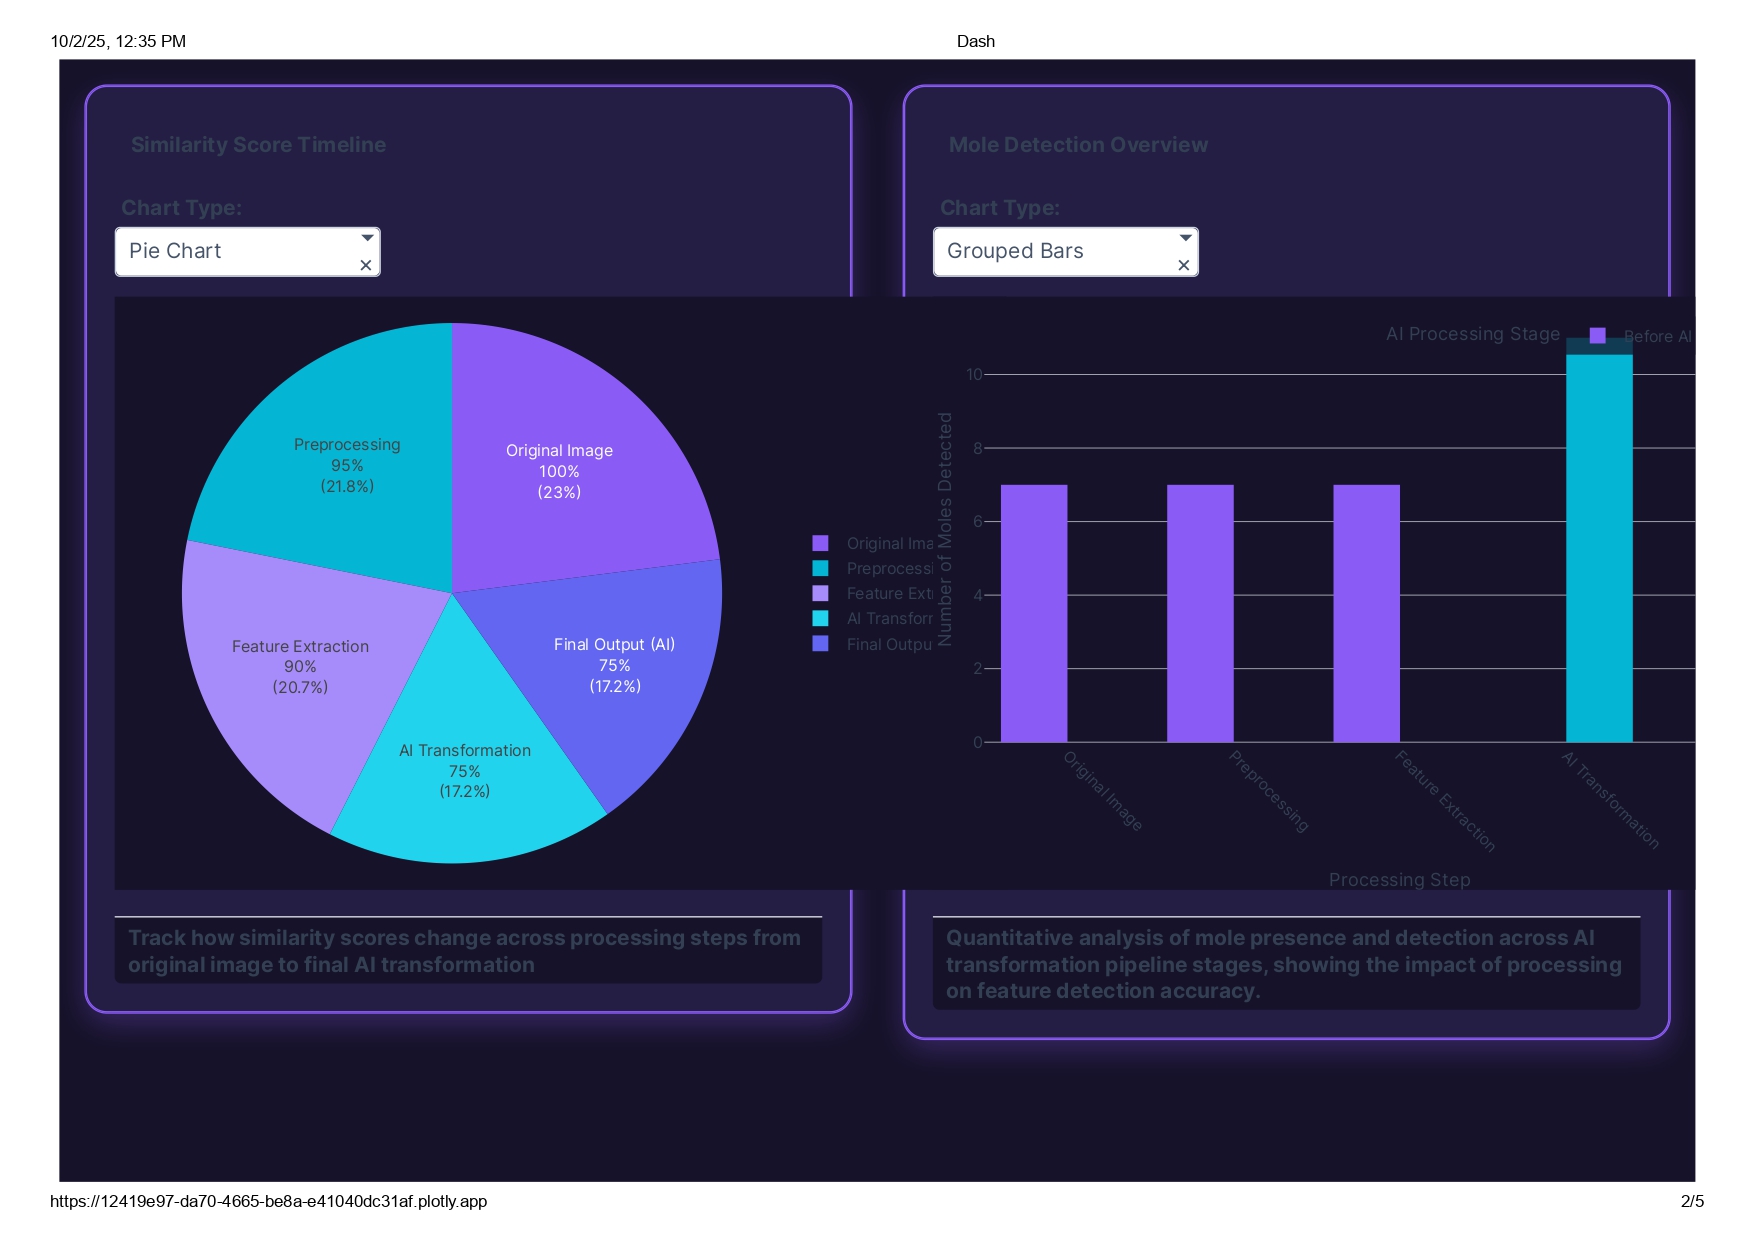
(Pie chart & Donut chart) && (stack Bars & Grouped Bar)
-
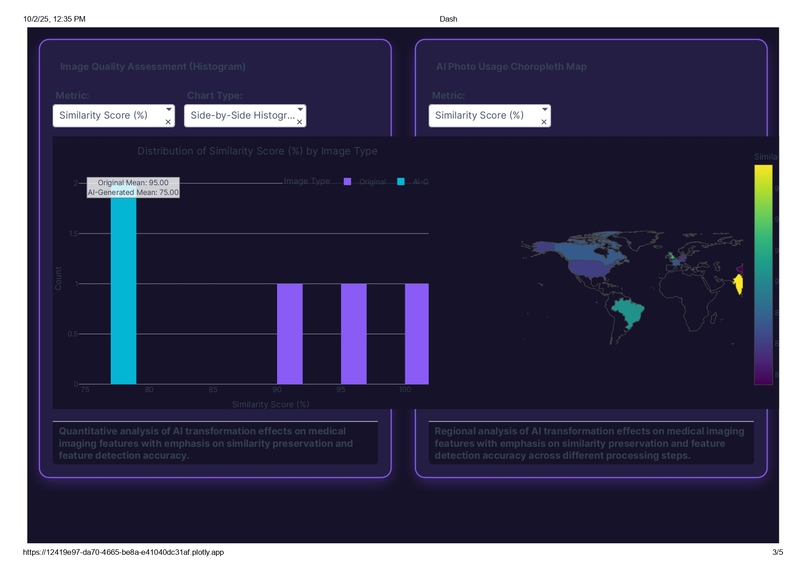
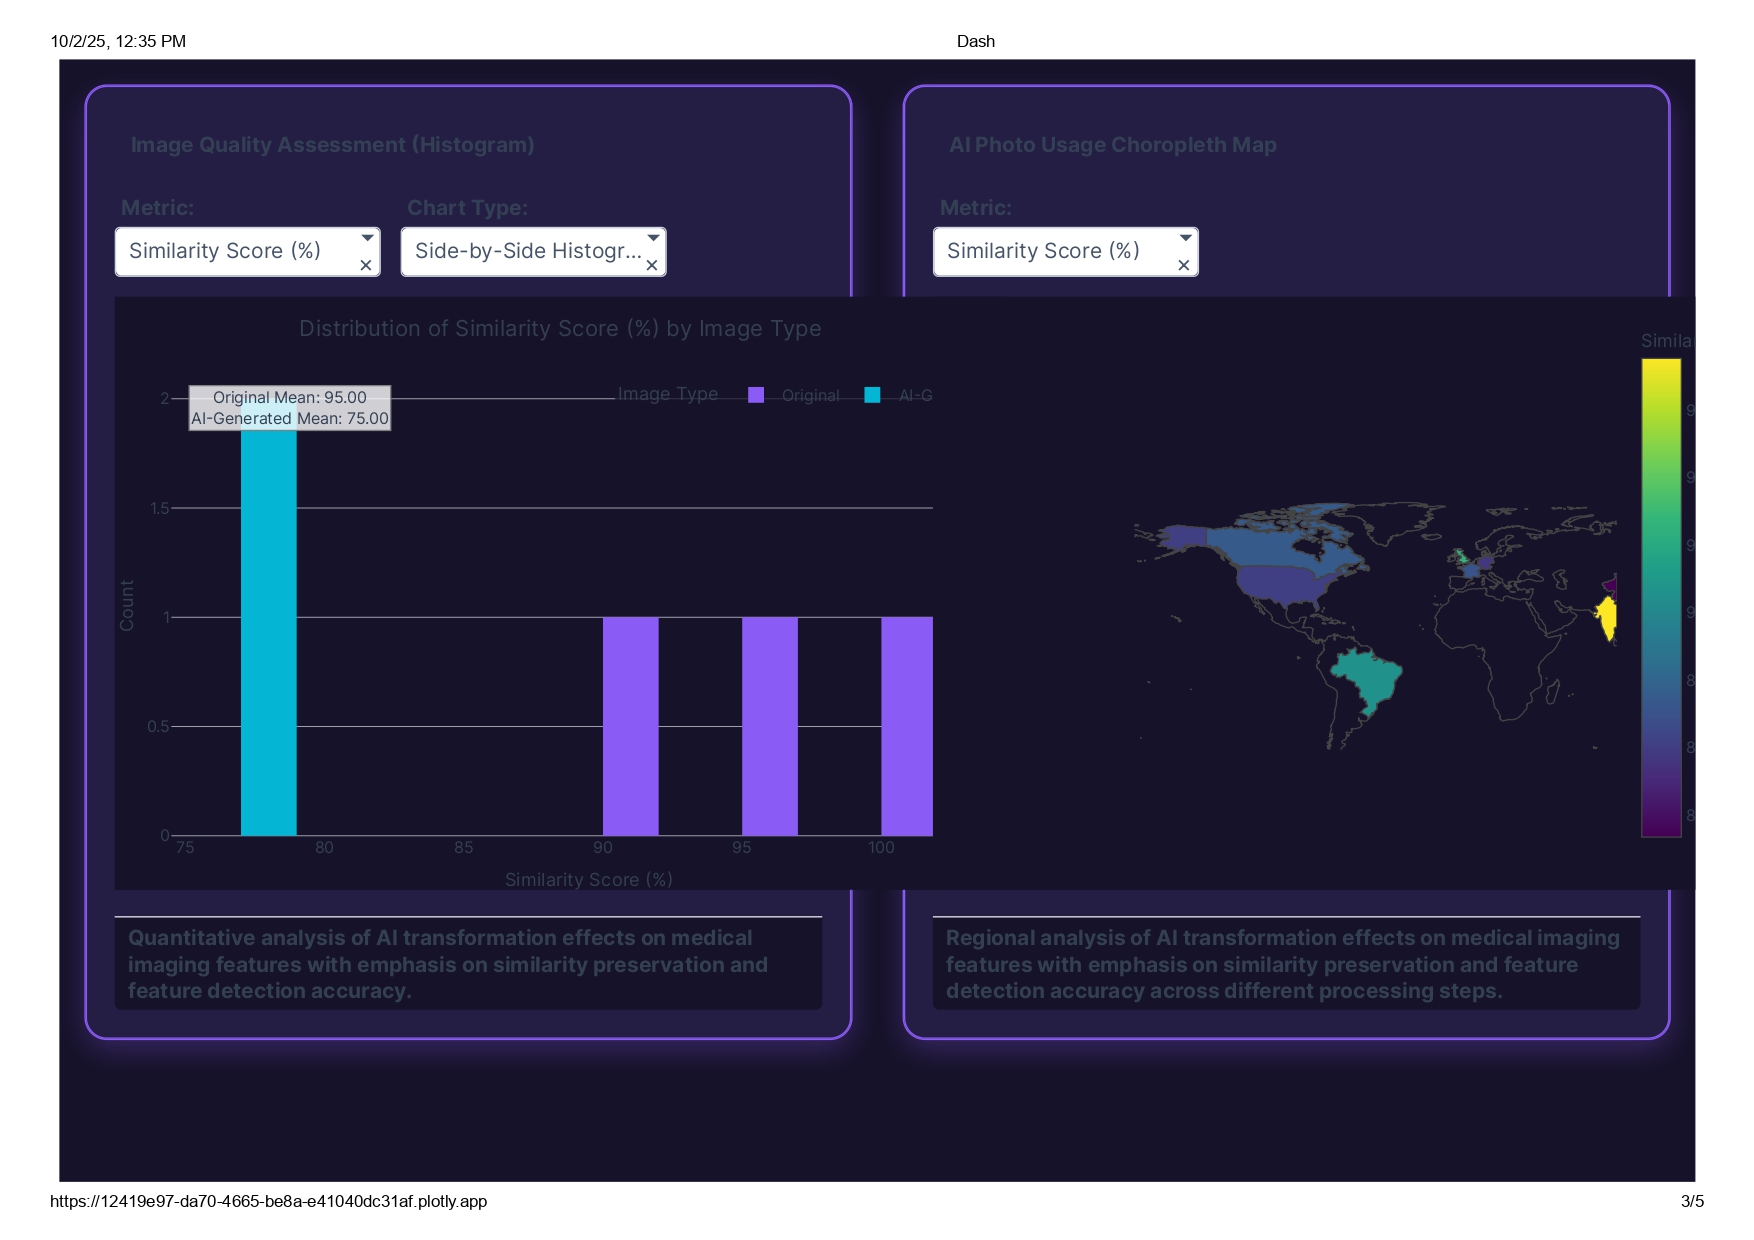
(Histogram & Box Plot) && choropleth
-
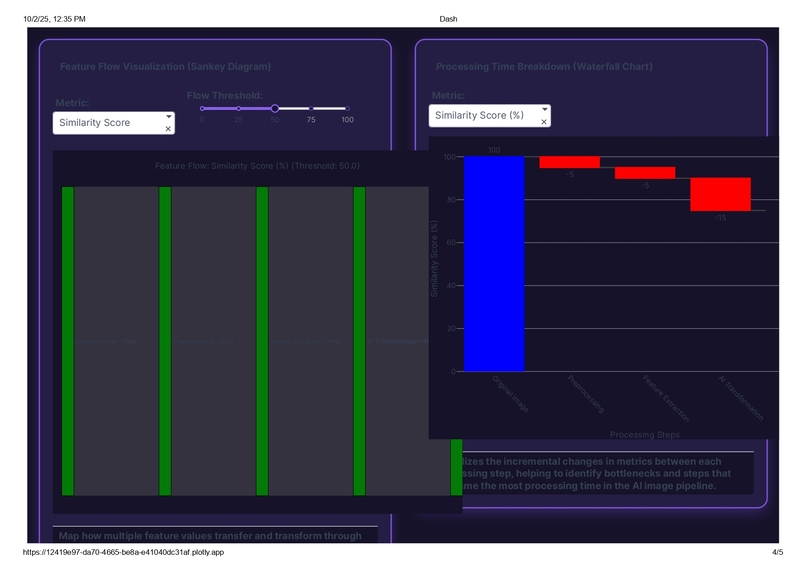
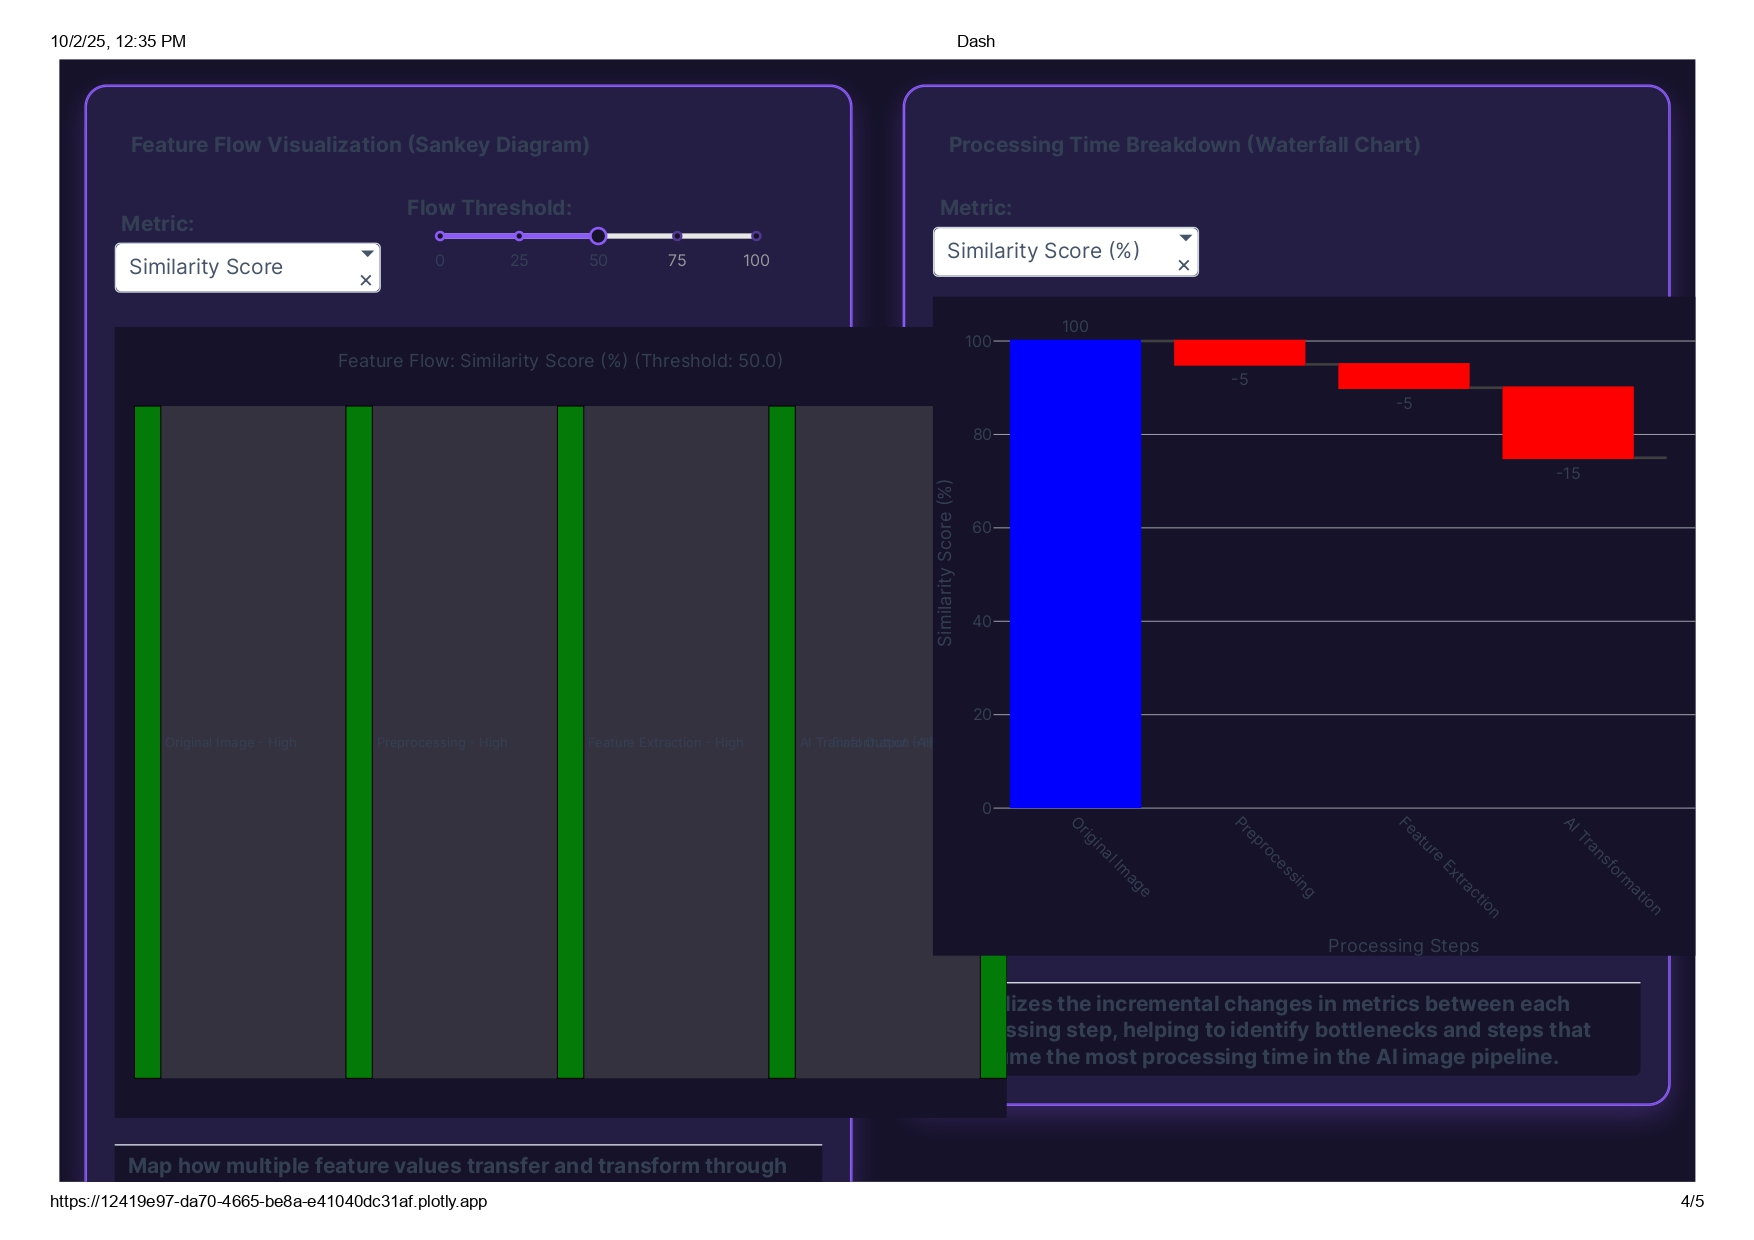
Sankey Diagram && Waterfall chart
-
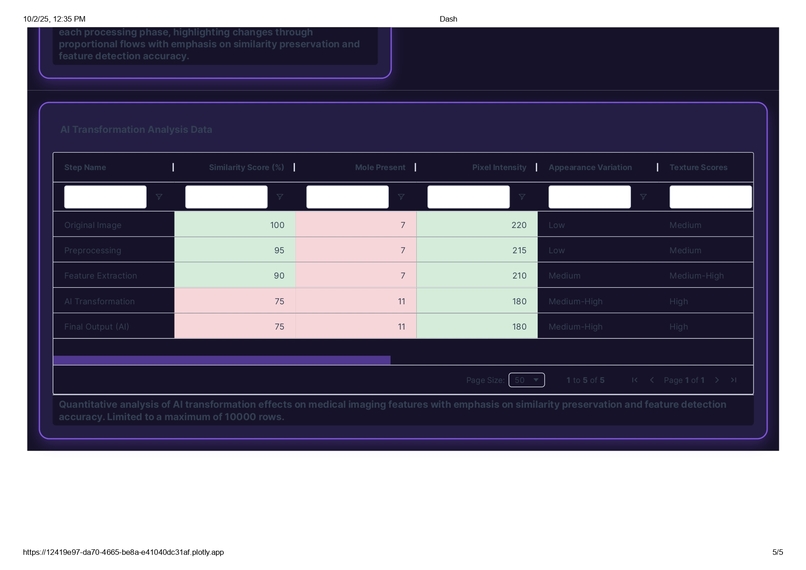
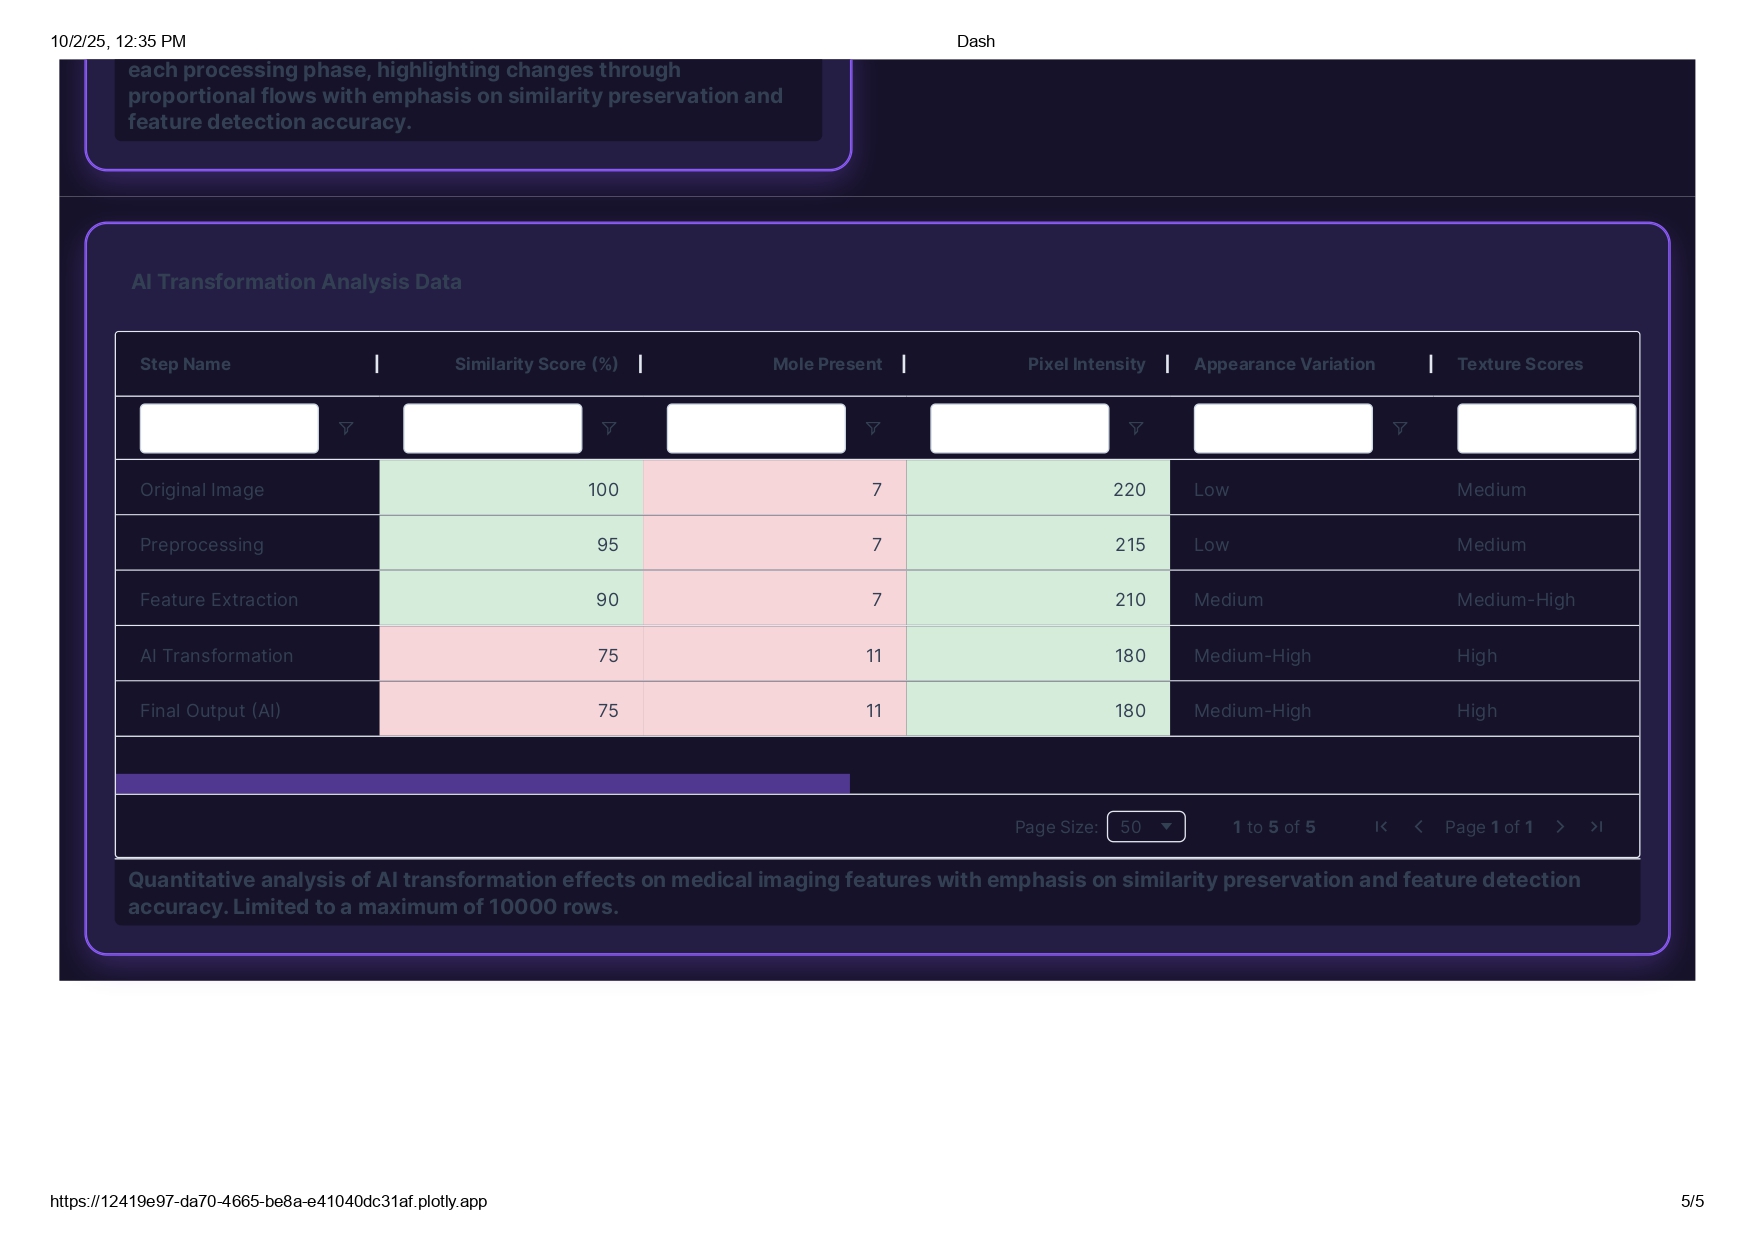
AI Transformation analysis Data store (Tabulate structure)
-
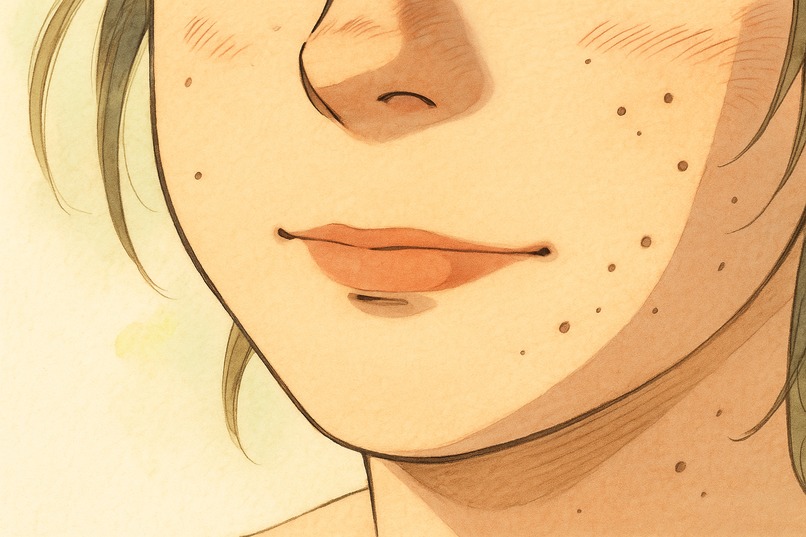
AI-Generated-Image
-
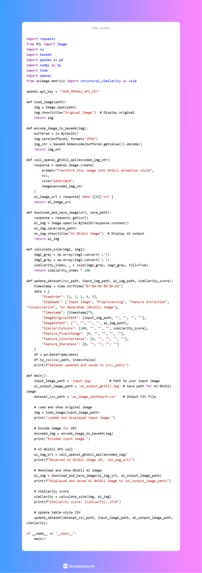
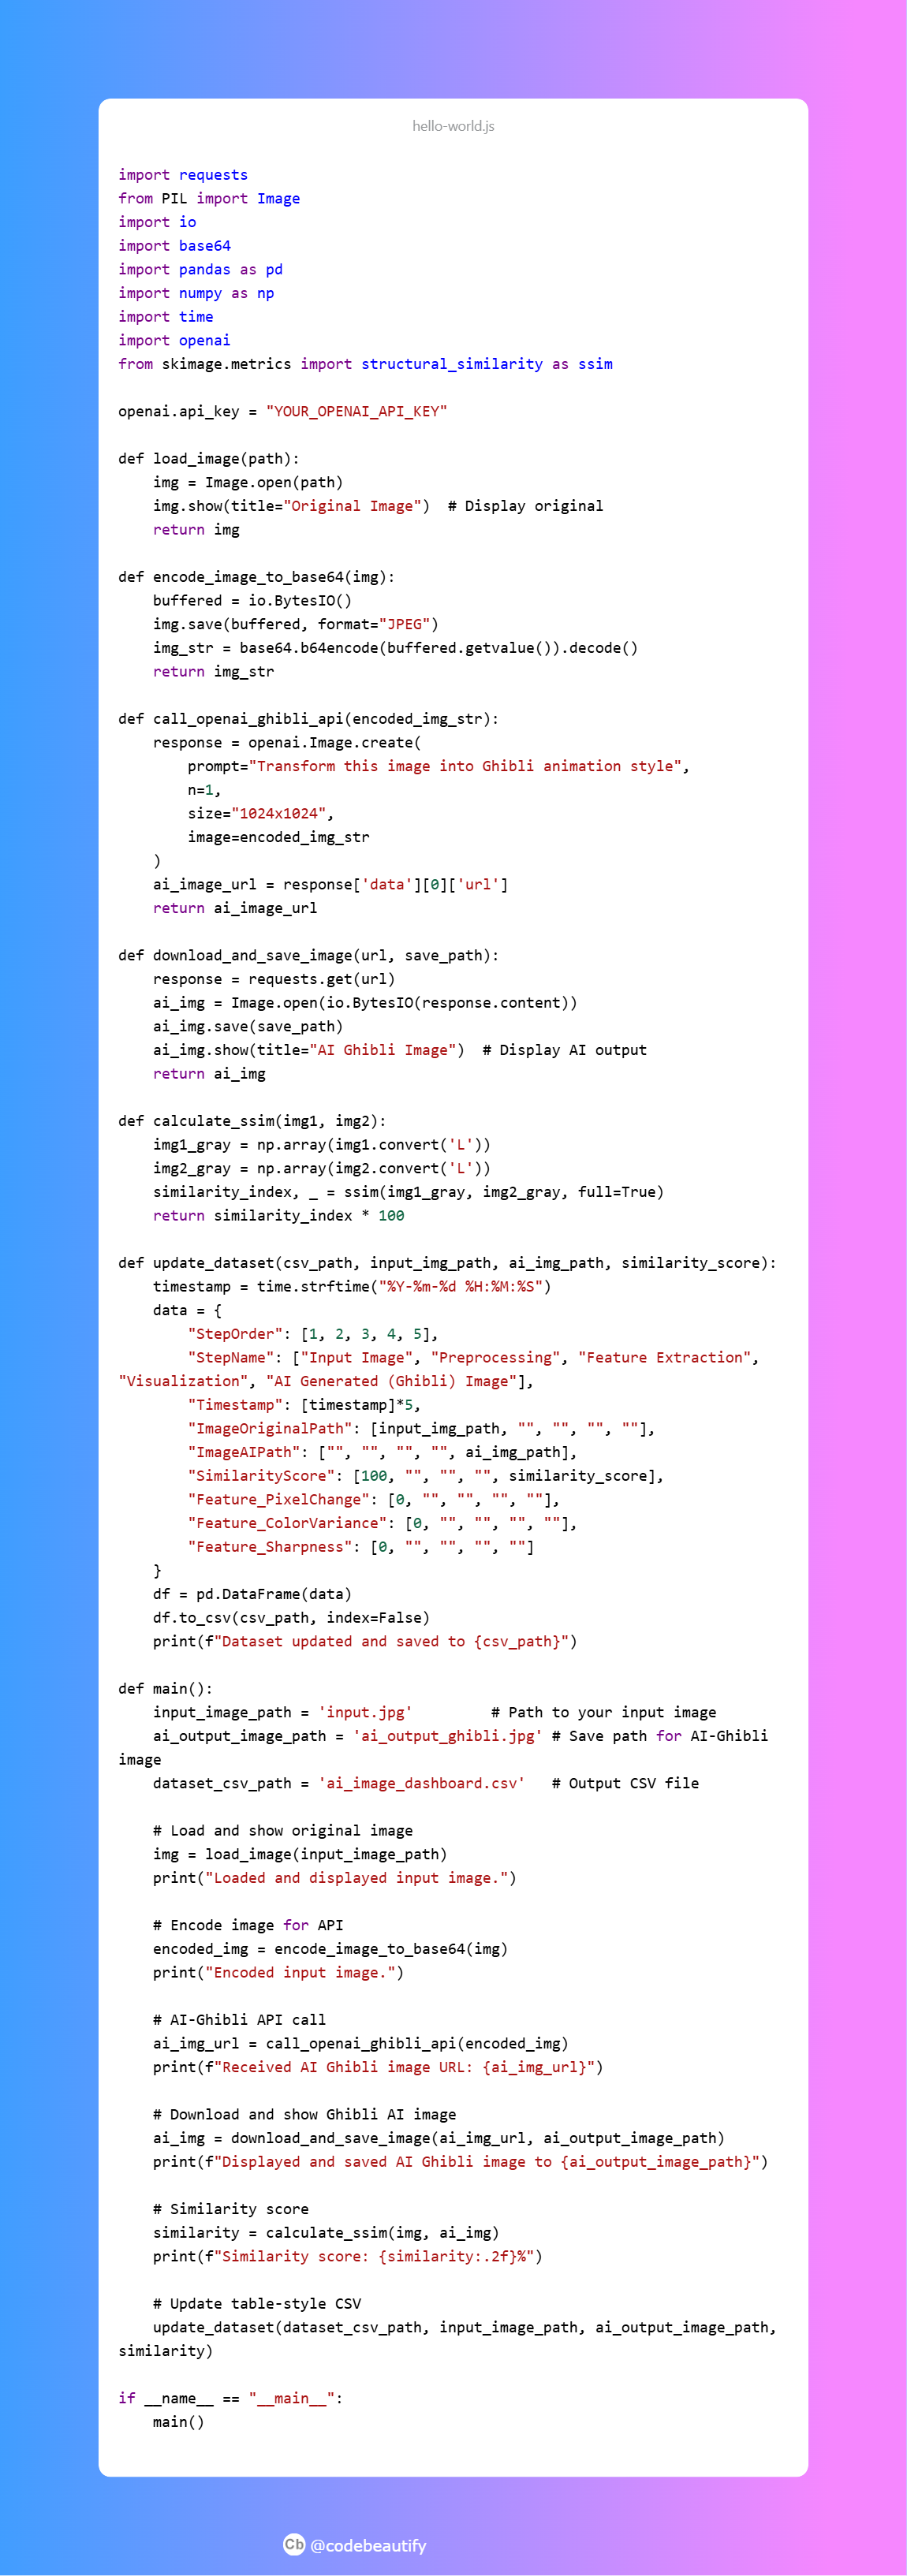
This is the code that will connect with api to generate an image to ai image

How we built it
1) Used Plotly Studio to build visually engaging interactive charts and graphs. 2) Developed a cohesive dark theme with purple/cyan accents aligned to AI/tech aesthetics. 3) Integrated multi-filter controls for dynamic data slicing by feature and processing step.
Challenges we ran into
1) Designing a clear, intuitive UI for complex multi-metric data. 2) Balancing visual appeal with data accuracy and performance in filters. 3) Ensuring effective color contrasts and theme consistency for readability.
Accomplishments that we're proud of
1) Created a comprehensive visual narrative of AI image pipeline progression. 2) Delivered a sleek, professional dashboard design that enhances user engagement. 3) Developed robust filtering tools that make exploration user-friendly and efficient.
What we learned
1) Insight into AI-driven image transformation features and progression. 2) Skills in advanced data visualization and user-focused dashboard design. 3) Understanding of color theory and theming for tech-oriented projects.
What's next for AI Image Conversion Visualization Dashboard
1) Add support for more image feature metrics and real-time updates. 2) Introduce AI anomaly detection and alert systems. 3) Expand cross-device responsiveness and user customization options.


Log in or sign up for Devpost to join the conversation.