-
-
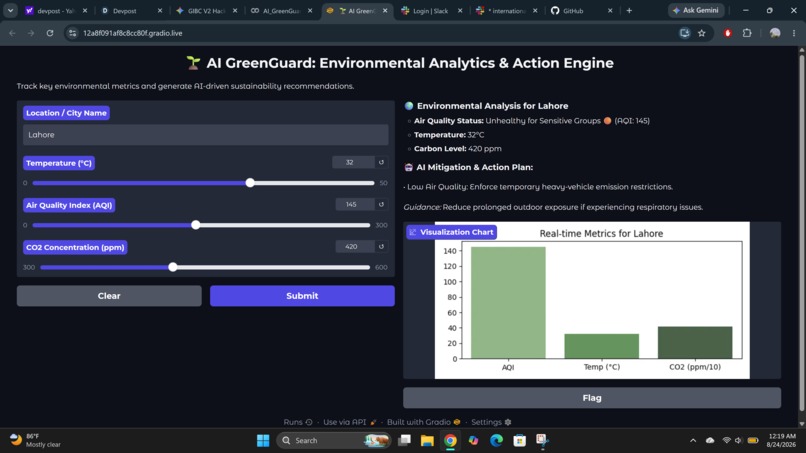
s1 test
-
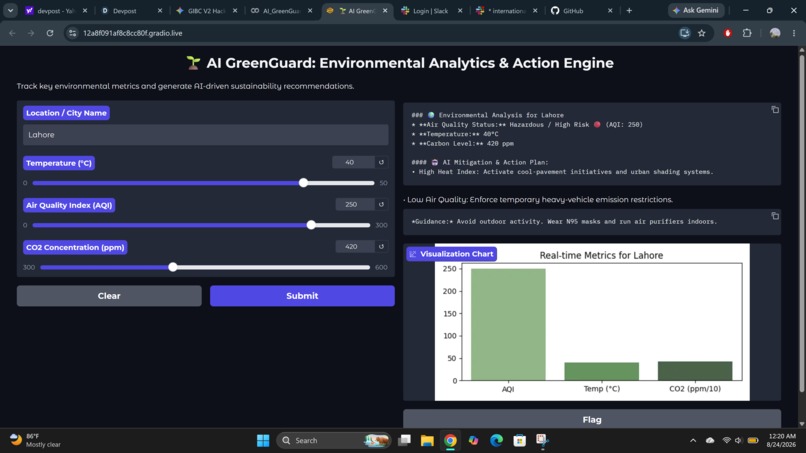
s2 test
-
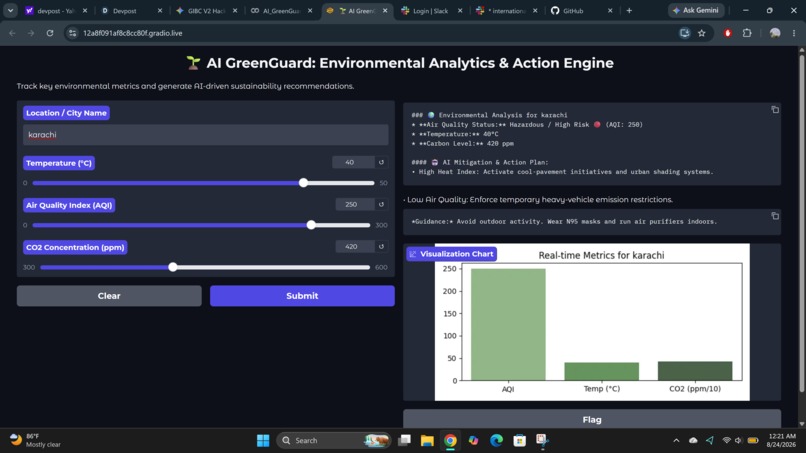
s3 test
Inspiration
Rapid urbanization, industrial expansion, and local climate shifts have led to sudden environmental fluctuations—such as dangerous spikes in Air Quality Index (AQI), heat island effects, and atmospheric carbon buildup.
For urban planning bodies and citizens alike, raw sensor readings can feel overwhelming and difficult to translate into immediate policy. We were inspired to build AI GreenGuard to bridge the gap between multi-variable environmental telemetry and dynamic, automated decision support systems.
What It Does
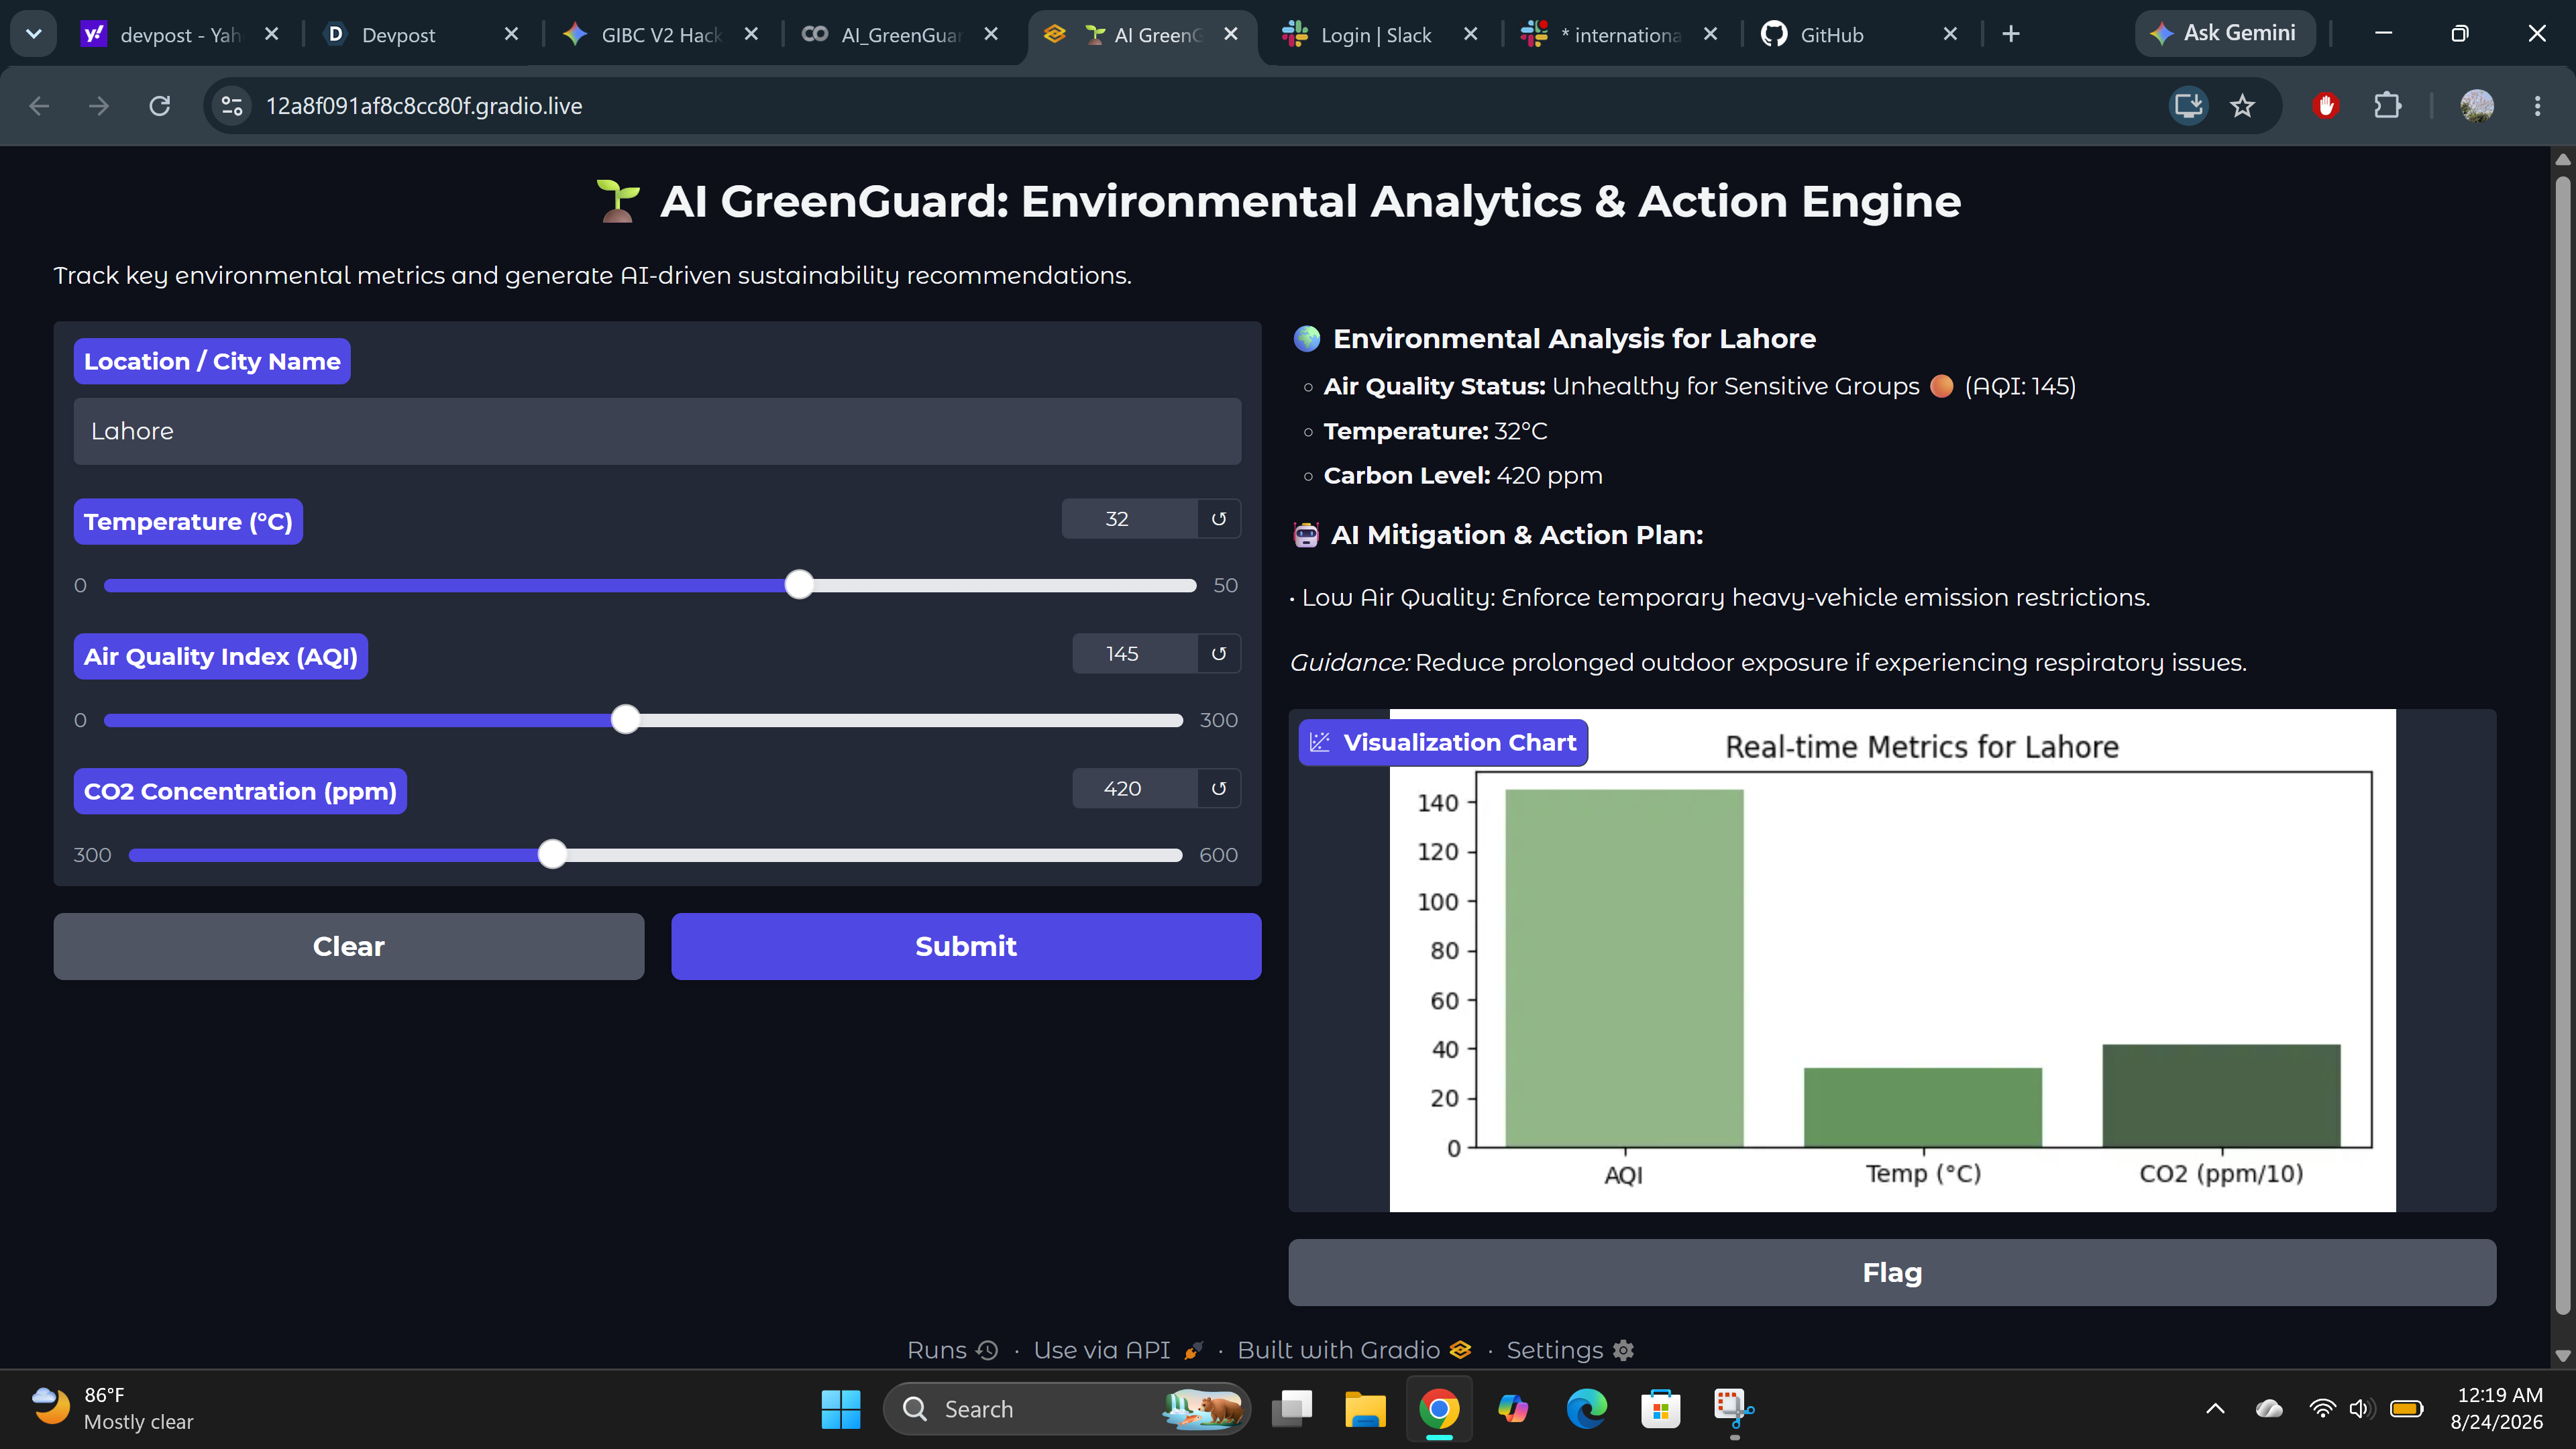
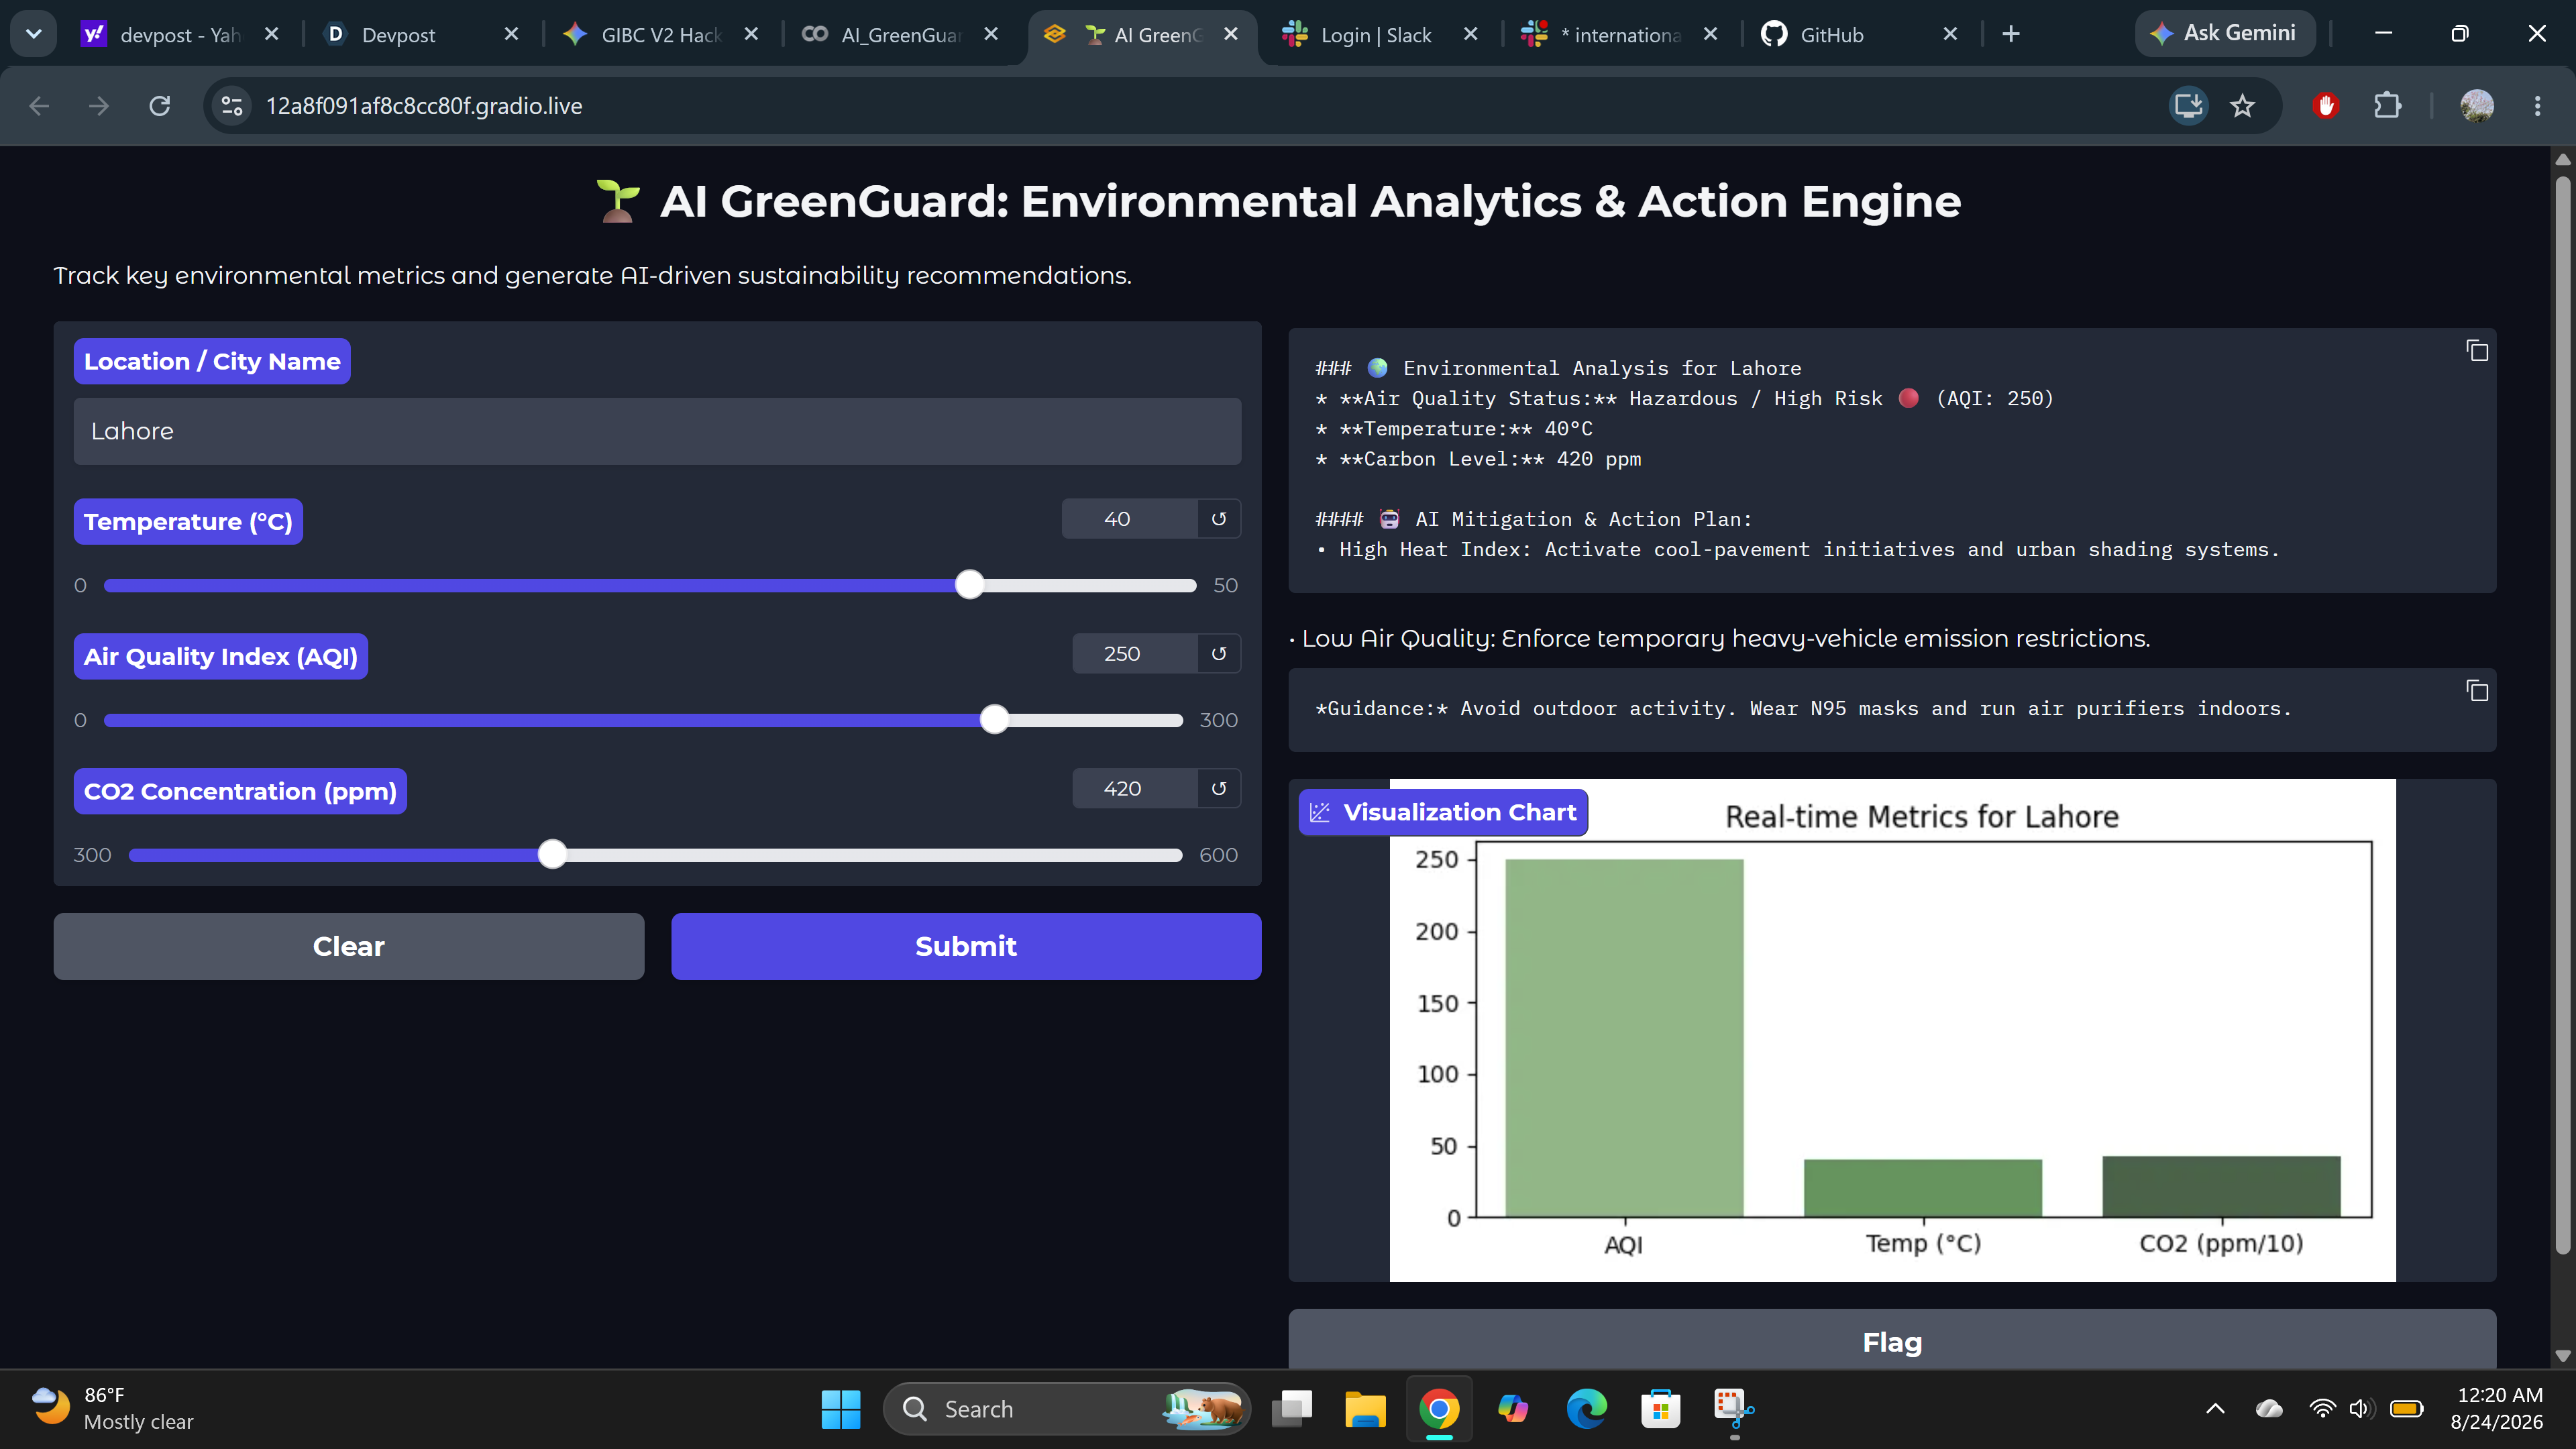
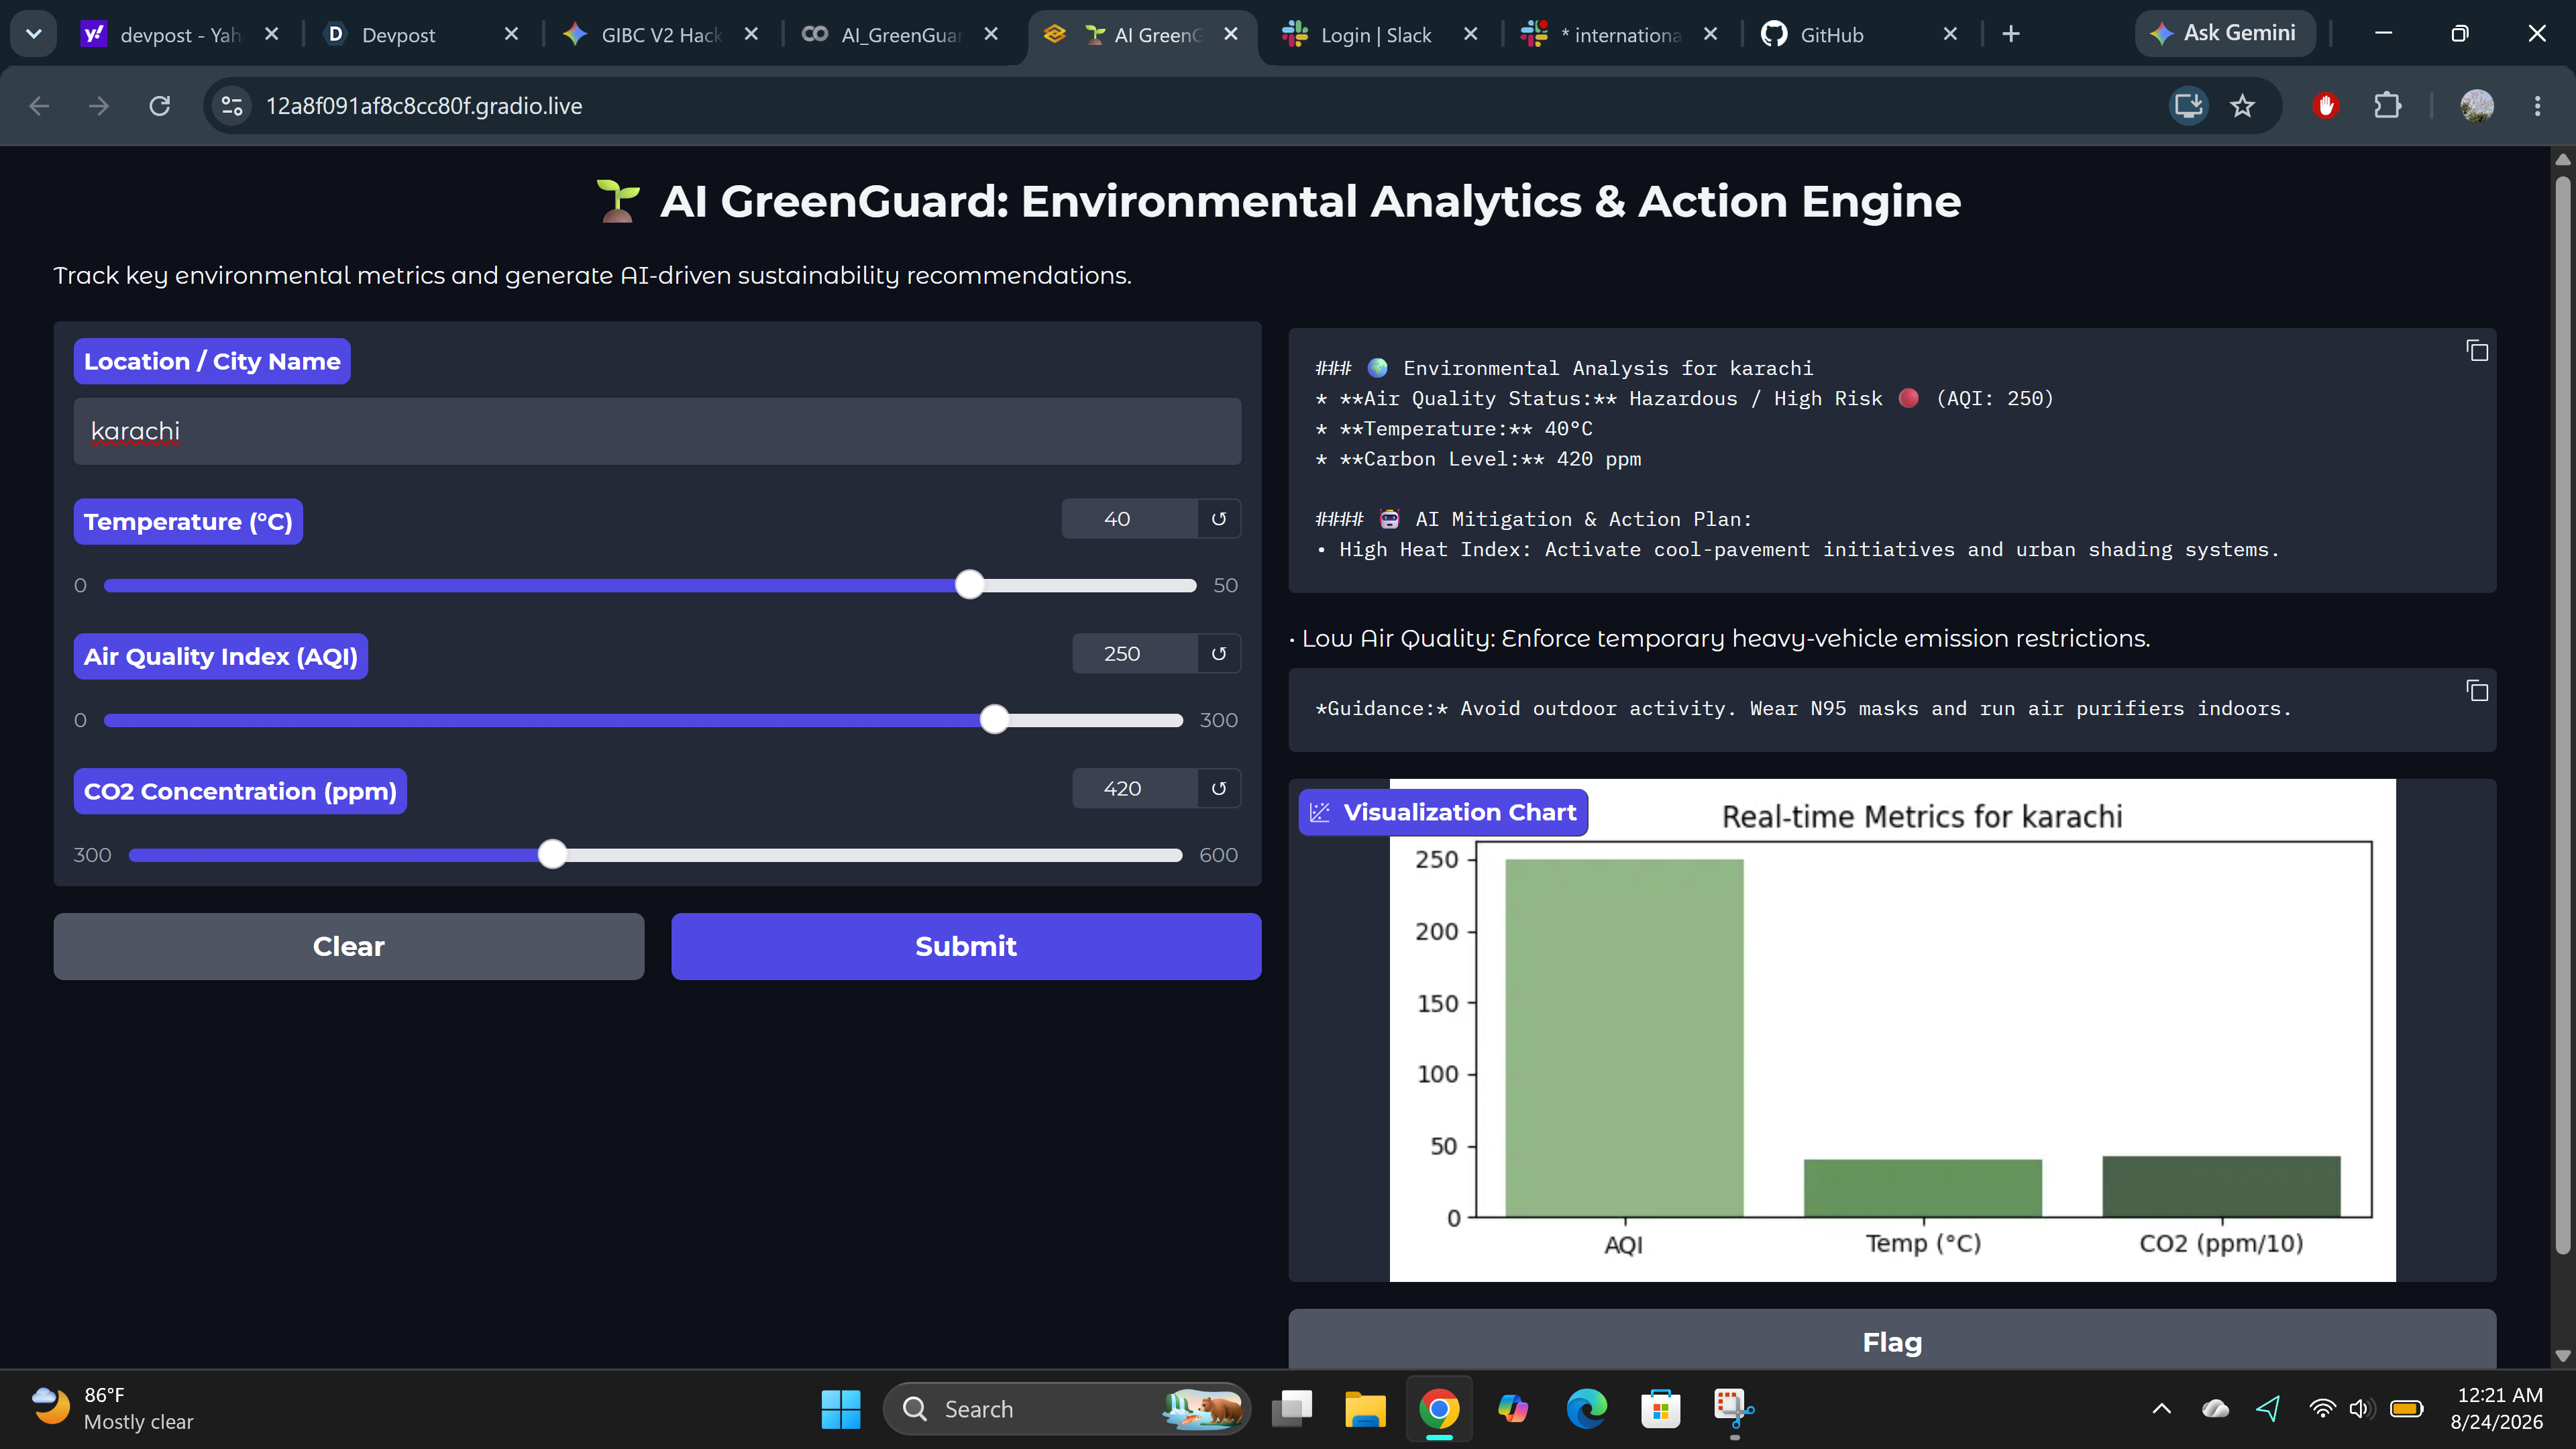
AI GreenGuard is an interactive environmental analytics dashboard designed to process real-time climate inputs and evaluate atmospheric health parameters.
Given localized variables:
- Ambient Temperature: $T \text{ (°C)}$
- Air Quality Index: $\text{AQI}$
- Carbon Dioxide Level: $C_{\text{CO}_2} \text{ (ppm)}$
The engine automatically:
- Evaluates Health Thresholds: Classifies air quality severity into dynamic categories ($0 \le \text{AQI} \le 500$).
- Generates Mitigation Policy: Triggers context-aware urban policy recommendations (e.g., canopy expansion, heavy-vehicle traffic limits) when key parameters breach safety bounds ($C_{\text{CO}_2} > 450 \text{ ppm}$ or $T > 35\text{°C}$).
- Renders Telemetry Charts: Generates instant visual comparisons normalized across non-linear indicator scales.
How We Built It
The platform was engineered using a modular Python pipeline built for speed and zero-friction access:
- Frontend Interface: Constructed using the Gradio Framework to provide a clean, responsive web interface without complex deployment overhead.
- Analytics & Threshold Engine: Written in Python using conditional evaluation algorithms to process multi-variable thresholds in real time.
- Data & Visualizations: Leveraged Pandas and NumPy for numerical processing, alongside Seaborn and Matplotlib for rendering real-time telemetry plots.
Mathematical Formulation & Threshold Logic
The risk index function $R(T, \text{AQI}, C_{\text{CO}_2})$ evaluates overall environmental stress using threshold indicators:
$$R(T, \text{AQI}, C_{\text{CO}2}) = w_1 \cdot \left(\frac{\text{AQI}}{500}\right) + w_2 \cdot \left(\frac{T}{50}\right) + w_3 \cdot \left(\frac{C{\text{CO}_2}}{1000}\right)$$
Where $w_1, w_2, w_3$ represent assigned safety weight vectors. When $R > R_{\text{threshold}}$, automated mitigation advisories are dynamically rendered.
Challenges We Ran Into
- Scale Normalization: Plotting variables with vastly different numeric scales ($\text{AQI} \in [0, 300]$, $T \in [0, 50\text{°C}]$, $C_{\text{CO}_2} \in [300, 600\text{ ppm}]$) on a single visual telemetry bar chart without obscuring critical fluctuations.
- Dynamic Chart Embedding: Seamlessly binding dynamically re-rendered Matplotlib/Seaborn plots directly into the Gradio UI without caching or state persistence issues.
Accomplishments That We're Proud Of
- Successfully engineered an end-to-end working prototype that processes multi-metric environmental data instantaneously.
- Designed a crisp UI that converts technical climate indicators into actionable human-readable advisories.
- Achieved a fully portable deployment stack requiring zero complex server setup.
What We Learned
- Building interactive, data-driven web interfaces using Gradio.
- Techniques for handling conditional multi-variable logic to trigger automated policy outputs.
- Best practices in structuring scientific software documentation and visual telemetry presentation.


Log in or sign up for Devpost to join the conversation.