-
-
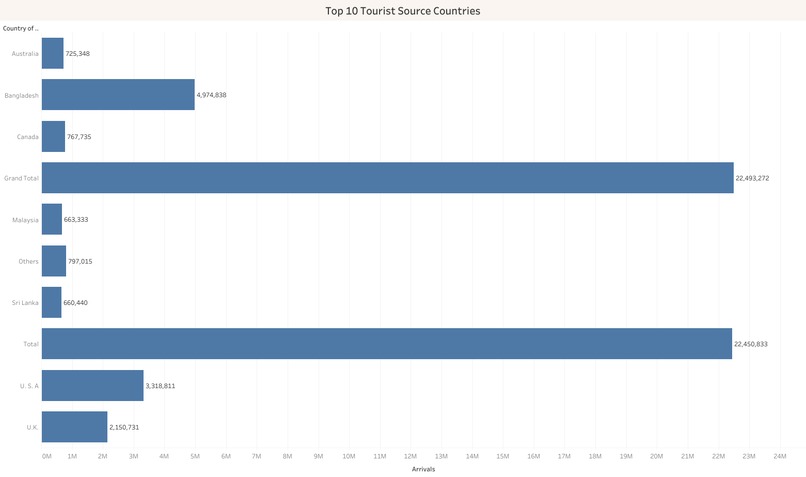
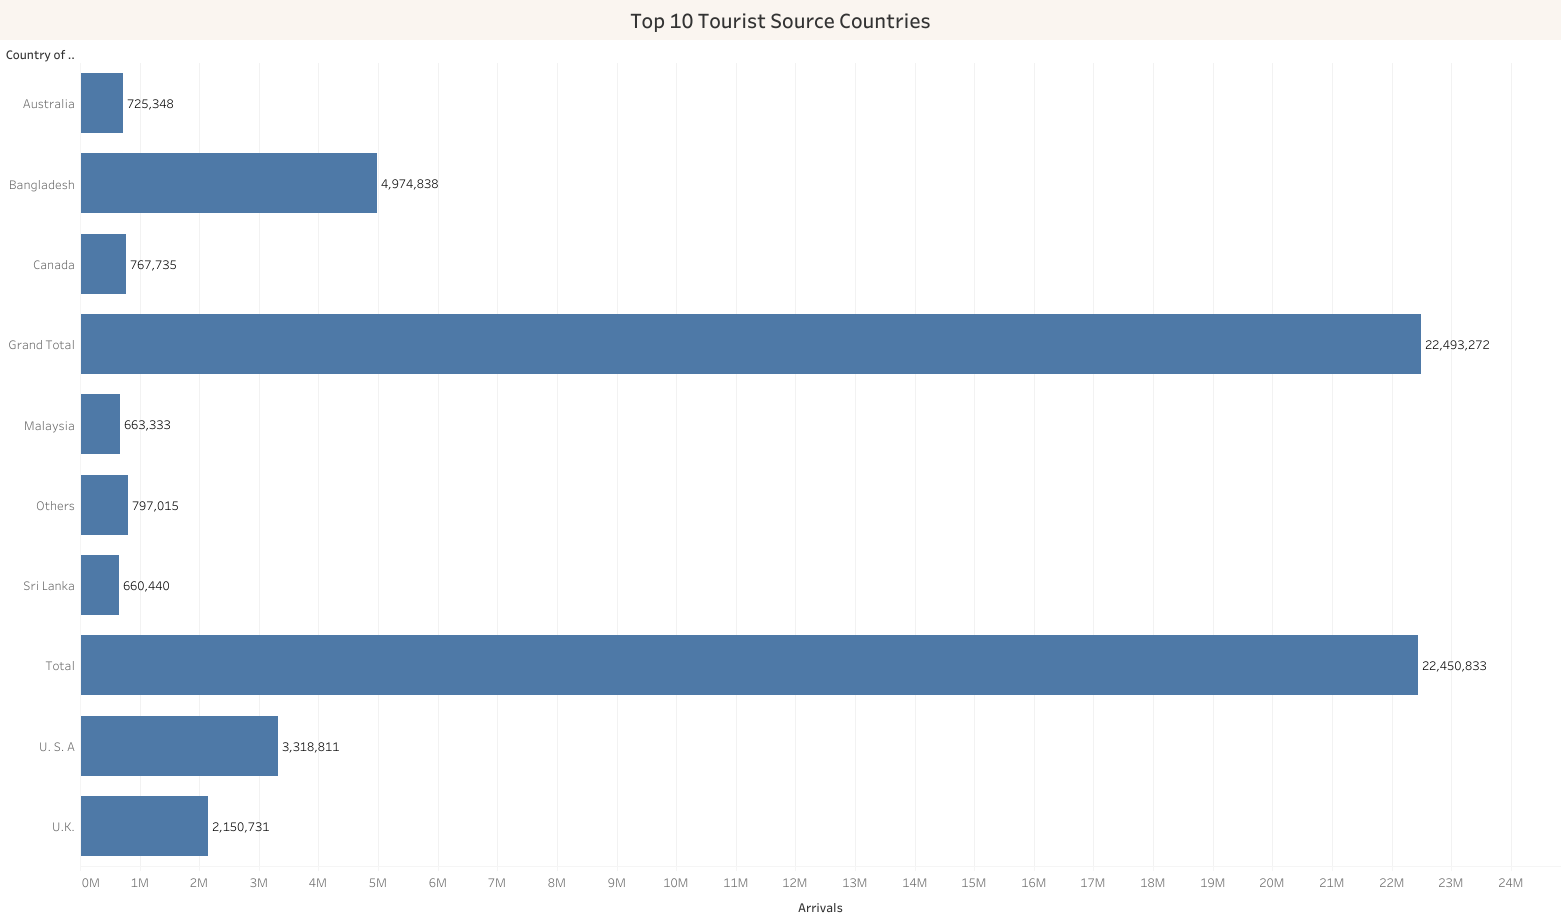
Top 10 Tourist Source Countries
-

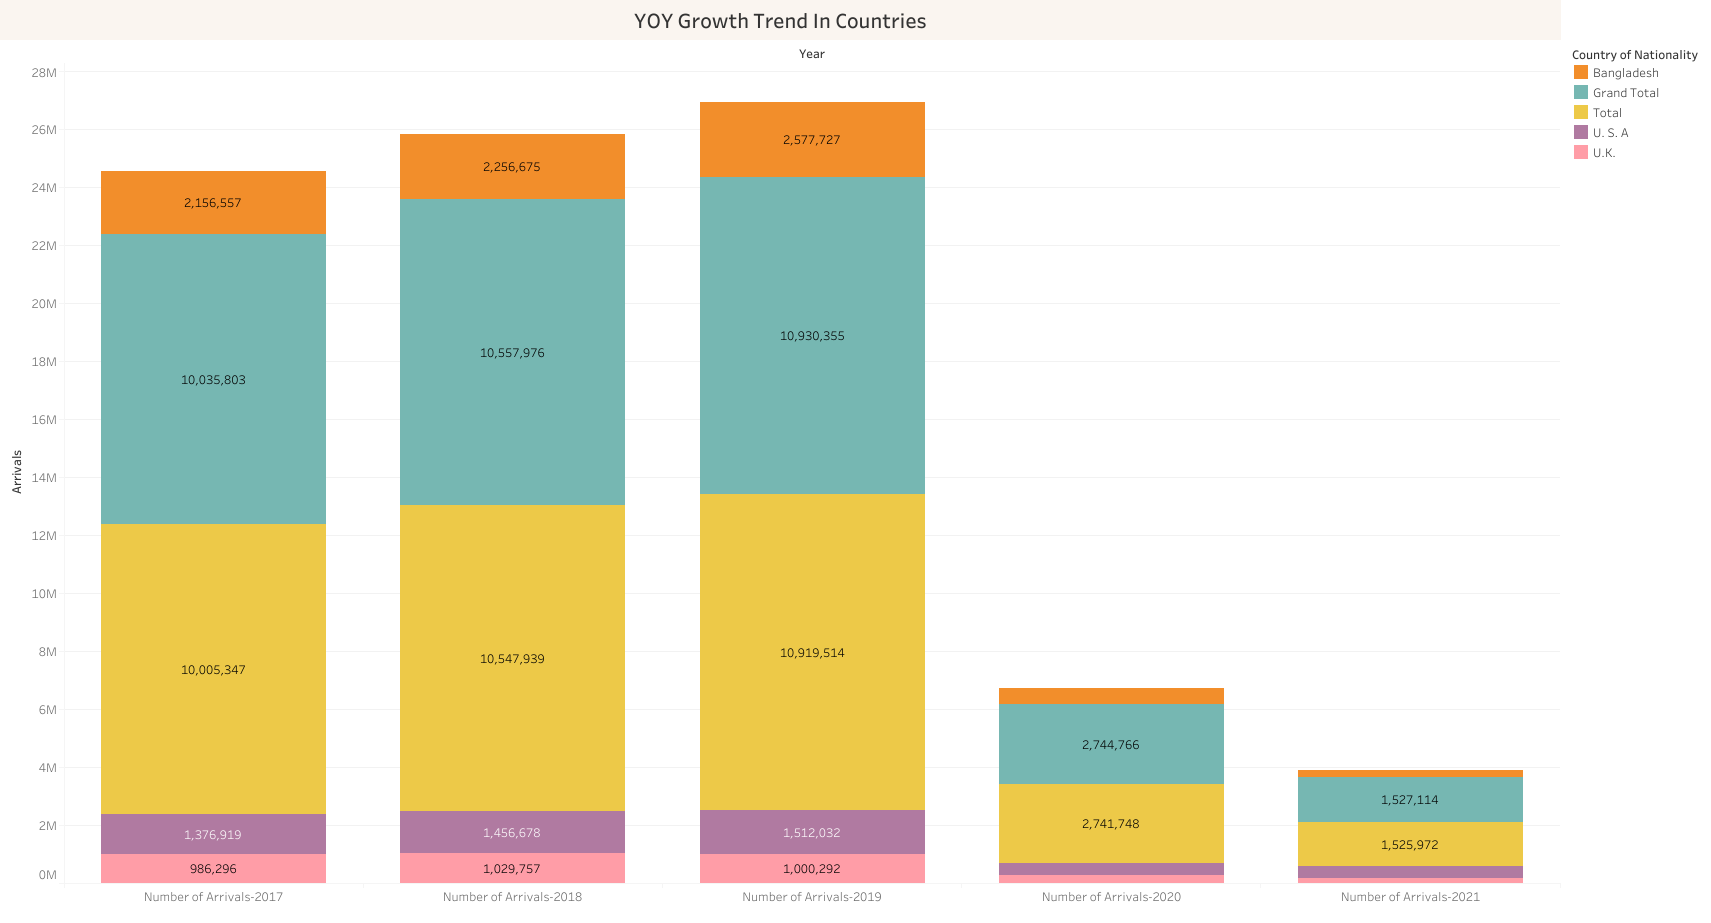
YOY Growth Trend In Countries
-
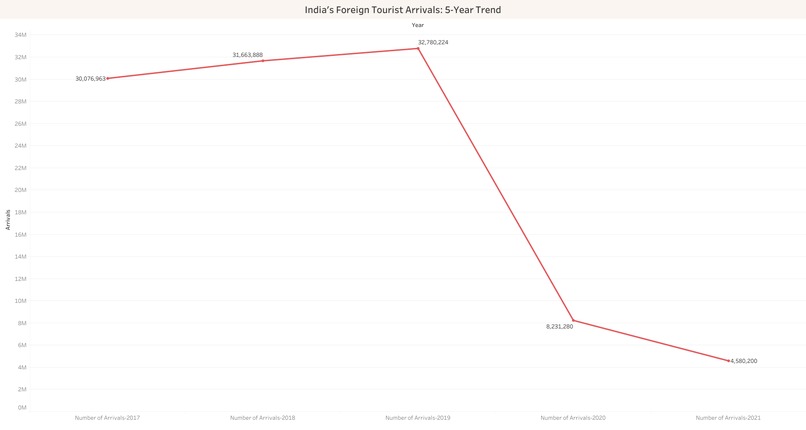
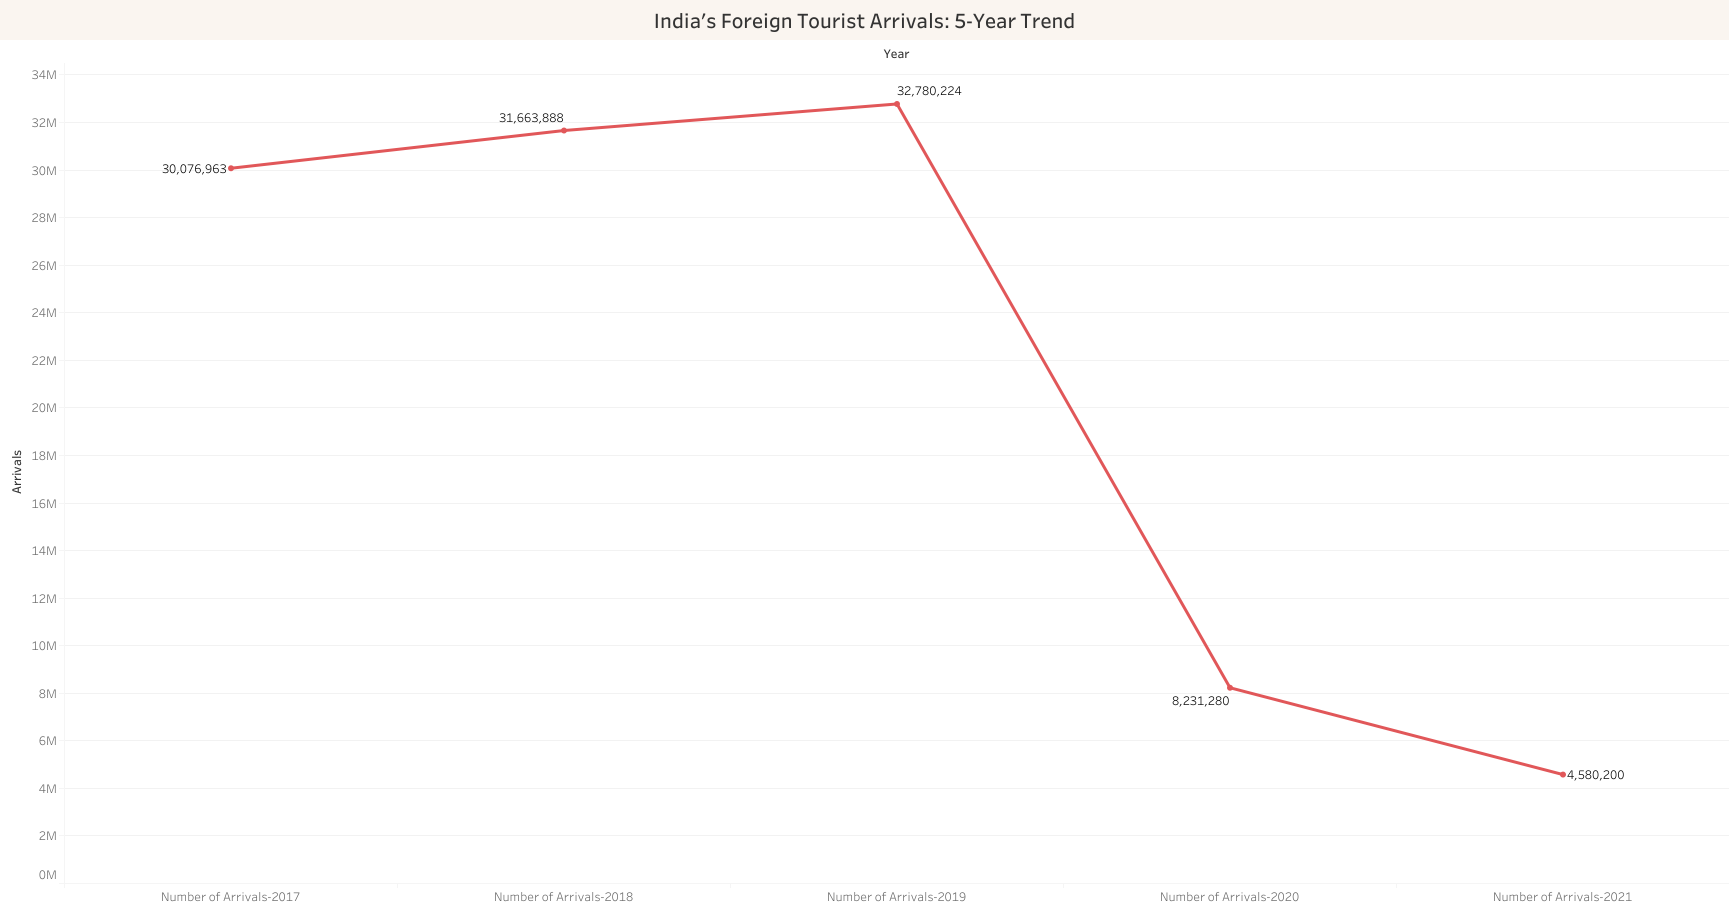
India’s Foreign Tourist Arrivals: 5-Year Trend
-
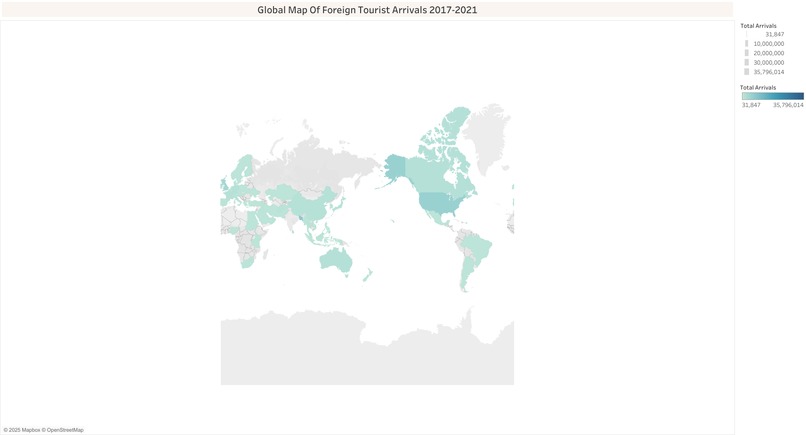
Global Map Of Foreign Tourist Arrivals 2017-2021

🚀 Inspiration
Understanding socio-economic conditions across regions often requires navigating scattered datasets, inconsistent formats, and time-consuming analysis. We wanted to simplify this process and build a platform where anyone—policymakers, NGOs, educators, or students—could explore complex demographic and economic trends effortlessly. Tableau’s visual power and analytical flexibility inspired us to create a dashboard that truly tells a story while uncovering patterns, inequalities, and opportunities across communities.
📊 What It Does
The AI-Driven Socio-Economic Insights Dashboard consolidates multi-source public data into a single interactive Tableau environment. Users can:
- Explore regional socio-economic indicators through dynamic maps and charts
- Compare trends across population, income, education, and employment
- Identify high-risk or high-opportunity zones through automatic insights
- Generate data-backed interpretations using integrated AI summaries
- View forecasts for selected indicators to guide future planning
It transforms raw data into a meaningful narrative that supports informed decision-making.
🛠️ How We Built It
We followed a structured, analytics-focused approach:
- Data Collection: Aggregated datasets from government portals, open-data repositories, and demographic sources.
- Data Cleaning & Preparation: Used Python and Tableau Prep for handling missing values, merging datasets, and creating standardized fields.
- Feature Engineering: Developed calculated fields for growth rates, ratios, category indices, and risk scoring.
- Visualization in Tableau:
- Built geospatial maps for state/district-level insights
- Developed trend charts, correlation views, and KPI summaries
- Added filters allowing deep drill-down
- Built geospatial maps for state/district-level insights
- AI Integration: Implemented AI-generated interpretive text using external processing, translating insights into simple explanations.
- Dashboard Publishing: Published the final dashboard to Tableau Public for broad accessibility.
⚠️ Challenges We Ran Into
- Unstructured datasets: Many sources had inconsistent formats or missing fields, requiring extensive preprocessing.
- Geospatial alignment: Ensuring region names, boundaries, and codes matched across datasets took careful mapping.
- Performance optimization: Large datasets slowed down initial dashboard performance, so we optimized extracts and reduced heavy queries.
- Balancing complexity with clarity: Creating a dashboard that is powerful yet intuitive required multiple design iterations.
🏆 Accomplishments We're Proud Of
- Built a clean, responsive, and user-friendly Tableau dashboard capable of analyzing large datasets.
- Integrated AI-generated narrative insights, making the dashboard accessible to non-technical users.
- Successfully combined geospatial visualization with socio-economic indicators to highlight regional disparities.
- Achieved meaningful forecasting results, allowing predictive interpretation of future trends.
- Created a project with real-world applicability for social development, research, and policy planning.
📚 What We Learned
- How to structure multi-source public datasets for analytical modeling
- Advanced Tableau features like LOD expressions, geospatial layers, and dynamic parameters
- Effective visualization design principles for storytelling and clarity
- Techniques for integrating AI outputs with traditional BI dashboards
- How socio-economic indicators correlate and influence each other in real-world scenarios
🔮 What’s Next for the AI-Driven Socio-Economic Insights Dashboard
We plan to expand the platform with:
- Real-time API-based data updates for live socio-economic monitoring
- More AI features including anomaly detection and natural-language query support
- A community-driven dataset upload feature allowing organizations to plug in their own data
- Mobile-optimized dashboards for on-the-go insights
- Integration with Excel, Google Sheets, and GIS tools to enhance flexibility
- Predictive policy simulation models to compare outcomes of proposed programs
Our goal is to evolve this into a fully intelligent socio-economic decision support system.


Log in or sign up for Devpost to join the conversation.