-
-
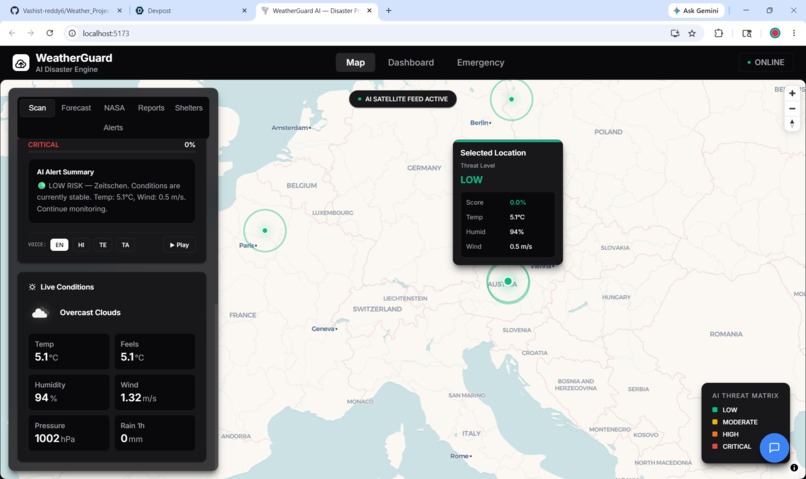
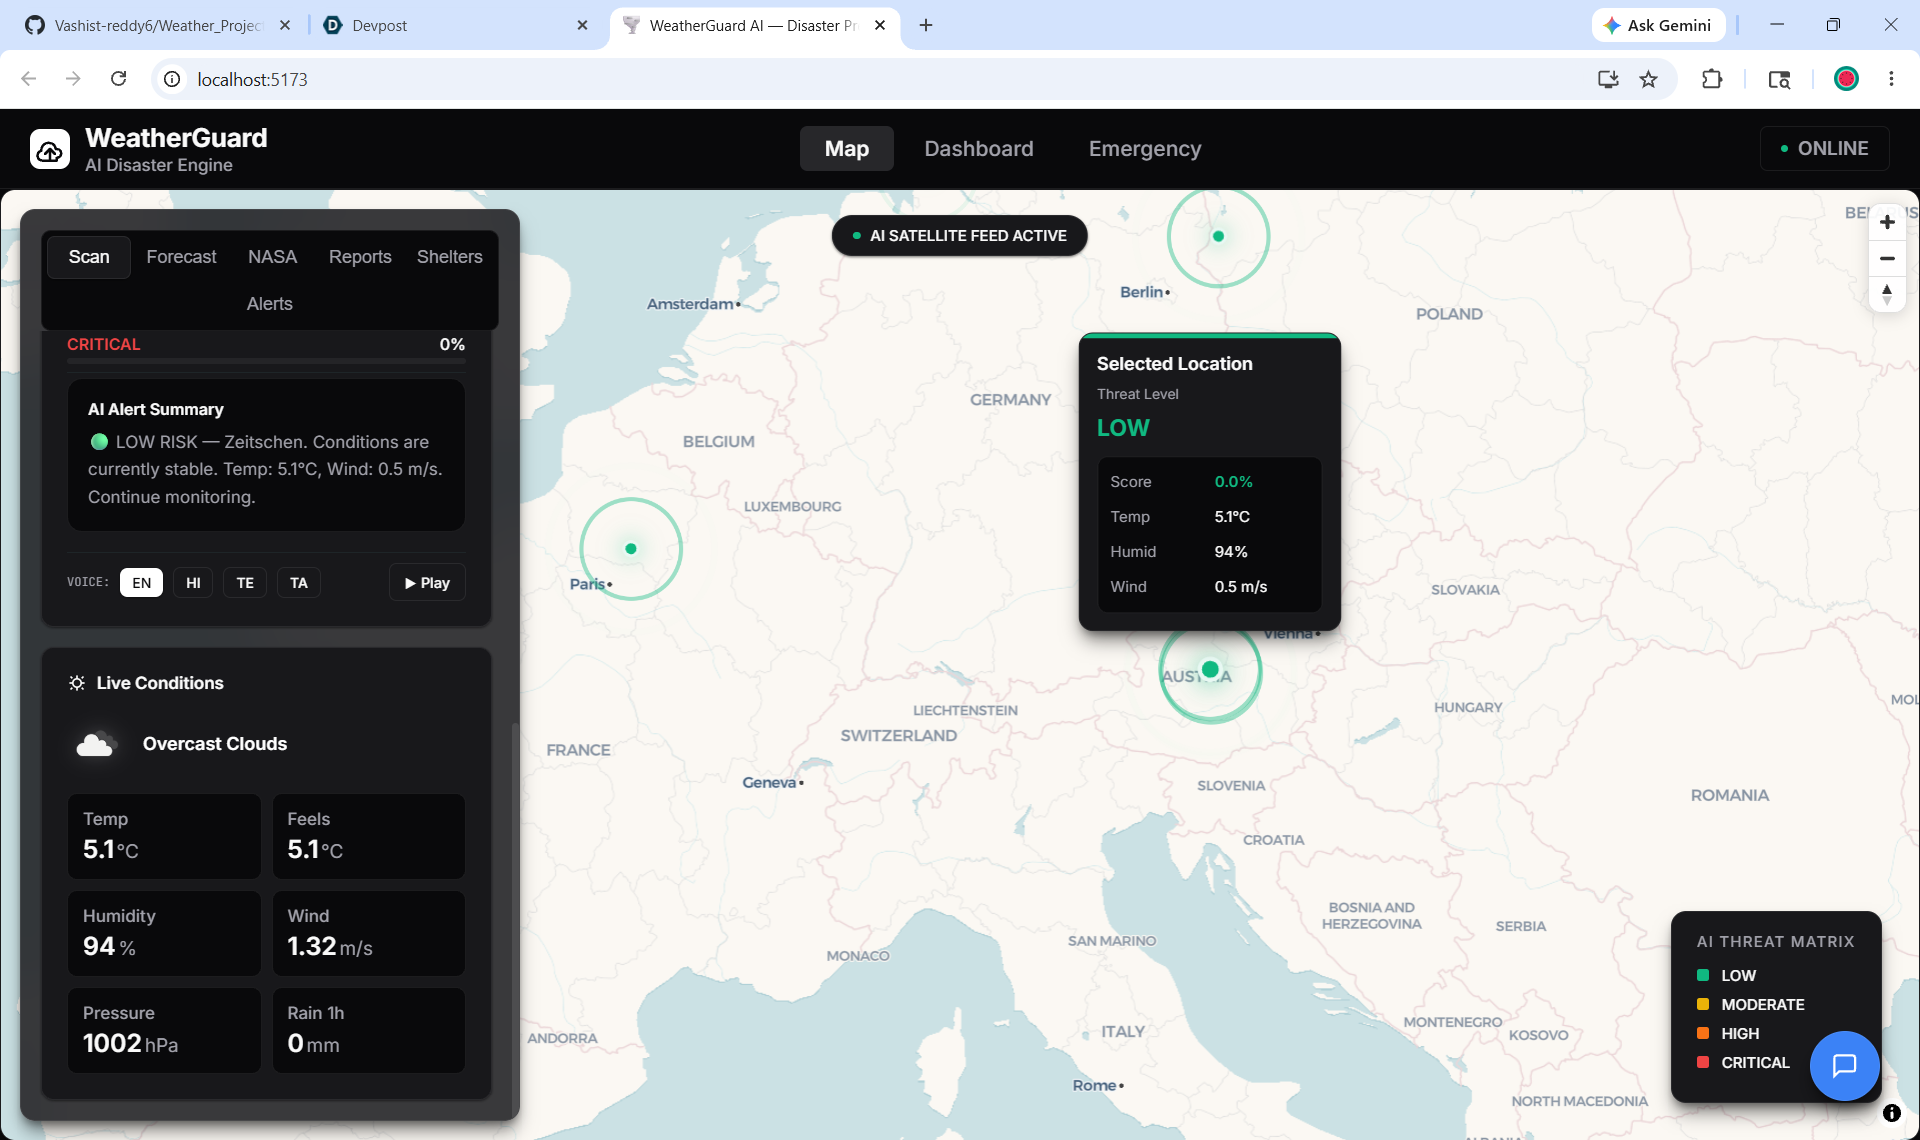
weather and risk analysis
-
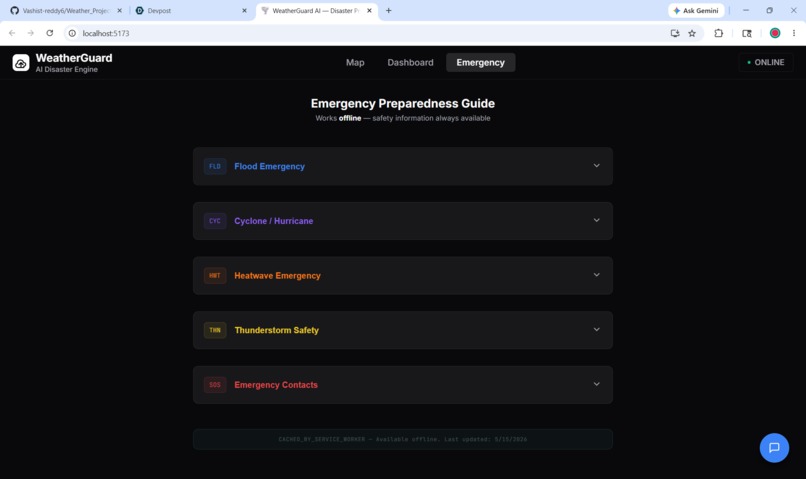
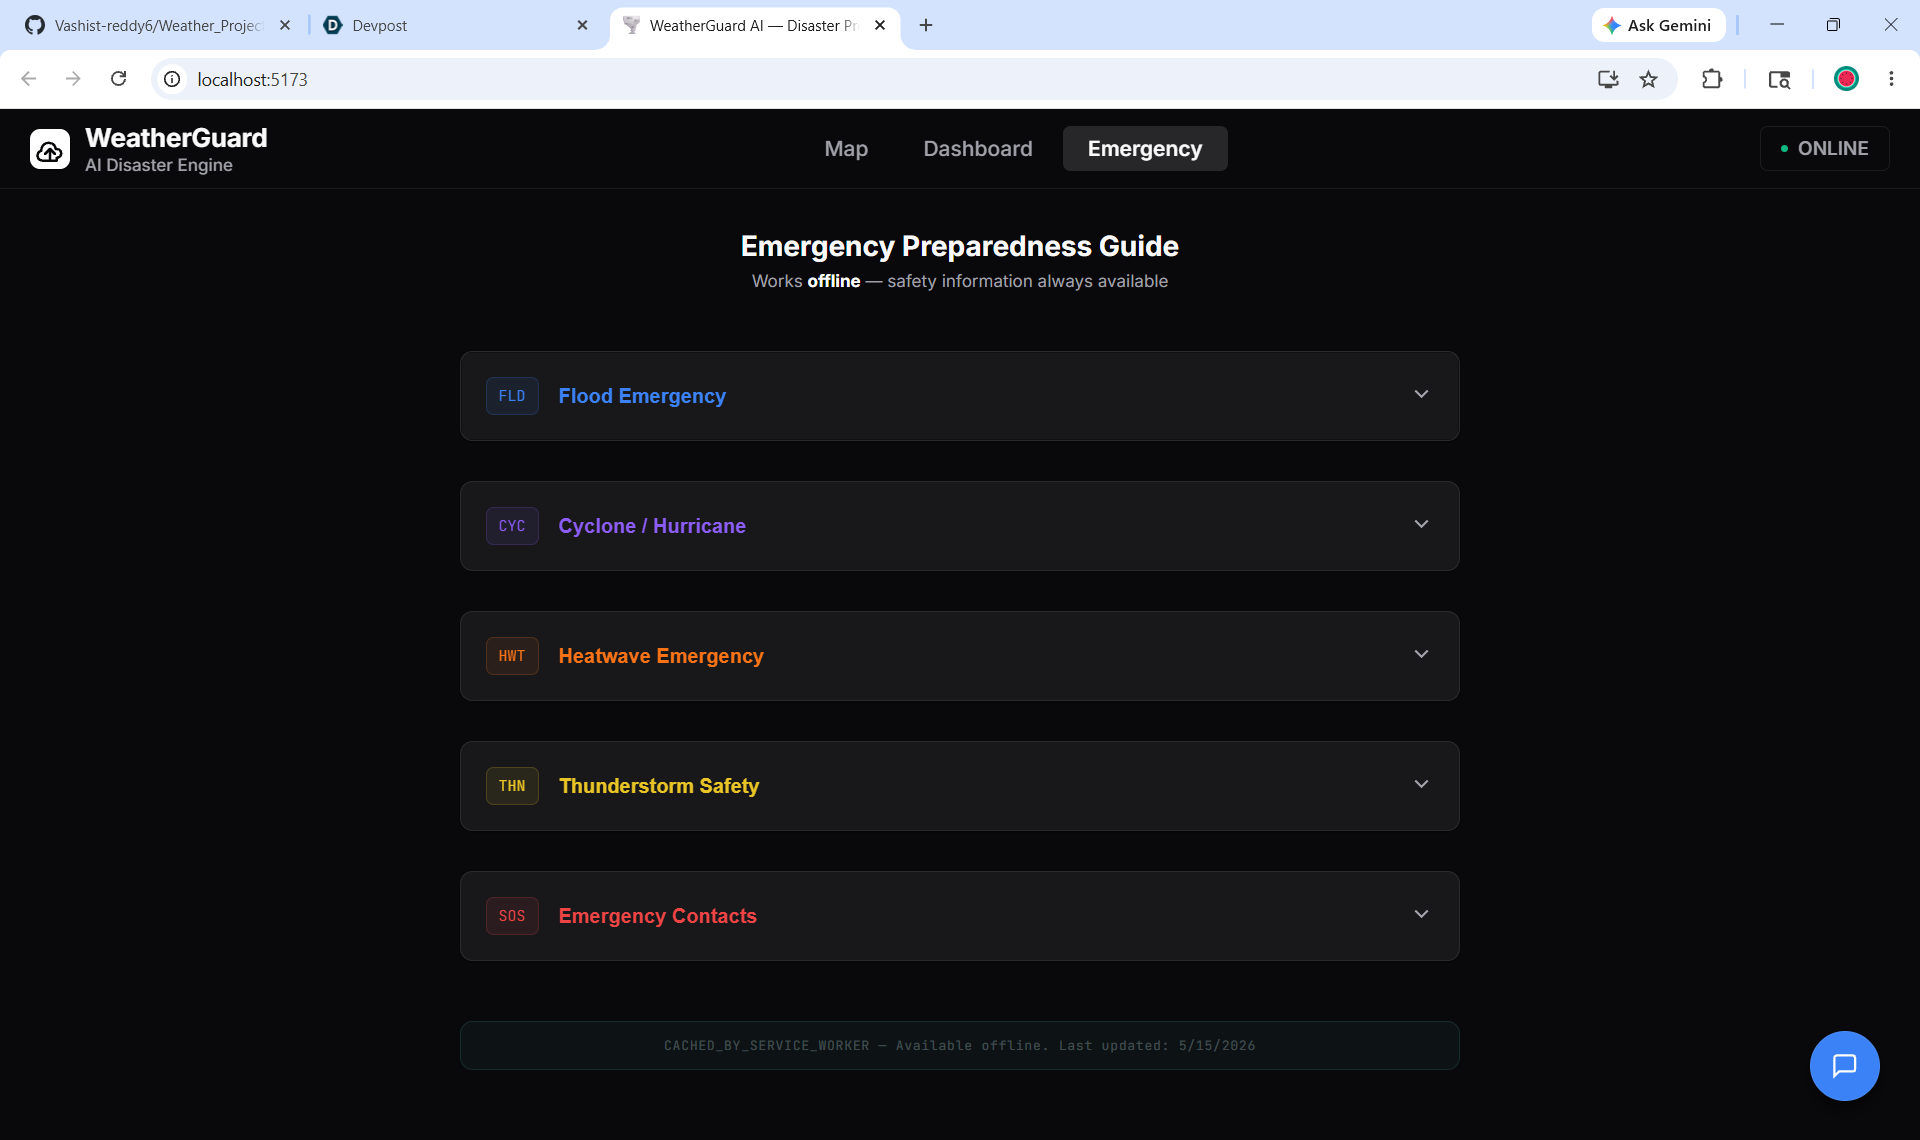
Emergency response action for each disaster
-
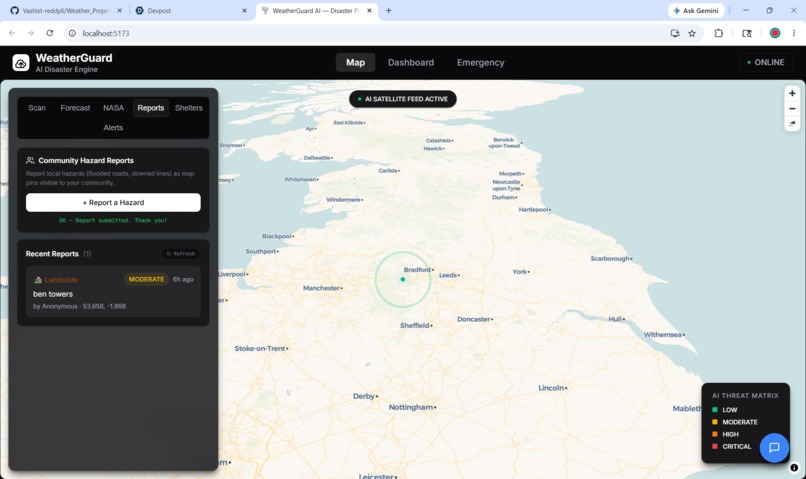
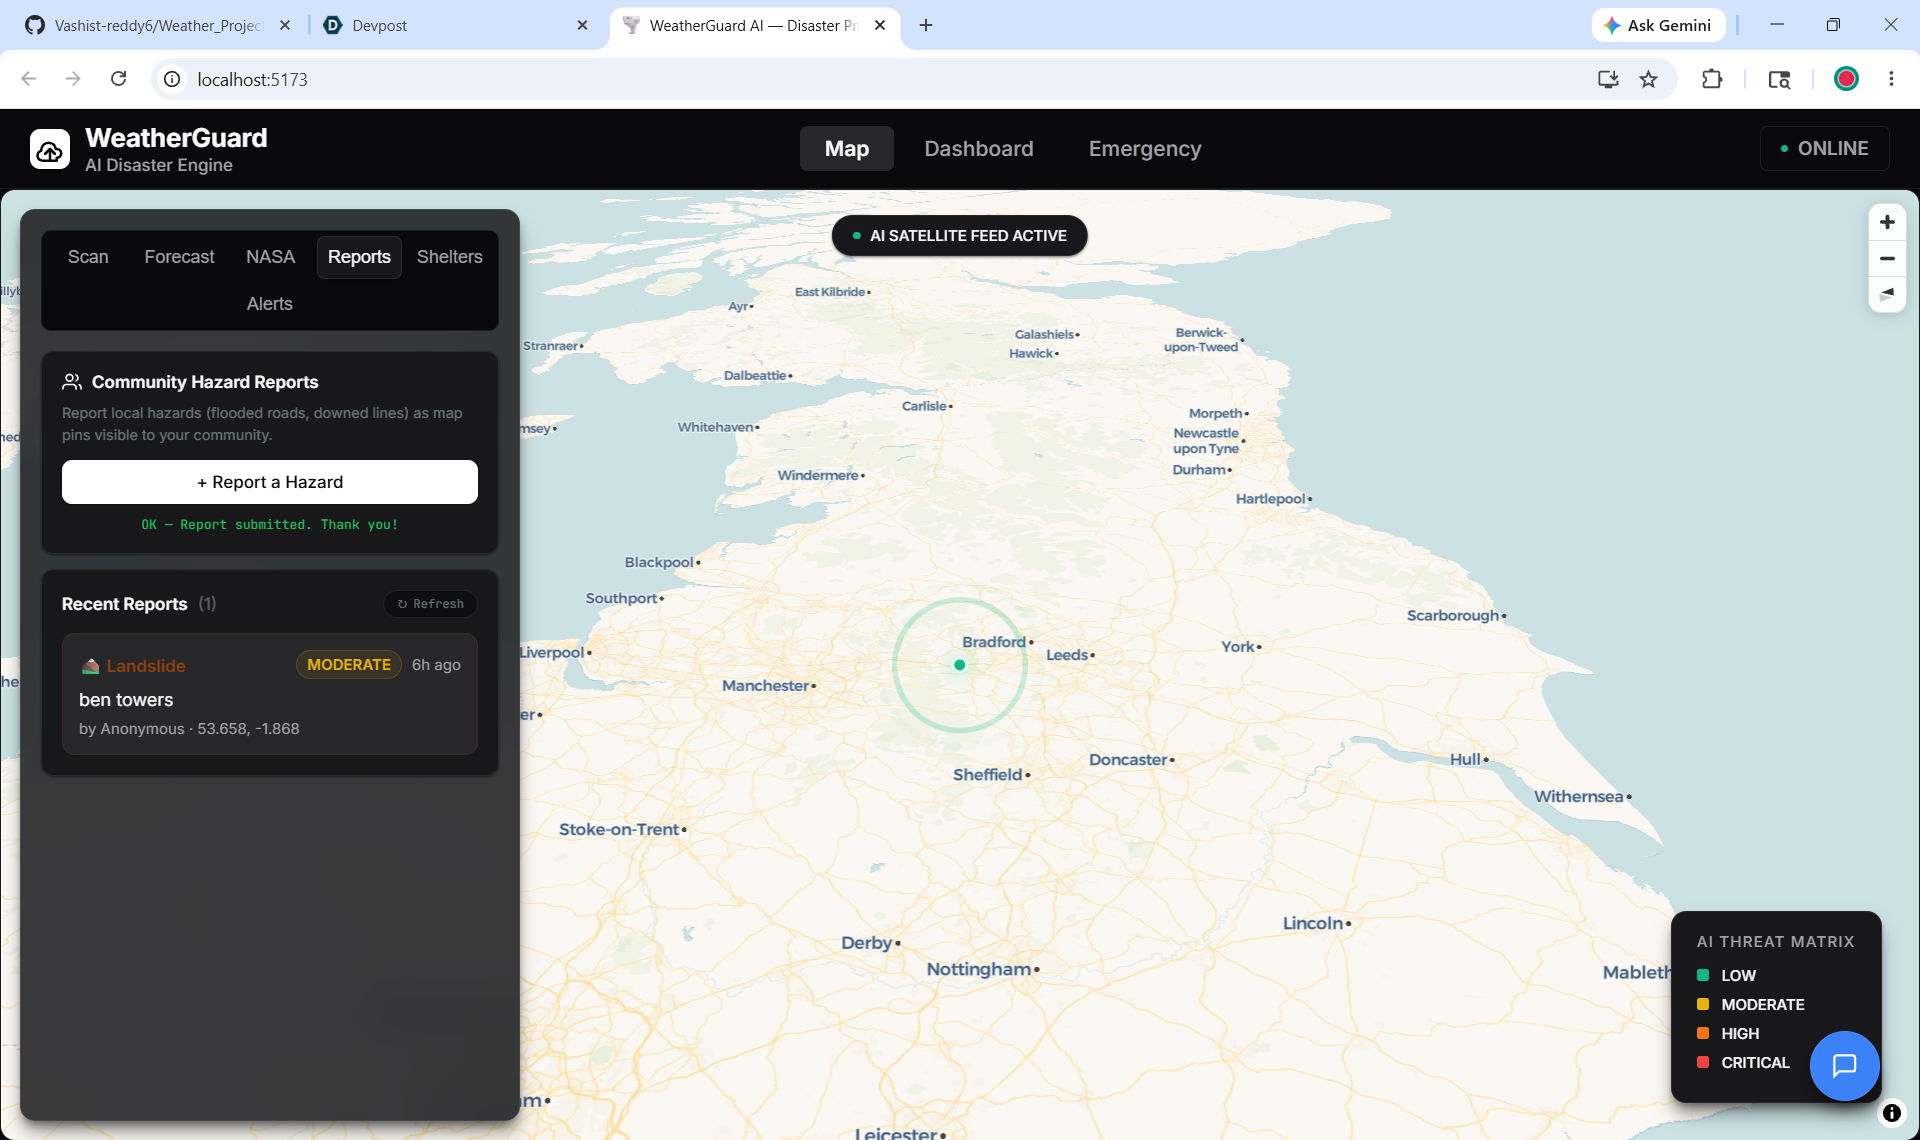
Report hazard
-
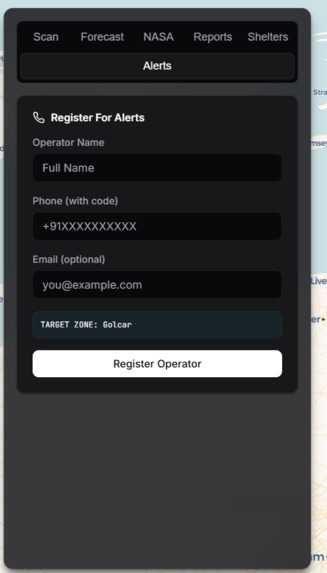
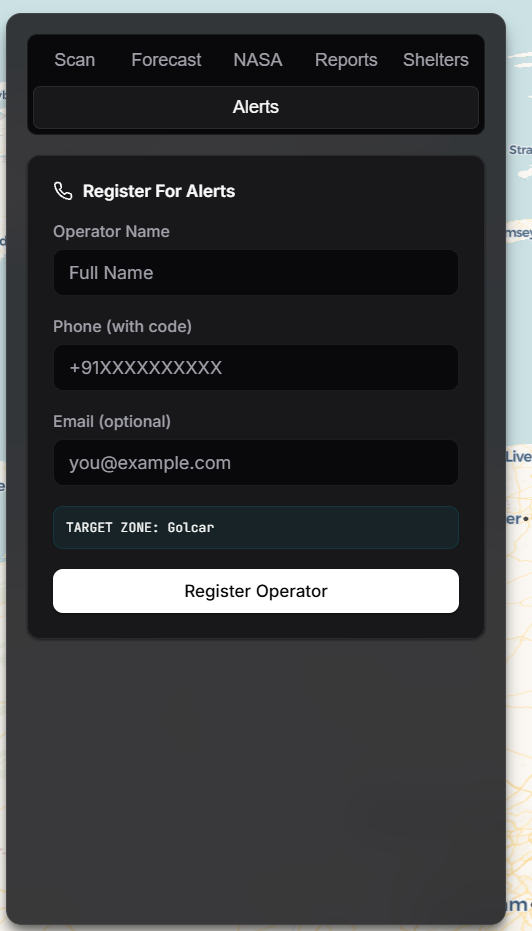
Alert registration
-
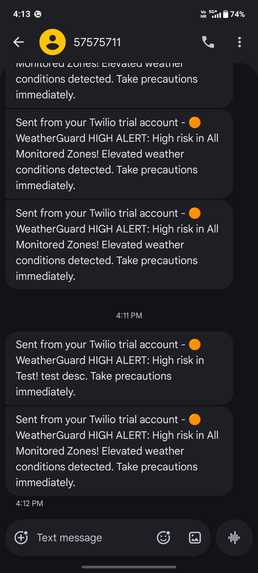
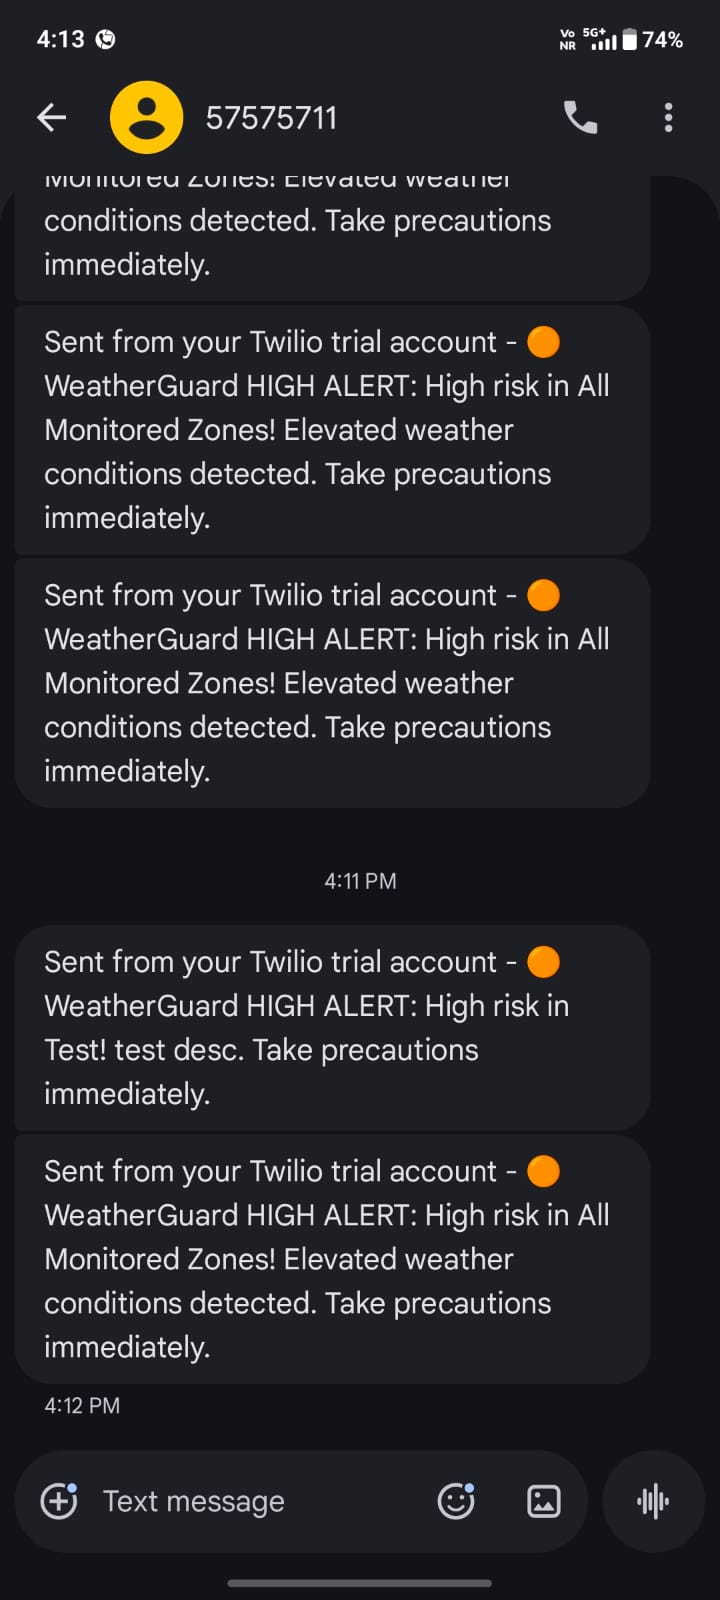
Alerts via twilio
🌪️ Inspiration
Every year, unpredictable extreme weather events cause devastating loss of life and property. While tracking these events after they happen is easy, predicting them locally before they strike is incredibly difficult.
"In rural and vulnerable communities, the biggest issue isn't just predicting the weather; it's ==communicating the risk== to people who might not have 4G internet or smartphones."
We wanted to build something that doesn't just show data on a map, but actively bridges the gap between complex meteorological data and life-saving, accessible alerts. That’s how WeatherGuard AI was born.
🛠️ What it does
WeatherGuard AI is an enterprise-grade disaster prediction and alert system. It pulls real-time environmental data and cross-references it against 30-day NASA historical climate baselines. Instead of just giving you the weather, it runs the data through a machine learning model to generate a Disaster Risk Score.
If a critical risk is detected, the system autonomously triggers a cascade of safety protocols:
- Live Dashboard: Updates the 3D terrain map for emergency operators via WebSockets.
- SMS Broadcasting: Automatically texts registered users in the danger zone via Twilio—meaning people get warned even if they only have a basic feature phone.
- Voice Alerts: Generates downloadable audio briefings in English, Hindi, Telugu, and Tamil.
- Crowdsourced Safety: Citizens can drop pins on a map for flooded roads or downed power lines.
⚙️ How we built it
| Layer | Technologies Used | Purpose |
|---|---|---|
| Frontend | React, Vite, MapLibre GL | 3D mapping and live operator dashboard |
| Backend | FastAPI, SQLite (WAL Mode) | High-concurrency REST APIs & WebSockets |
| Machine Learning | Python, XGBoost, Pandas | Risk classification based on synthetic + real data |
| Integrations | Twilio, OpenWeather, NASA | SMS webhooks and meteorological datasets |
The Math Behind the Risk
To determine if current weather conditions are dangerous, we calculate the statistical anomaly against the 30-day historical baseline from NASA. We compute the Z-score using inline math mode like this: \( Z = \frac{x - \mu}{\sigma} \), where \(\mu\) is the historical mean and \(\sigma\) is the standard deviation.
If the deviation is significant, we pass the features into our XGBoost Classifier. The final risk probability is computed as an ensemble of decision trees:
$$ \hat{y} = \sum_{k=1}^{K} f_k(X_i) $$
🧗 Challenges we ran into
Building a system this complex wasn't without its hurdles:
- Model Sensitivity: Initially, our ML model suffered from high bias because natural disasters are statistically rare events. We had to rewrite our training pipeline to inject synthetic extreme-weather data to balance the classes.
- Concurrency & Security: When we added the live WebSocket feed, we realized it could easily be overwhelmed by too many connections. We had to engineer a strict
100-client capand implement robust state management. - Data Synchronization: Merging real-time OpenWeather data with the historical averages required careful asynchronous programming. We utilized Python's
asyncio.gather()to fetch these endpoints concurrently, cutting our API response time in half.
🏆 Accomplishments that we're proud of
We are incredibly proud of stepping away from a "hacky prototype" to build a production-ready application.
- The SMS Bot: We built an inbound Twilio webhook where anyone can text
RISK <CityName>to a phone number and get an instant AI safety response. - Enterprise Security: Every backend endpoint is protected against XSS, SQL injection, and unauthorized API abuse via JWTs and
slowapirate limiting. - Beautiful UI/UX: We created an interface that feels like a premium SaaS product, making it genuinely enjoyable for an emergency operator to use.
📚 What we learned
We learned an incredible amount about System Design. We realized that building a machine learning model is only 20% of the work; the other 80% is figuring out how to safely serve that model via an API and how to elegantly display errors. We also deepened our understanding of React hooks, WebSocket lifecycle management, and Git history manipulation.
🚀 What's next for WeatherGuard AI
We have a clear roadmap for scaling the system:
- [ ] Integrate Computer Vision using live satellite imagery via CNNs to visually confirm flooding.
- [ ] Migrate the in-memory rate limiters to a distributed Redis cache for multi-instance scaling.
- [ ] Partner with local NGOs to test the SMS warning system in low-bandwidth rural areas.
Built With
- fastapi
- gtts
- javascript
- maplibre-gl-js
- nasa-power-api
- numpy
- openai-api
- openweathermap-api
- pandas
- python
- react
- scikit-learn
- sqlite
- tomorrow.io-api
- twilio
- vite
- websockets
- xgboost


Log in or sign up for Devpost to join the conversation.