Inspiration
Climate change affects everyone worldwide.
Its effects are disastrous. In just four decades, we have lost 75% of the summer Arctic sea ice volume. There are ways to fuel the deceleration of climate change. One way is the ocean. Yet as climate change continues to accelerate, there are few tools for scientists to predict how the ocean can mitigate it.
We wanted to make things easier for scientists who have been actively working for years to address climate change. Climate change will take many years to resolve, and this tool is meant to be a proof-of-concept showing that scientists can use the ocean to accelerate its resolution.
What it does
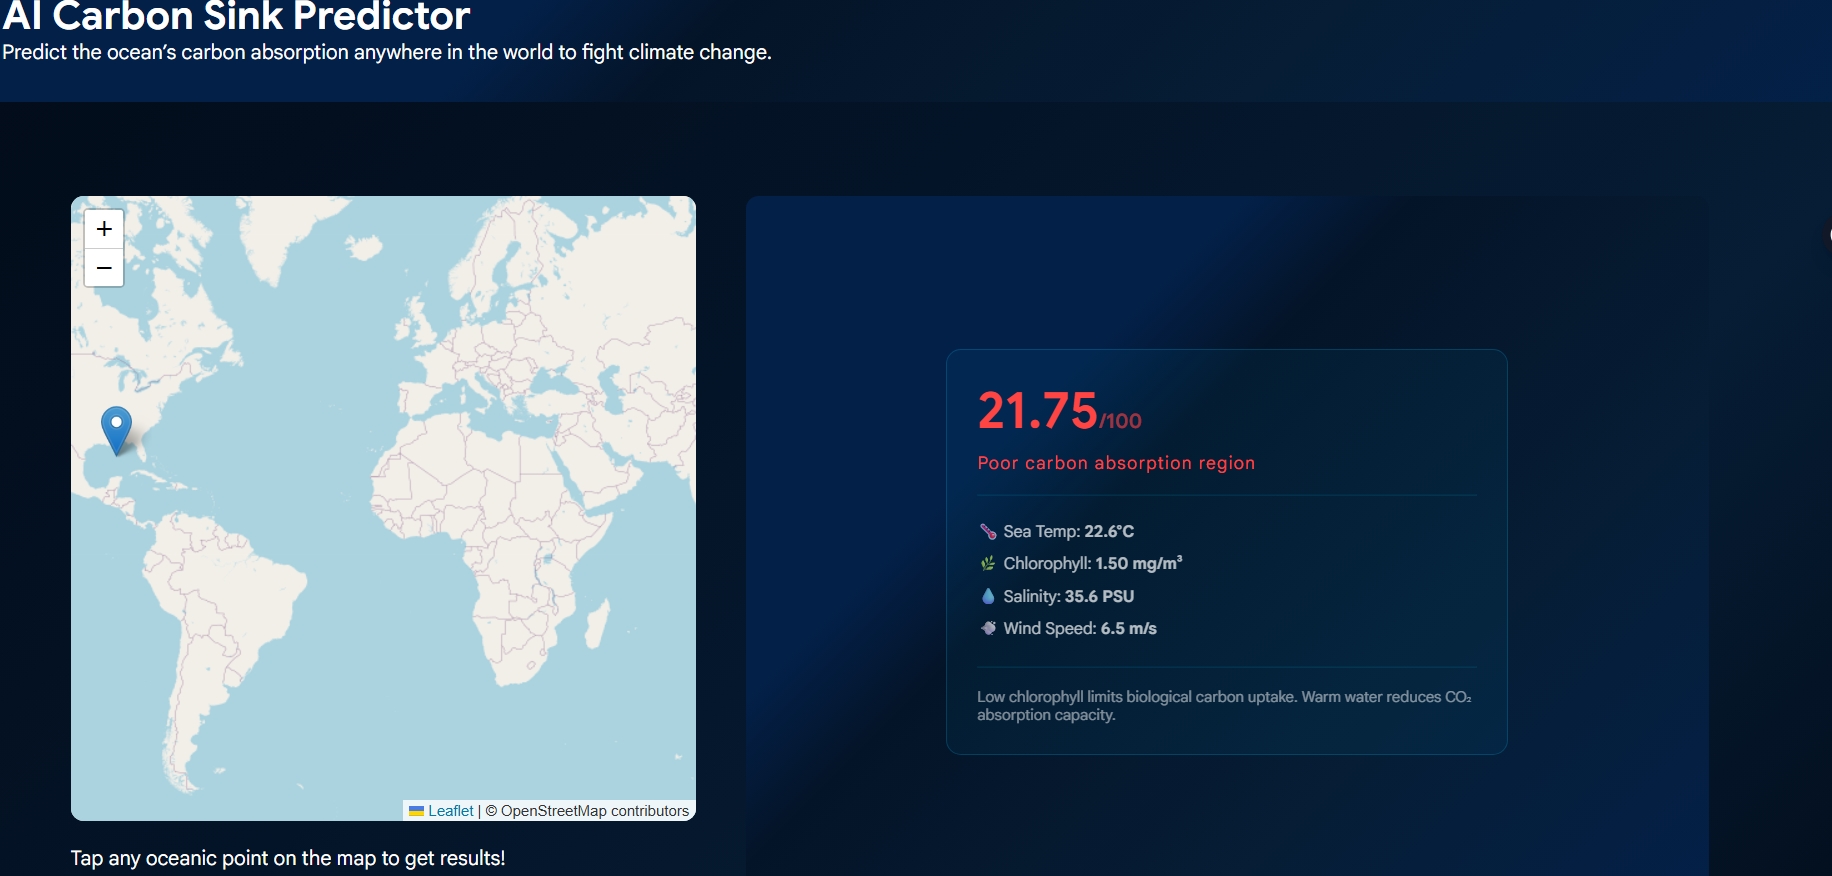
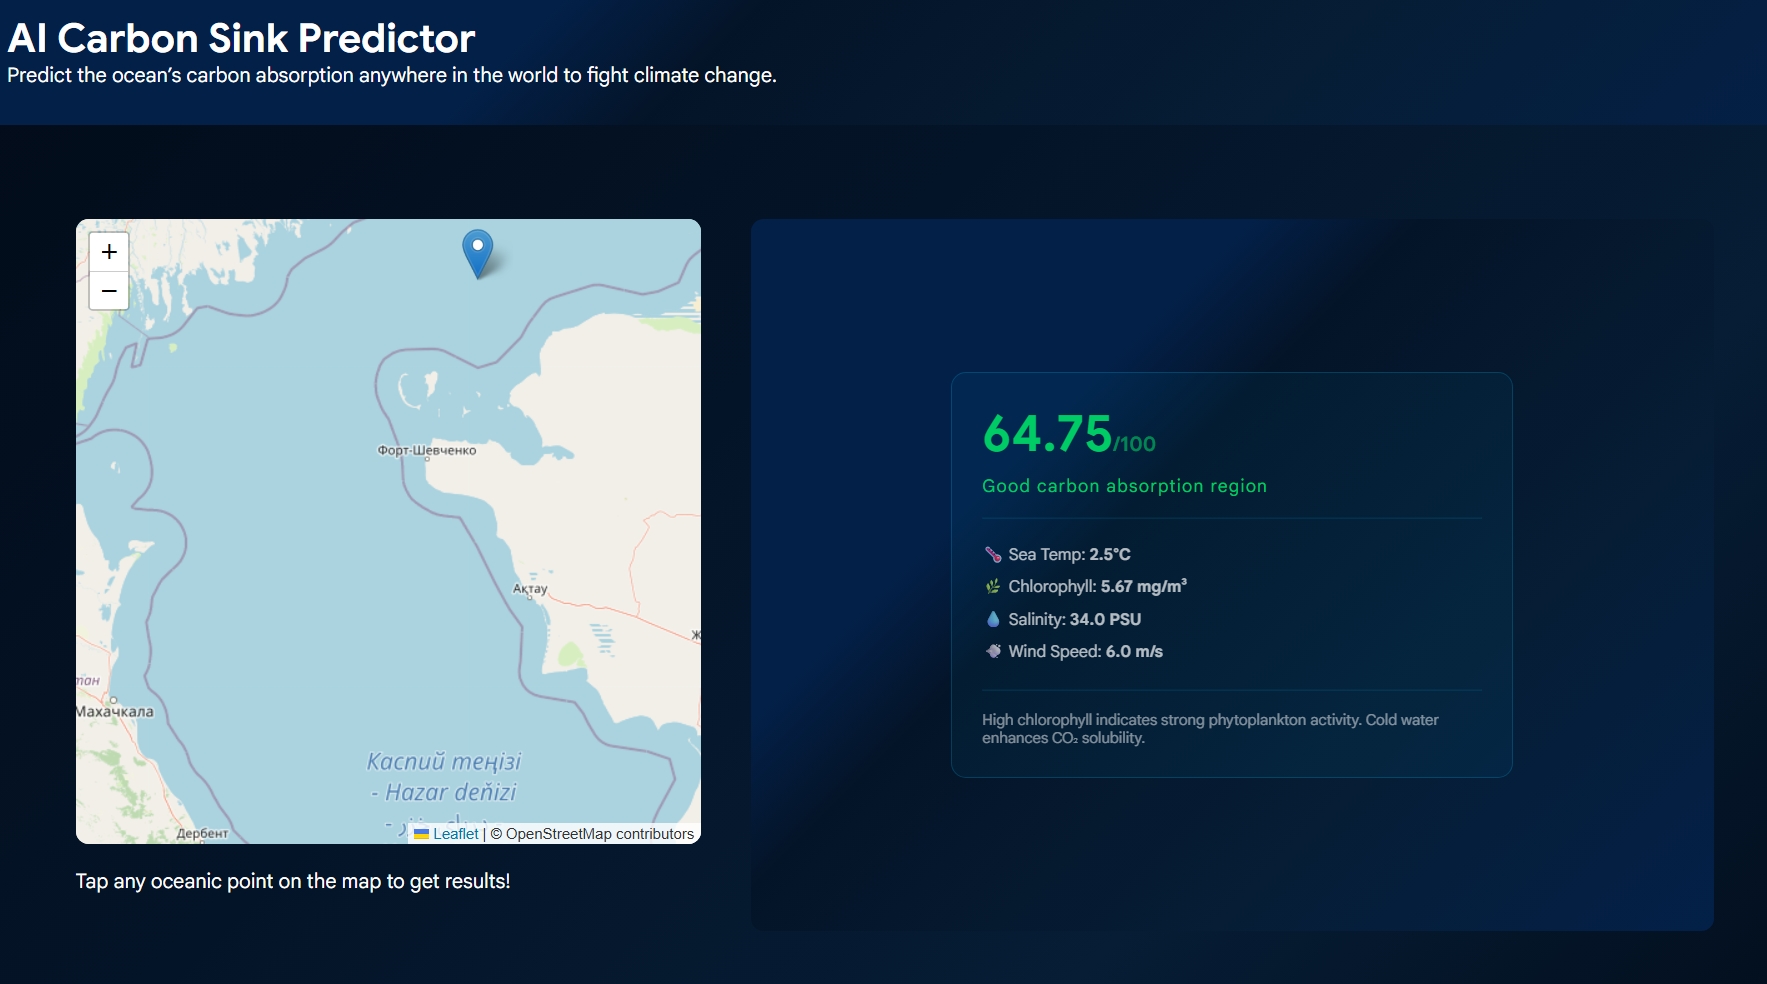
ACSP is an AI-powered tool that uses a model trained on simulated data to predict how well a specific area's carbon sink rate is. This model uses five specific oceanic factors to predict how effectively the selected coordinate absorbs carbon.
By using a model to automatically predict how an area absorbs carbon and to display the factors that influence that, scientists can use this information to improve that area's carbon absorption, in turn helping fight climate change.
Since ACSP is super easy to use, it can also be used to educate people about the factors that can influence ocean carbon absorption rates. Using the coordinates' salinity, chlorophyll concentration, wind speed, sea temperature, and season, it can reliably predict the carbon absorption rate in that area.
How we built it
To develop ACSP, we gathered and combined many resources to create a perfect, easy-to-use prediction system.
- AI Model: Using Claude Sonnet 4.2 as a proxy for making a model and our own simulated training data, we were able to create a Gradient Boosting Regressor model, which, in short, builds many decision trees (one after another), each new one correcting an aspect of the previous one. This model was perfect for predicting a number between 1 and 100 based on 5 other values.
- NOAA ERDDAP APIs: These APIs helped us get values for two of our core variables, salinity and chlorophyll concentration, based on latitude and longitude.
- NASA LARC API: This API helped us get values for the sea temperature and wind speed of a specific coordinate point.
- Is On Water? API: This API helped us make sure that we would prevent the user from choosing a coordinate point based on land
- Frontend Development: We used simple HTML, CSS, and JS to build our frontend. This helped all our members code the frontend, as these were relatively simple compared to frameworks like React, which was perfect for an app like ours.
- Backend Architecture: We used a Python framework called Flask to develop our backend. This framework was relatively simple yet allowed us to do many things, making it perfect for our project.
- Hosting: For hosting our project, we decided to go with Render as it has the capabilities to host a Flask project.
- OpenStreetMap/Leaflet: For the map part of our project, we decided to use Leaflet as it was easy to code with and use.
Challenges we ran into
- AI Model Training: Since real-world data was not easily accessible for us, or locked behind a paywall, we had to pivot to make our model as accurate as possible. We did this by making a Python script to generate simulated training data based on real-world trends.
- Accuracy was too high: When we ran our model, we noticed our R^2 was unusually high at a staggering 0.99. This was abnormal, as many models usually had an accuracy of 0.7-0.8. We realized that this indicated our model was accurate but not realistic in light of ocean trends. We then changed our training data, adding a random number to the output each time to make it more realistic. Even though it reduced our R^2 to 0.78, it gave us confidence that we had a more realistic dataset. We decided not to change the data any further, as it might interfere with what our app was intended to do.
- NOAA ERDDAP API: The NOAA ERDDAP APIs returned null many times, causing them to be unreliable, but our only option. For this reason, we decided to set fallback values based on ocean averages for chlorophyll concentration and salinity in the event that this happens.
Accomplishments that we're proud of
- Making a proof of concept that scientists can use tools like these to help fight climate change in many places.
- Overcoming the challenges of having no real-world data for our model and finding a creative solution to combat it.
- Making an easy-to-use, accessible tool for people around the world to educate themselves on ocean carbon absorption rates and the factors that influence them.
What we learned
- Scientist challenges: We learned the challenges that scientists have to face when combating climate change.
- Mapping technologies: We learned how to use mapping technologies in applications in many ways, such as getting coordinates.
- API Integration: We learned how to integrate many APIs to create a wonderful product.
What's next for ACSP
We want to expand ACSP and add new features, such as an AI wrapper that explains what the data our model returns means, and give the model real-world data so we have a reliable dataset.
Acknowledgements and Resources
We would like to thank the team at NCSSM for hosting this hackathon; we would never have made this project without it. We would also like to thank NASA and NOAA (though they won't see this) because this project would have been impossible without their APIs. Here are the resources we used for background research on this project:
- NOAA. “Ocean Carbon Uptake.” Noaa.gov, 2019, www.pmel.noaa.gov/co2/story/Ocean+Carbon+Uptake.
- “Which Processes Can Affect the Rate of Carbon Dioxide?” ScienceInsights, 15 Mar. 2026, scienceinsights.org/which-processes-can-affect-the-rate-of-carbon-dioxide/.
- NASA Earth Observatory. “The Ocean’s Carbon Balance.” NASA Science, July 2008, science.nasa.gov/earth/earth-observatory/oceans-carbon-balance/.
Quick Note
Render may take upwards of 5 minutes to load our project if you plan to access it.
Built With
- css3
- data
- flask
- gradient-boosting-regressor
- html5
- javascript
- map
- nasa
- noaa
- noaa-erddap
- prediction
- python
- render


Log in or sign up for Devpost to join the conversation.