-
-
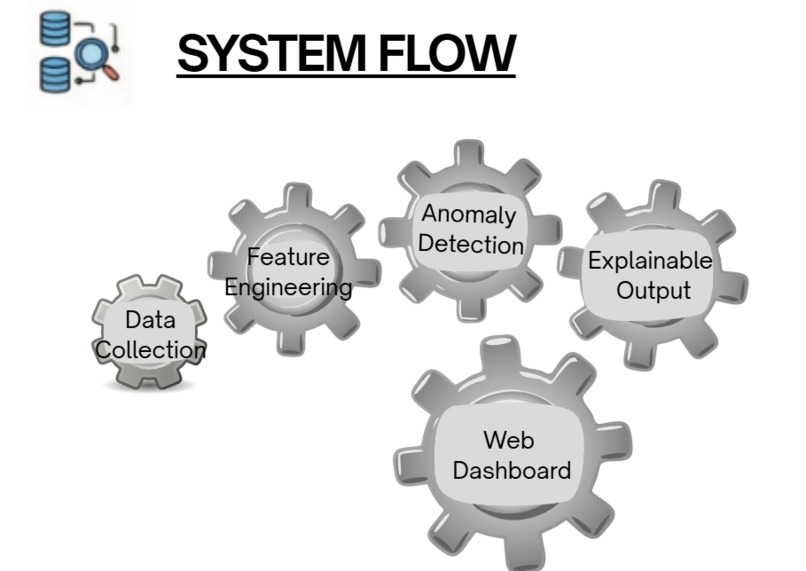
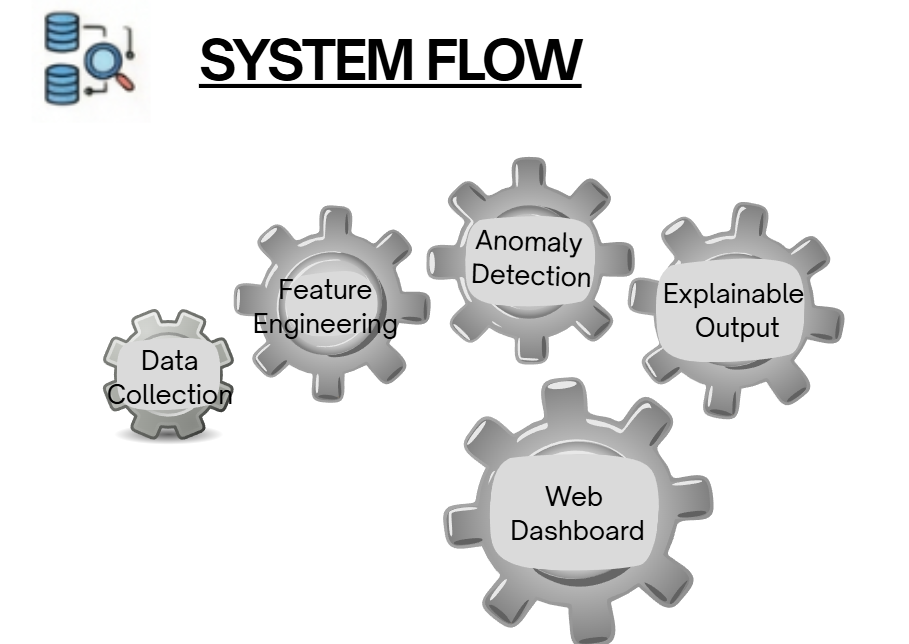
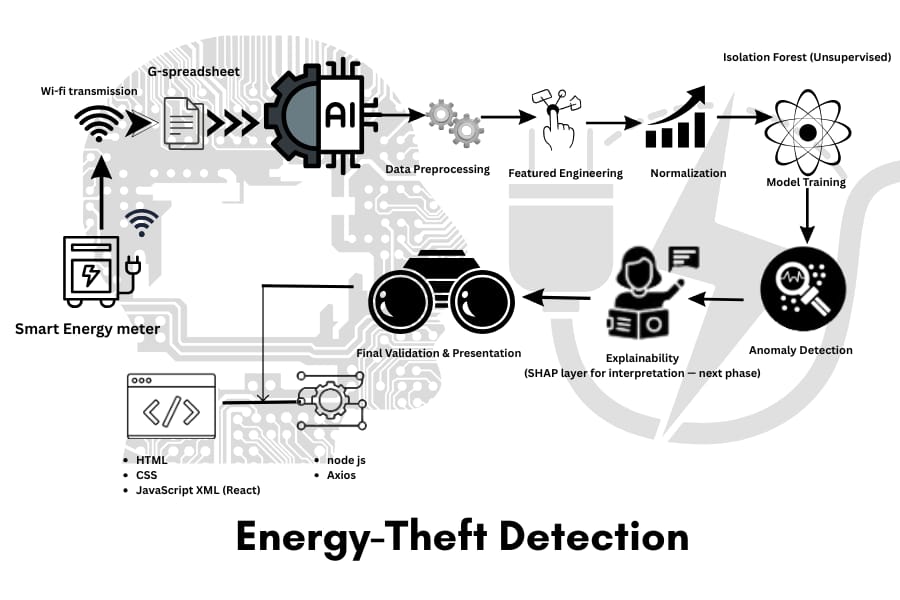
The picture shows the system flow of the project.
-
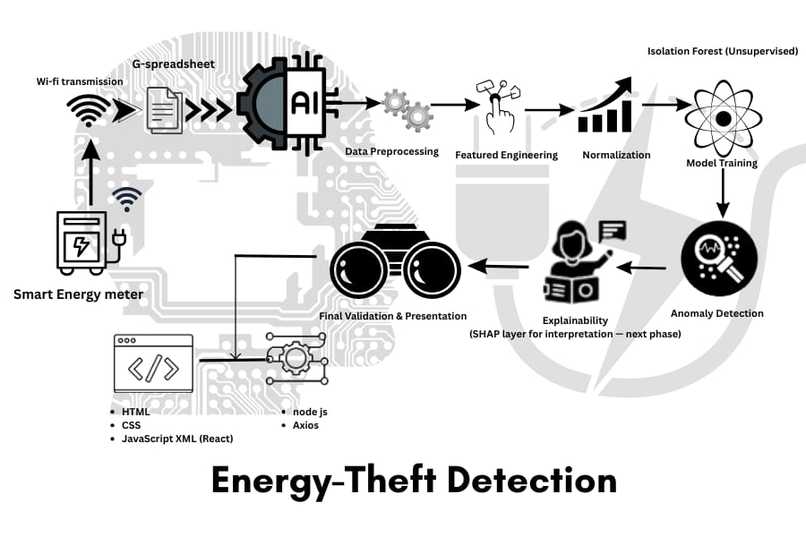
This diagram outlines an AI-Powered Energy Theft Detection: From Smart Meter to Unsupervised Anomaly Analysis.
-
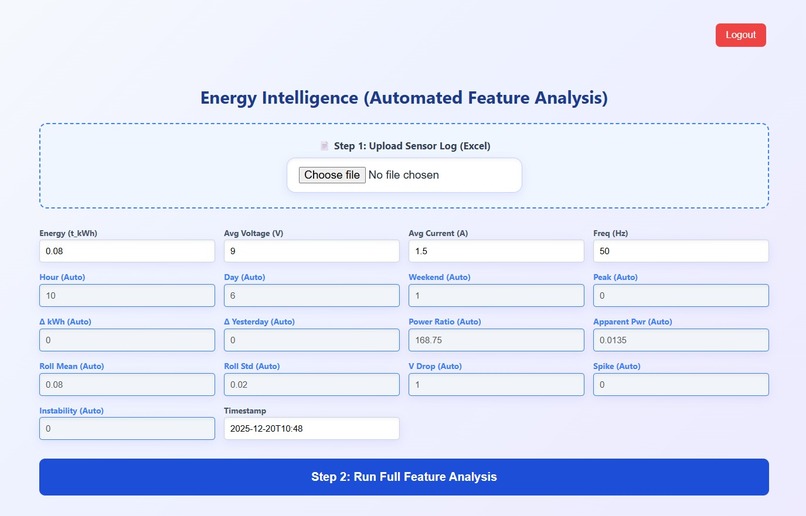
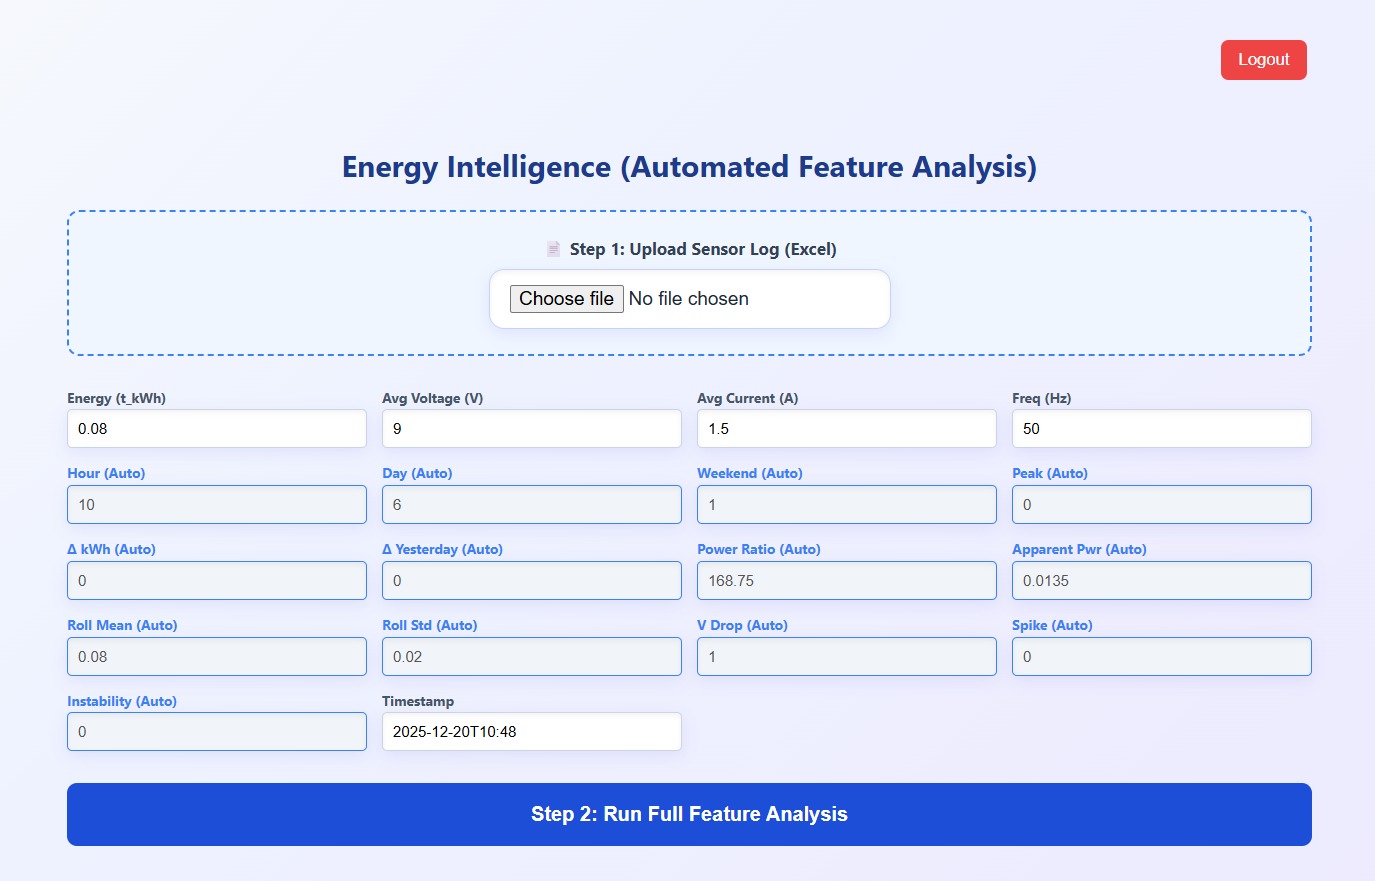
The picture shows the frontend
-

The image shows explainable output using SHAP when there is no theft detected
-

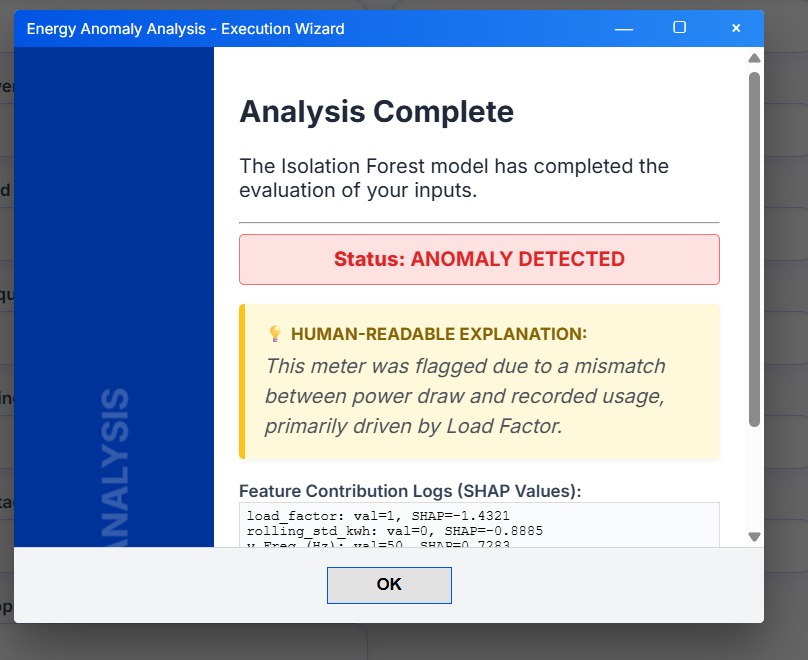
The image shows explainable output using SHAP when theft is detected

Inspiration
The idea for this project came from observing how energy theft affects utility companies and consumers worldwide. While smart meters are being widely deployed across the world, most existing AI-based solutions for theft detection rely on labelled data, which is hard to obtain in the real world. Furthermore, they act as "black boxes", offering little to no explanation on why a customer is flagged. Hence, we wanted to build a system that was not only accurate but also transparent and explainable, allowing utility operators to understand why a consumer was flagged for abnormal consumption and conduct a field inspection.
What it does
Performs autonomous anomaly detection using Isolation Forest to identify abnormal electricity consumption patterns without requiring labeled theft data.
Provides explainability using SHAP, showing which behavioural features (like load factor, voltage deviation, peer z-score, and consumption spikes/drops) contributed most to flagging a consumer.
Supports real-time predictions through a full-stack deployment with React frontend, Node.js server, and Flask backend.
Can be validated through data from a smart-meter hardware prototype for practical reliability.
How we built it
Problem Definition & Requirement Analysis Identified electricity theft as a real-world challenge and chose an unsupervised, explainable AI approach.
Data Collection & Cleaning Used real smart meter data from Mathura, India. Cleaned missing values, duplicates, and formatting issues, and resampled time-series data.
Feature Engineering Extracted behavioral features such as load factor, peer z-score, voltage deviation, spike/drop indicators, and daily/weekly consumption patterns.
Model Training Trained an Isolation Forest model on engineered features and tuned parameters like contamination rate, tree count, and depth.
Explainability Integration Integrated SHAP to provide feature-level explanations for each detected anomaly.
Full-Stack Deployment Built a Flask API with /predict and /explain endpoints, connected via a Node.js server, and visualised results using a React frontend.
Hardware Prototype Developing a smart meter mock setup and integrating it with the backend for real-time testing.
Testing & Refinement Conducting end-to-end testing and refining features, thresholds, and UI for improved reliability.
Challenges we ran into
Handling missing or inconsistent timestamps when resampling data from 3-minute to 15-minute intervals.
SHAP computation is heavy for large datasets, making real-time explanations challenging.
Coordinating a multi-layer architecture (React, Node.js, Flask) while maintaining data consistency.
Upscaling the data obtained from the smart meter prototype to match the dataset the model was trained on.
Bridging the knowledge gap due to the interdisciplinary nature of the project.
Accomplishments that we're proud of
Developed a fully functional system that detects anomalies in smart meter data with explainable outputs.
Achieved a transparent system that utility operators can trust for actionable insights.
Built a scalable and modular framework combining ML, backend, frontend, and hardware.
What we learned
Importance of feature engineering in anomaly detection: behavioural patterns like load factor and peer z-scores are highly informative.
How unsupervised ML models like Isolation Forest work and can be applied without labelled data.
Techniques for explainable AI, including SHAP, to interpret model decisions.
Full-stack deployment skills: connecting React, Node.js, and Flask efficiently.
Practical experience in hardware-software integration and real-time testing.
What's next for AI-Based Energy Theft Detection
Environmental Understanding Integrating real-time weather and seasonal data to differentiate between legitimate climate-driven surges (e.g., high AC usage during heatwaves) and actual energy theft.
Technical Fault Differentiation Train the system to identify and separate power outages and technical faults from theft-related anomalies.
Bidirectional power flow Taking reverse flow and forward flow due to solar panels and EVs into account.
Predictive Maintenance By adding extra features to the model, the system can predict equipment failure.
Regional Customisation & Global Scalability Developing a Layer that allows the model to adapt to different international grid standards and diverse consumption patterns.


Log in or sign up for Devpost to join the conversation.