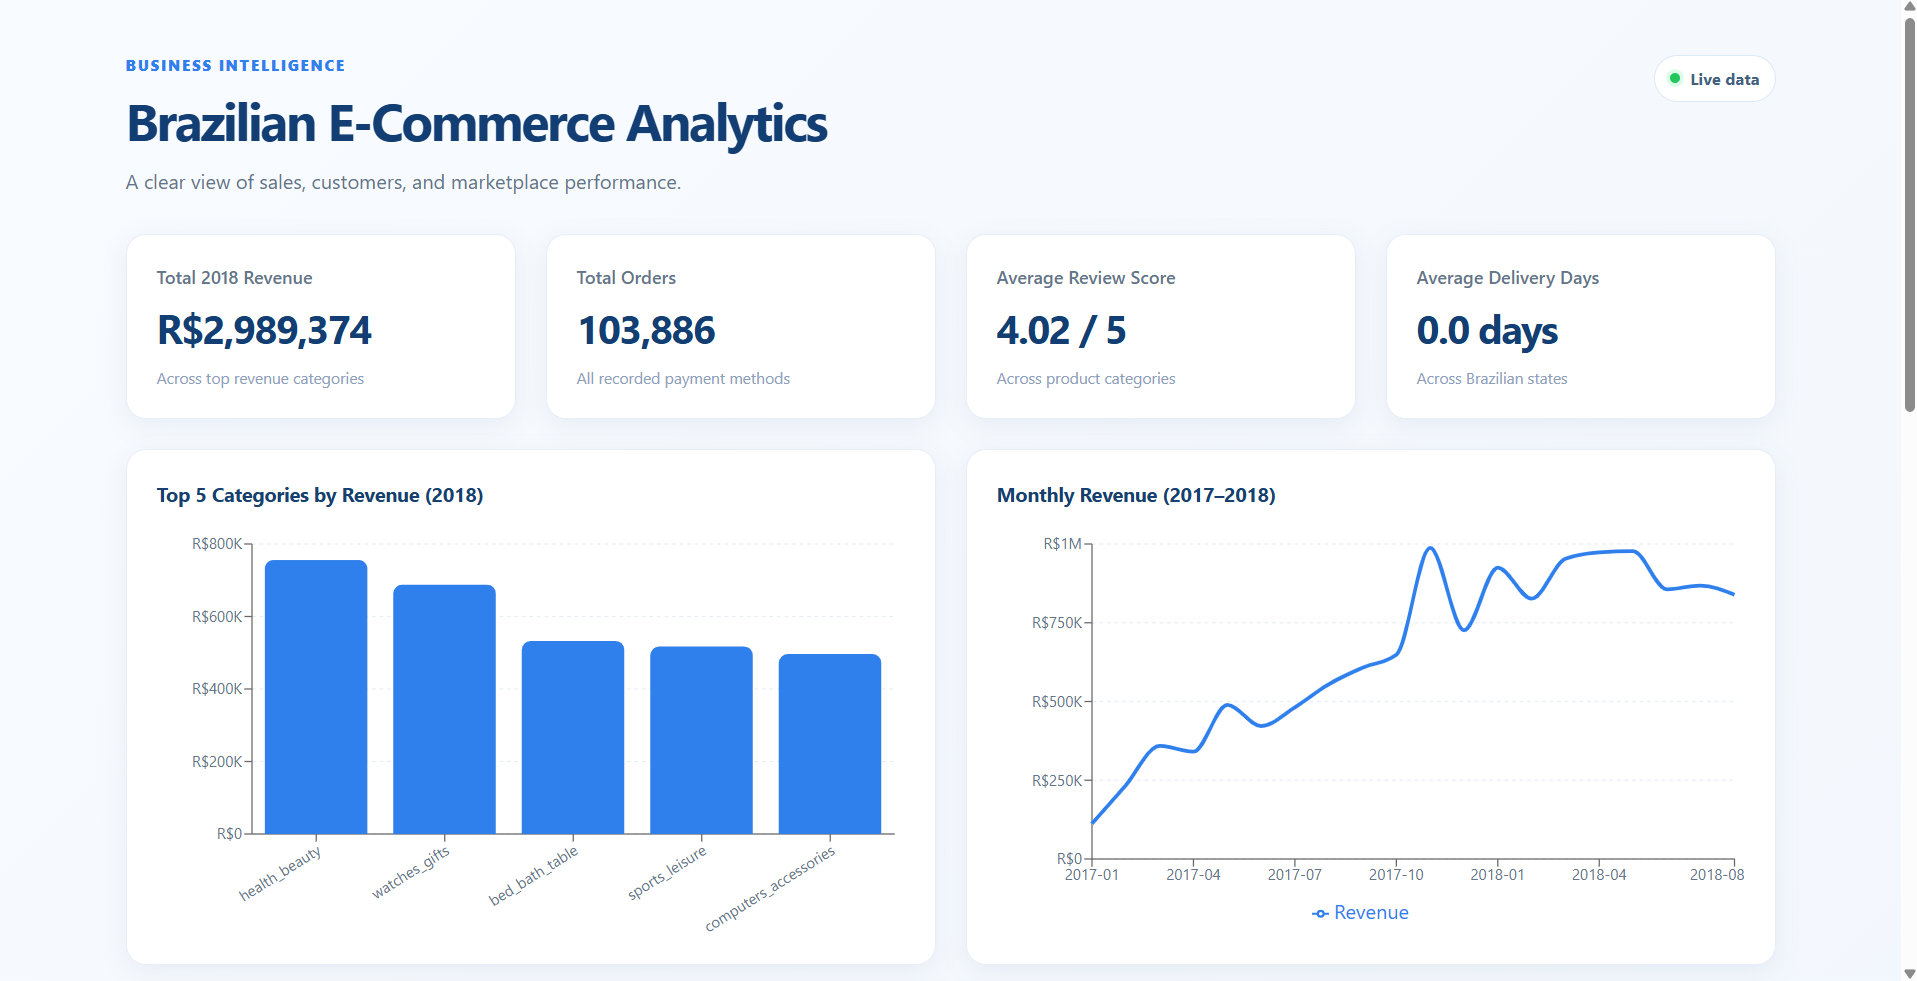
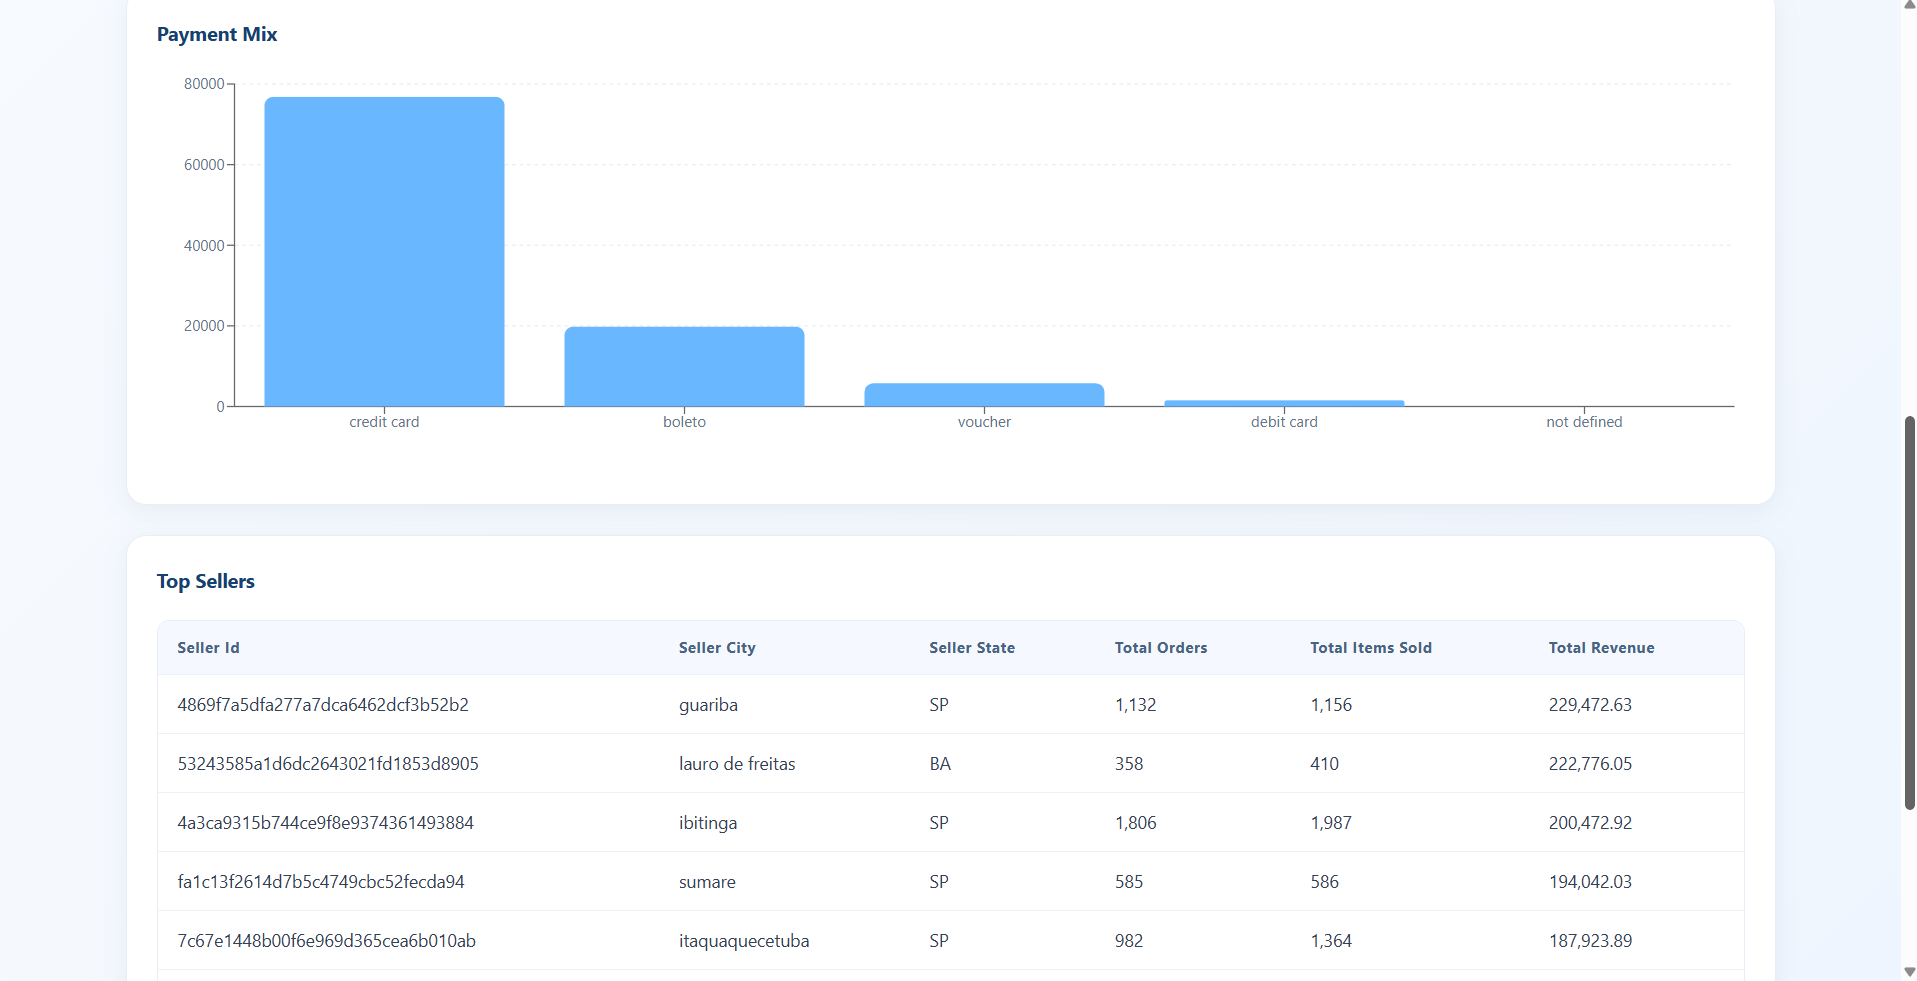
Excited to share my latest project: AI-Based Analytical Dashboard 📊🤖 I'm thrilled to showcase an AI-powered analytical dashboard that I built using React, Vite, Supabase, and the Brazilian E-commerce Dataset. The dashboard transforms raw e-commerce data into interactive visualizations and business insights, helping users analyze performance through a clean, responsive, and intuitive interface. ✨ Key Features: 📊 Interactive charts and visualizations 💰 KPI cards for revenue, orders, customer reviews, and delivery performance 🛍️ Top-performing product categories and sellers 💳 Payment method distribution analysis 🌎 State-wise delivery insights ⚡ Fast and responsive UI with React + Vite 🗄️ Data integration using Supabase 🛠️ Tech Stack: React Vite Supabase Recharts JavaScript SQL Brazilian E-commerce Dataset This project gave me hands-on experience in frontend development, data visualization, database integration, and building dashboards that transform complex datasets into actionable business insights. 🎥 I've also attached a demo video showcasing the dashboard in action so you can explore its features and user experience. I have advanced my dashboard such that it can be runned on any browser.Just Check this out!!! https://lnkd.in/gt7s_niB
I'd love to hear your thoughts and feedback. Feel free to connect or share your suggestions!
Built With
- javascript
- react
- recharts
- sql
- supabase
- vercel
- vite

Log in or sign up for Devpost to join the conversation.