-
-
PlaneTeer Home Page
-

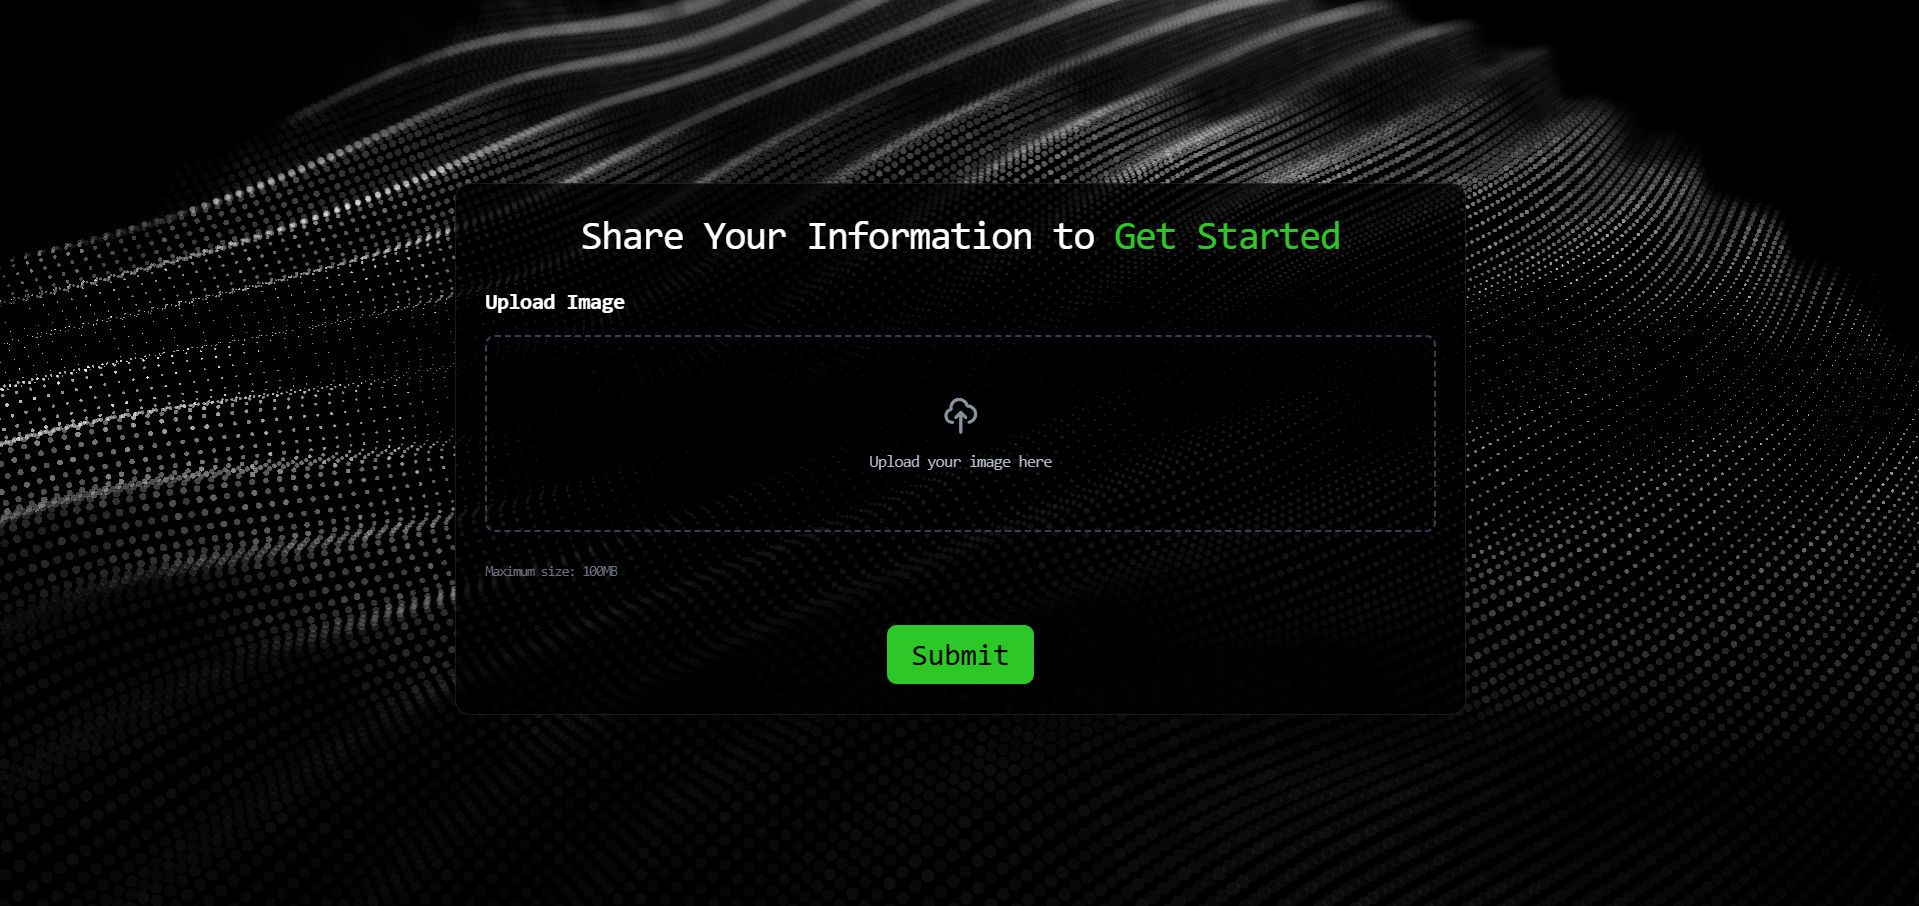
PlaneTeer Photo Submission Page
-

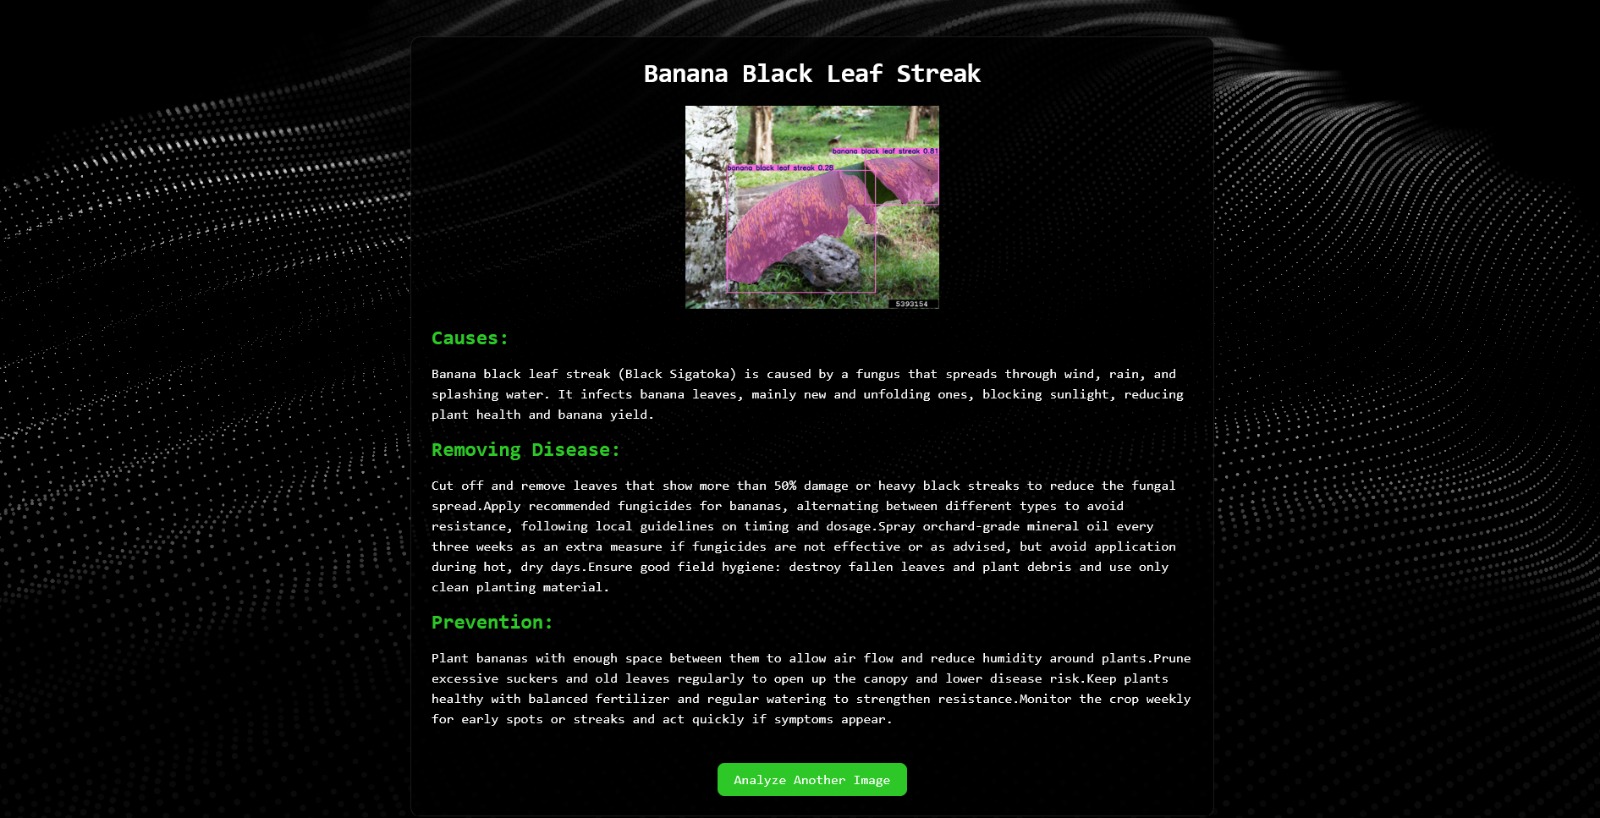
Banana Black Leaf Streak Test Result
-
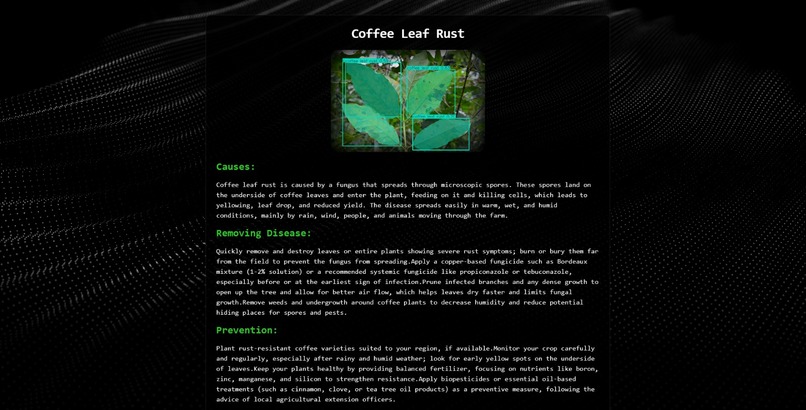
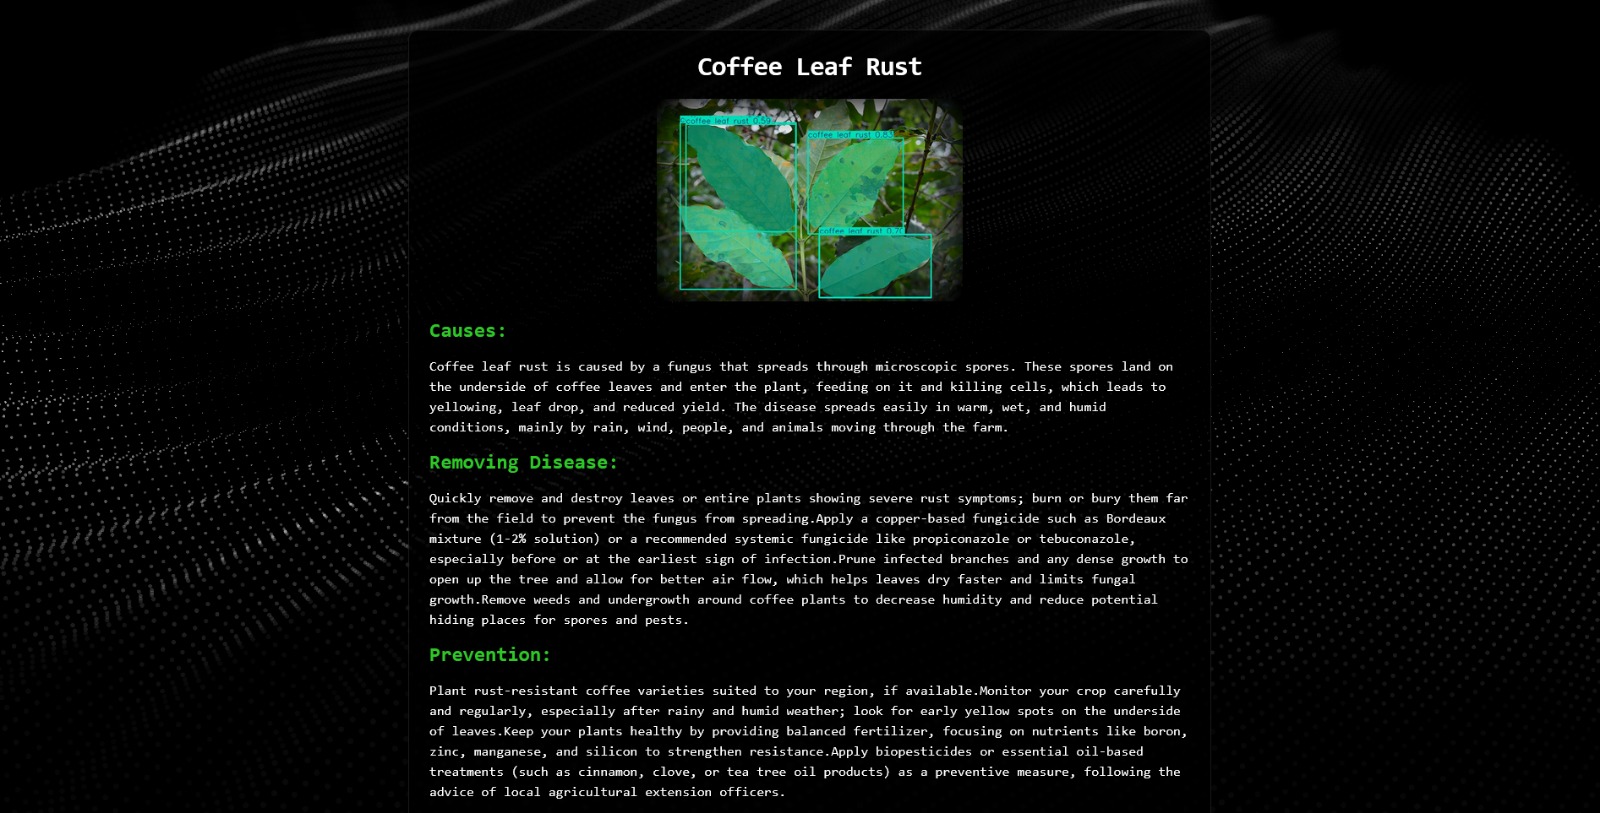
Coffee Leaf Test Result
-
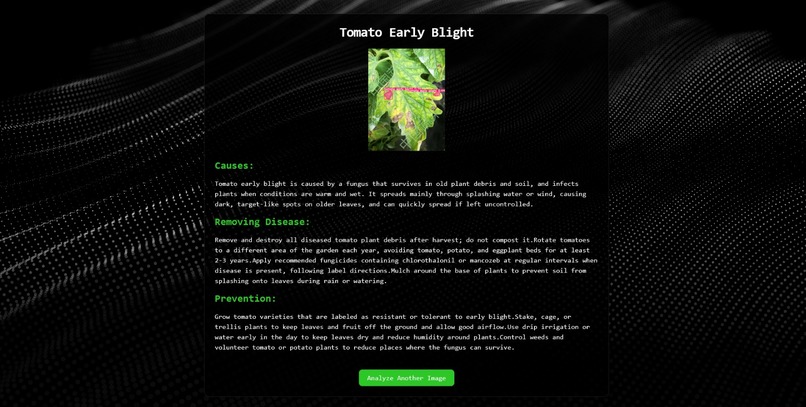
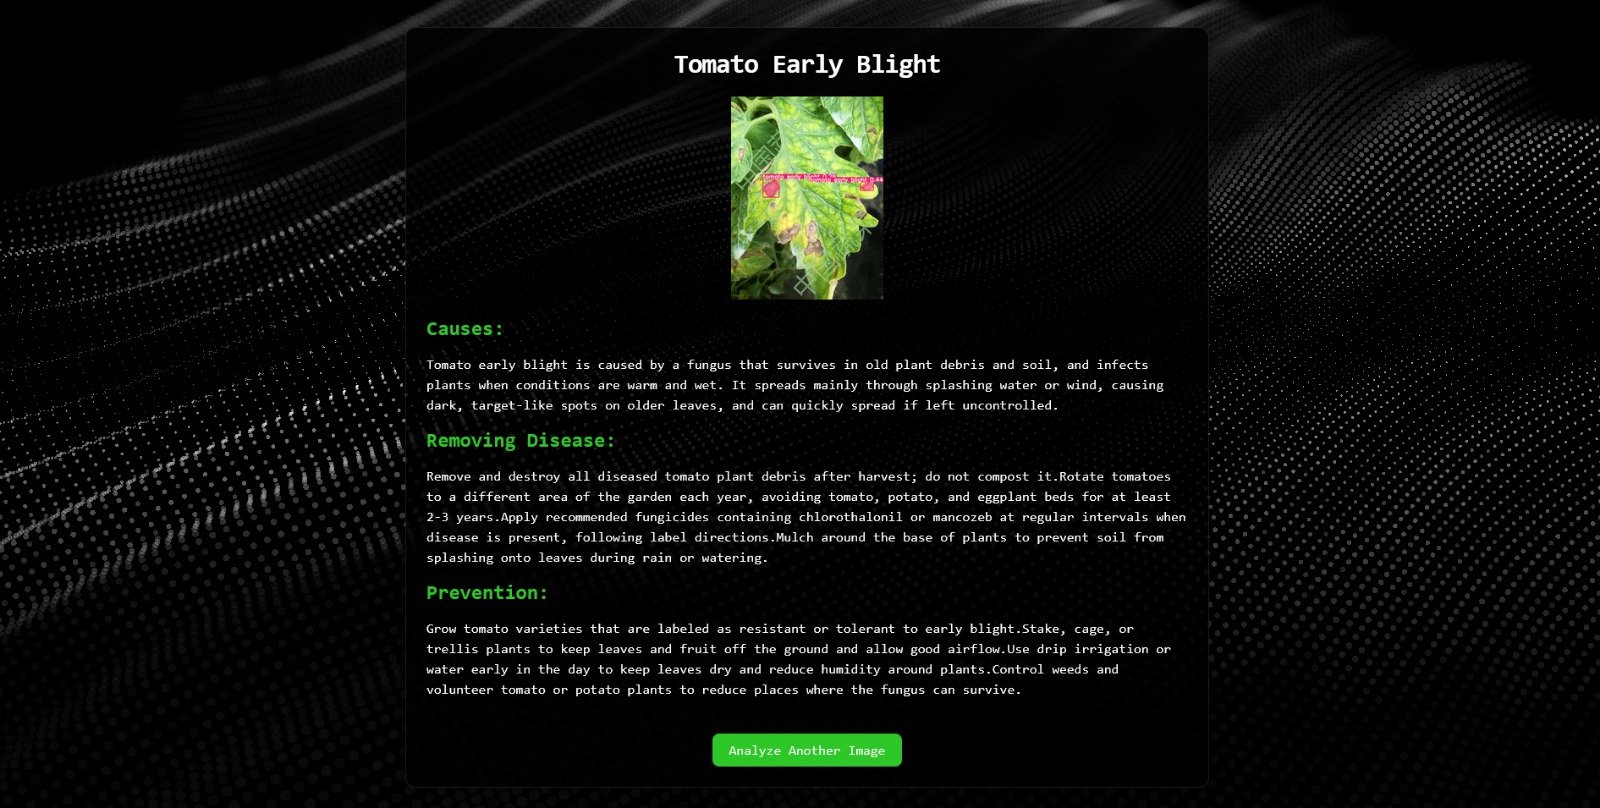
Tomato Early Blight Test Result

Planeteer: Rooting Out Crop Disease
Inspiration
Agriculture is a race against time. For a farmer, a single 'off-looking' leaf can be the precursor to a field wide disaster. In the heat of a routine check-up, uncertainty is the enemy.
We built Planeteer to replace that uncertainty with instant, actionable intelligence. Instead of waiting days for a lab result, a farmer can simply snap a photo. Our platform identifies the specific disease, assesses the transmission risk to surrounding crops, and provides clear, data driven next steps.
We wanted to put a plant pathologist in every farmer's pocket.
How We Built It
With only 48 hours on the clock, we divided and conquered by splitting into two specialized squads:
The ML Team
We leveraged the YOLO (You Only Look Once) architecture to create a high-precision segmentation model. While many models can draw a box around a plant, we needed a segmentation model to outline the exact area of infection. This allows us to show exactly show the area of interest to the end user.
The Frontend Team
The frontend was built using React for a lightning-fast experience. We optimized the dashboard for high contrast visibility, ensuring that even under the bright sun in the middle of a field, a farmer can easily navigate the UI and upload images.
Challenges We Faced
Hackathons are rarely a straight line. We hit two major roadblocks that tested our resolve:
- The Labeling Trap: Our first iteration utilized a derived version of the PlantSeg dataset. While the model became incredibly accurate at segmenting leaf patterns, we realized the labels were generic "object" tags. It could tell the farmer that something was wrong, but not what was wrong. We had to pivot to using the original PlantSeg dataset that we then had to format for our uses.
- The "Black Hole" Images: We encountered a technical issue where a new dataset provided annotations in the form images that were completely black, leaving us confused as to how to use the them for our training. Reading through the study we found that the researchers had chosen to use a binary segmentation mask to annotate them image and with that info we found the proper way to format the annotations for our uses.
What We Learned
This sprint was a masterclass in Agile AI Development:
- Data > Architecture: A state-of-the-art YOLOv26 model is only as good as its annotations. We learned that data cleaning is 90% of the battle.
- Resource Management: Between Google Colab disconnections and GPU memory limits, we learned how to optimize training parameters (like
imgszandbatch size) to get the most out of every epoch. - The Power of the Pivot: Identifying a "dead-end" dataset early saved us several hours of useless training time.
Future Roadmap
- Edge Inference: Compiling our model to TensorFlow Lite or ONNX so it can run locally on a phone without any internet connection.
- Multi-Spectral Detection: Integrating infrared data to detect heat-stress signatures before the disease is even visible to the human eye.
- Smart Remediation: Connecting our API to automated drone sprayers for precision "spot-treatment" of infected zones.

Log in or sign up for Devpost to join the conversation.