What Inspired Us We were inspired by the challenges faced by small-scale farmers in obtaining timely and actionable insights about their crops. Access to expensive, high-tech agricultural tools is often limited. We wanted to create a simple, free-to-use platform that leverages satellite technology to provide farmers with a clear overview of their field health, pest alerts, and weather forecasts. Our goal was to build a tool that could help them make data-driven decisions to improve crop yield and sustainability. ...................................................................................................................................
How We Built It We built CropVision as a modern web application with a focus on a clean, intuitive user experience. The front-end is a single-page application created with React and TypeScript for a robust, type-safe codebase. We used Vite for a fast development experience and Tailwind CSS for responsive styling and rapid UI development. For the user interface, we leveraged shadcn/ui components like Card, Button, and Tabs to ensure a consistent and professional look.
The application follows a simple but powerful flow:
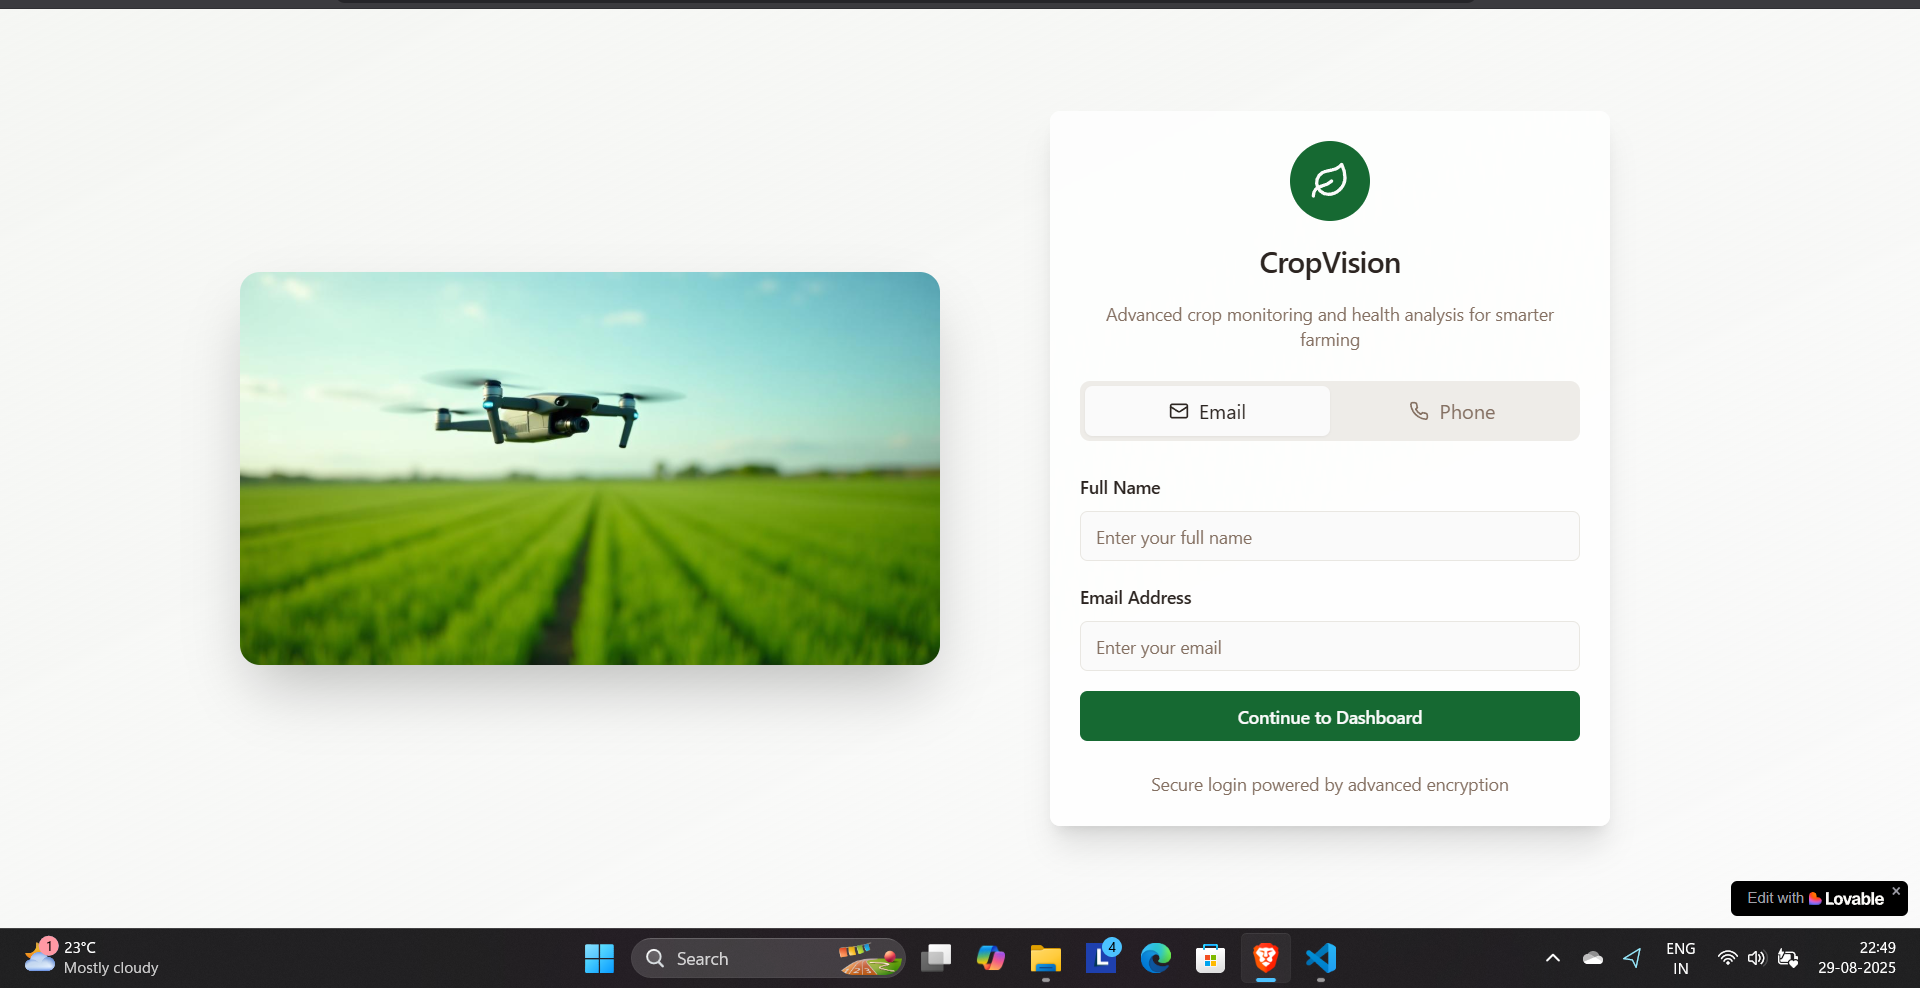
User Authentication: A user logs in with their name and email, providing a personalized experience.
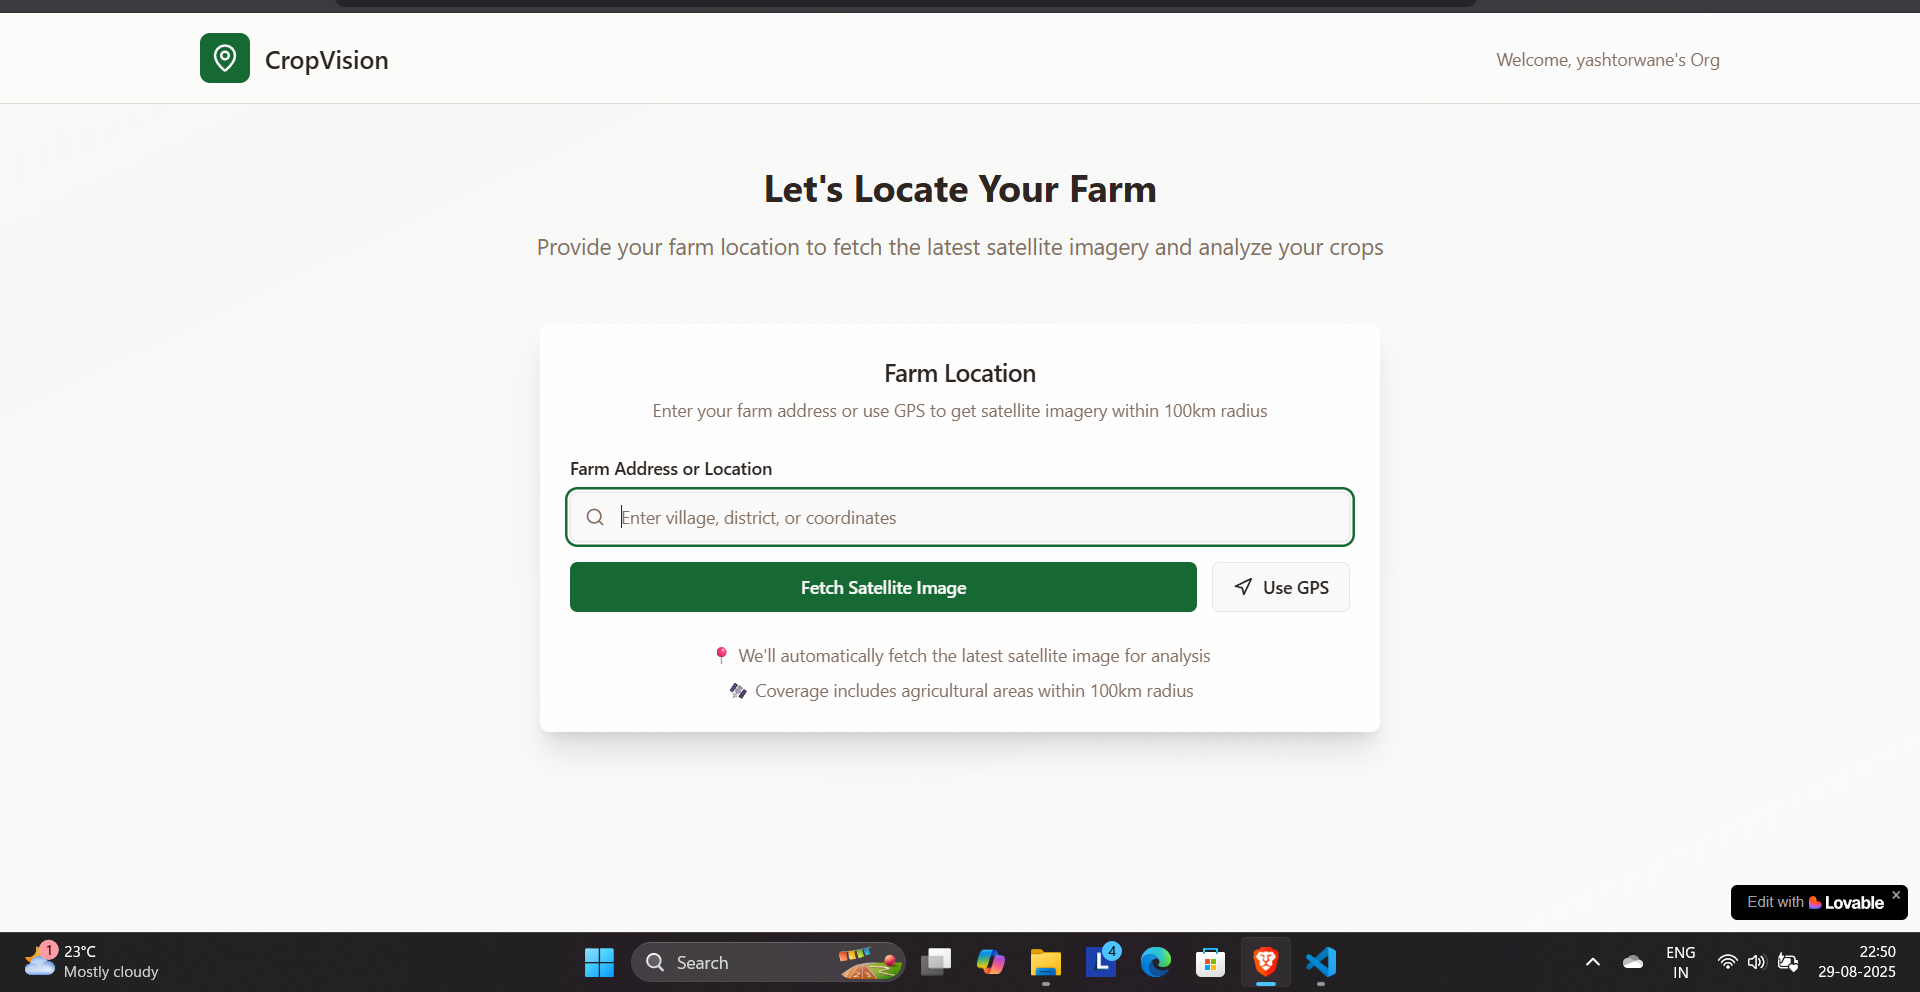
Location Selection: The user can either input their farm's address or use their device's GPS to pinpoint the location.
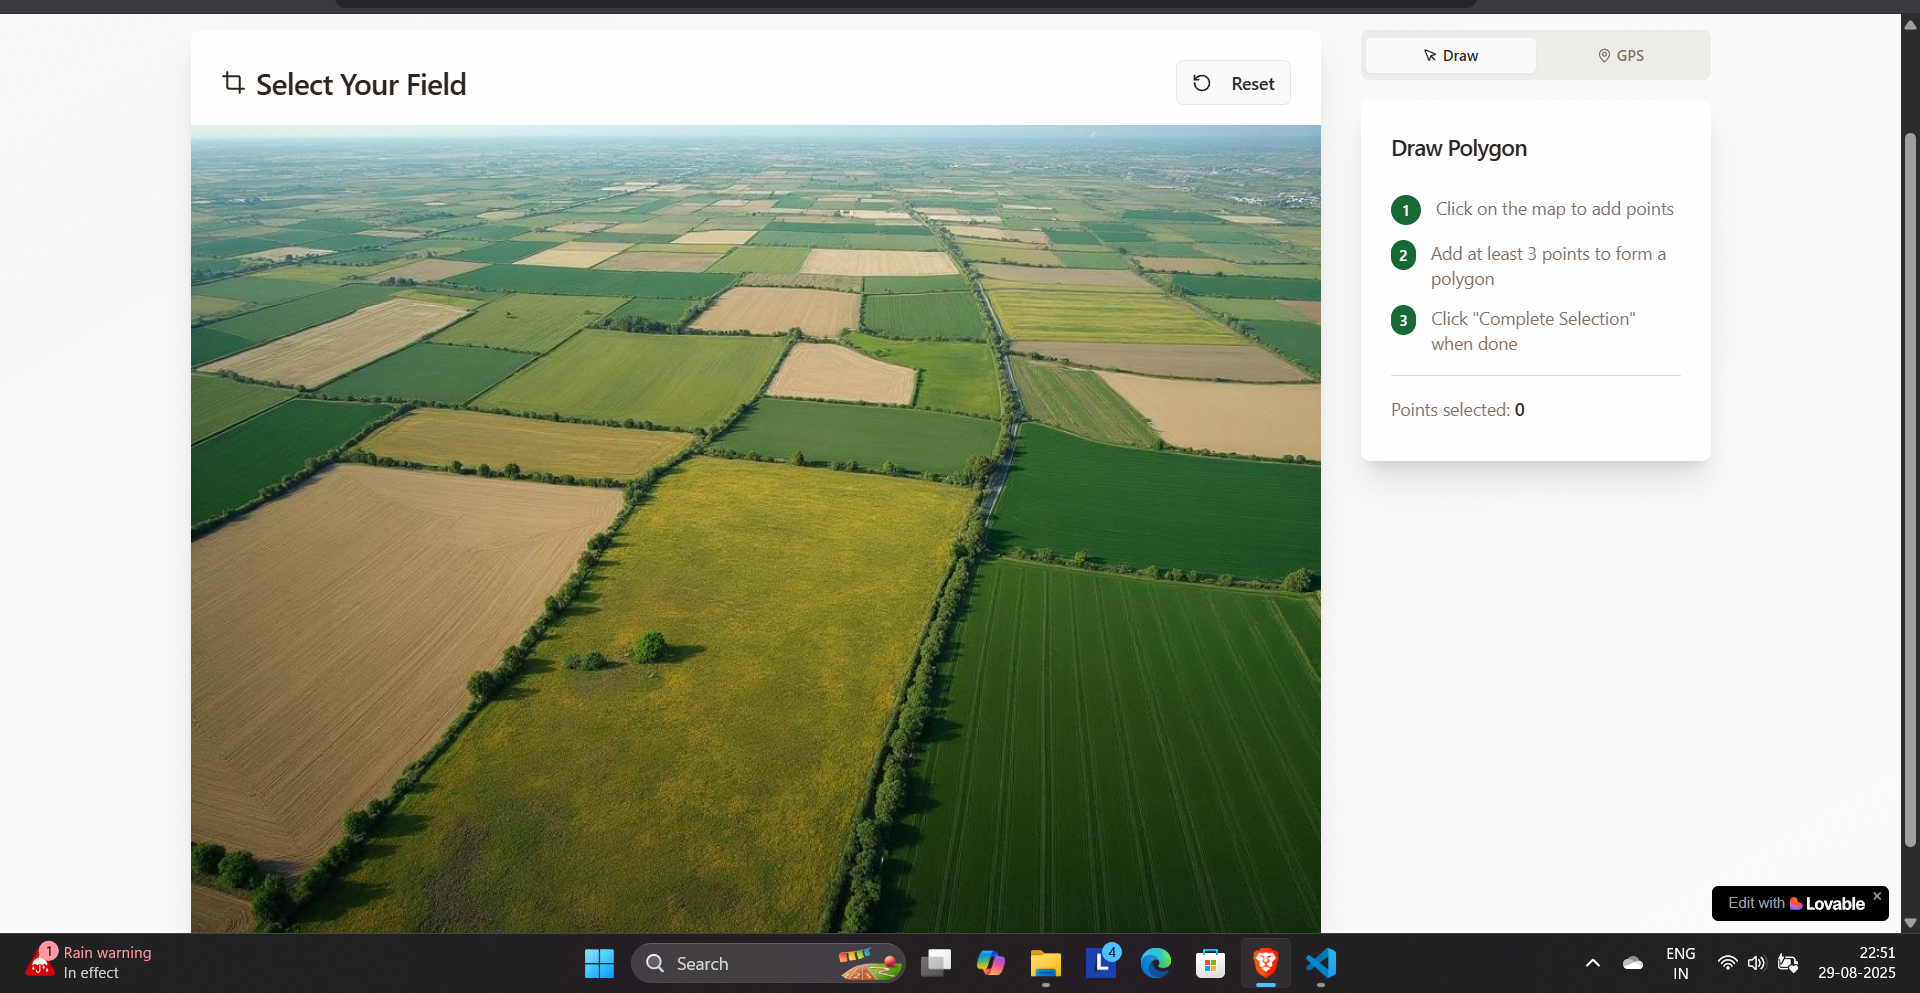
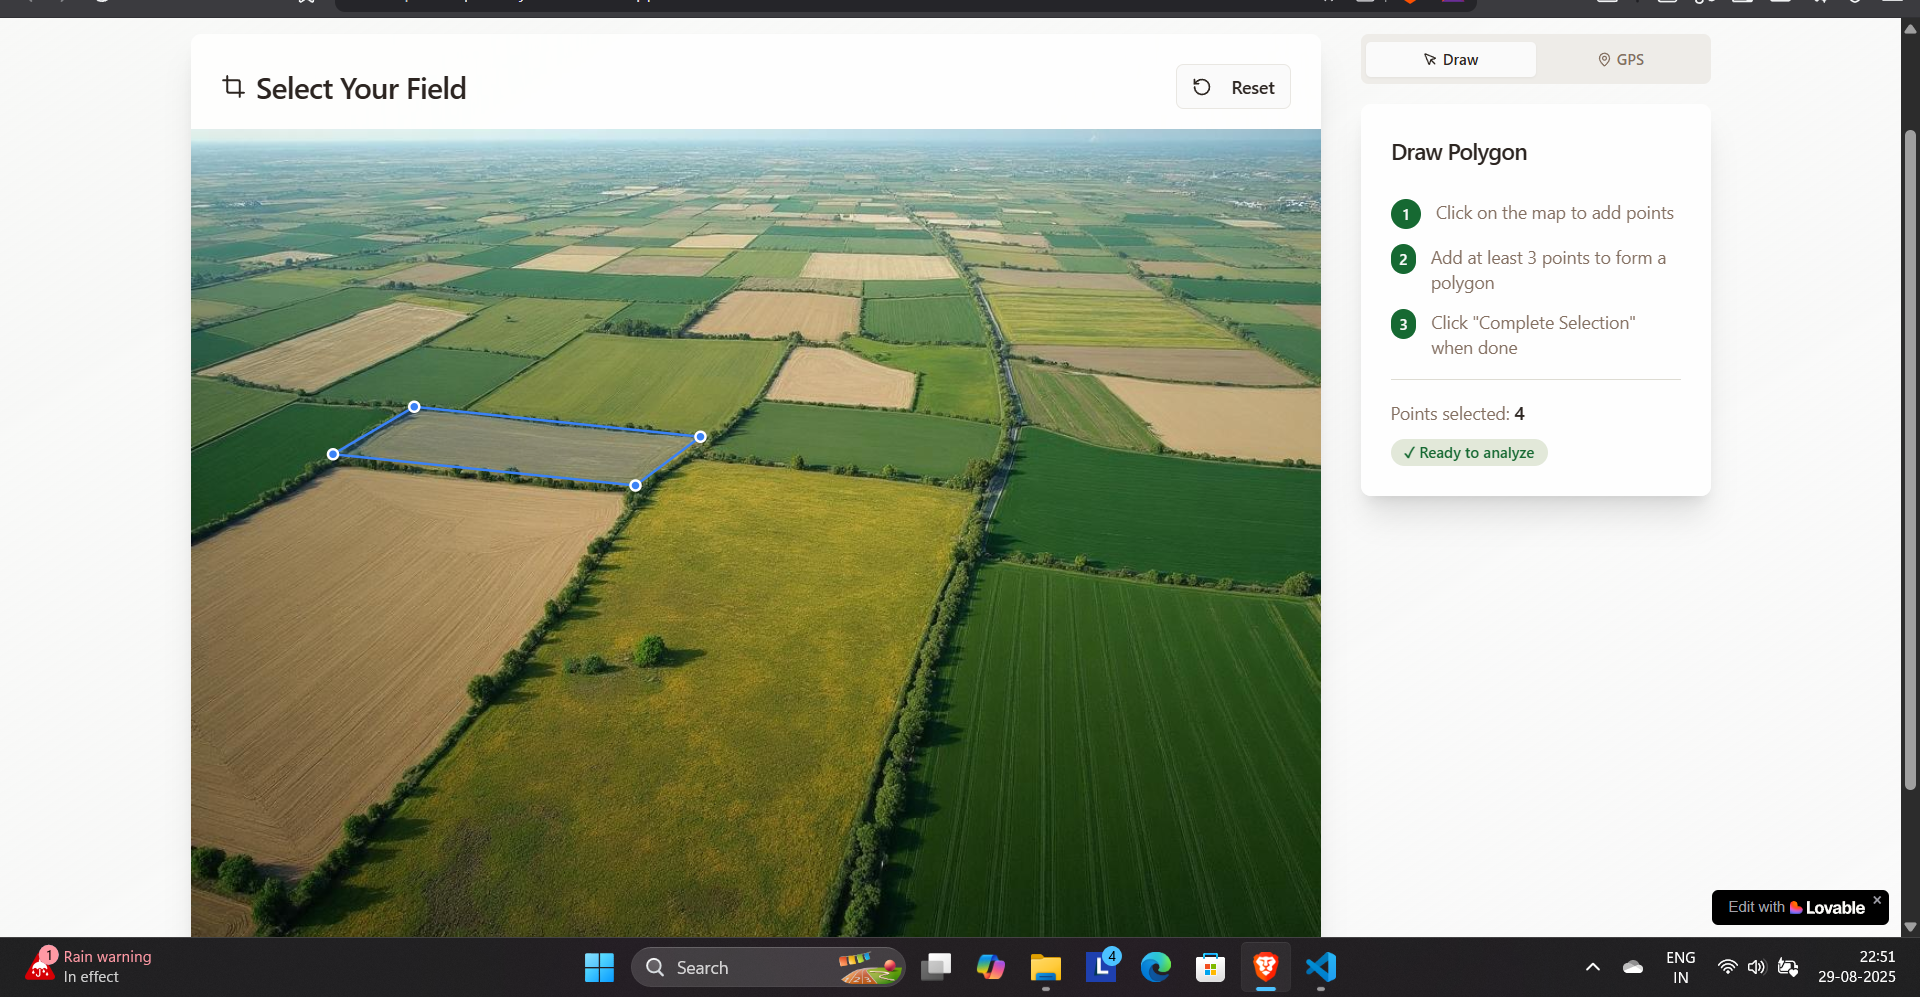
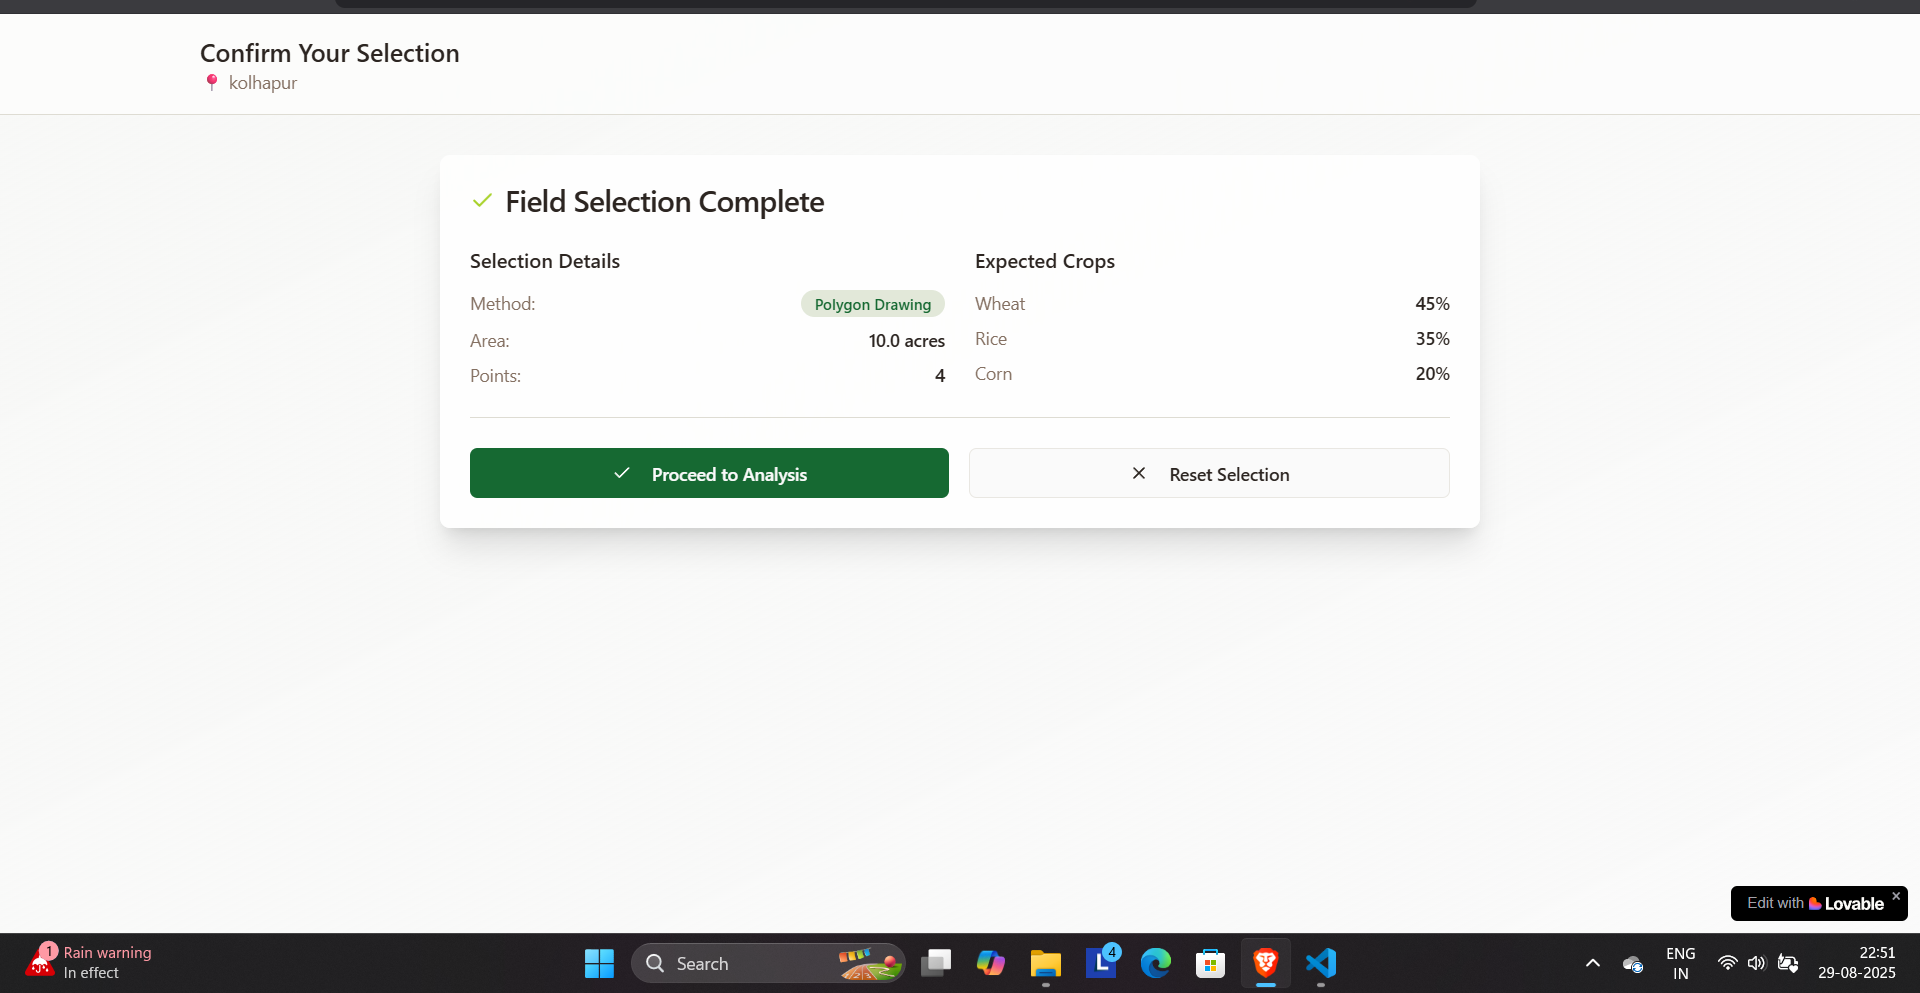
Field Selection: This is the core of our project. Users can interact with a satellite image of their farm and draw a custom polygon to select a specific field.
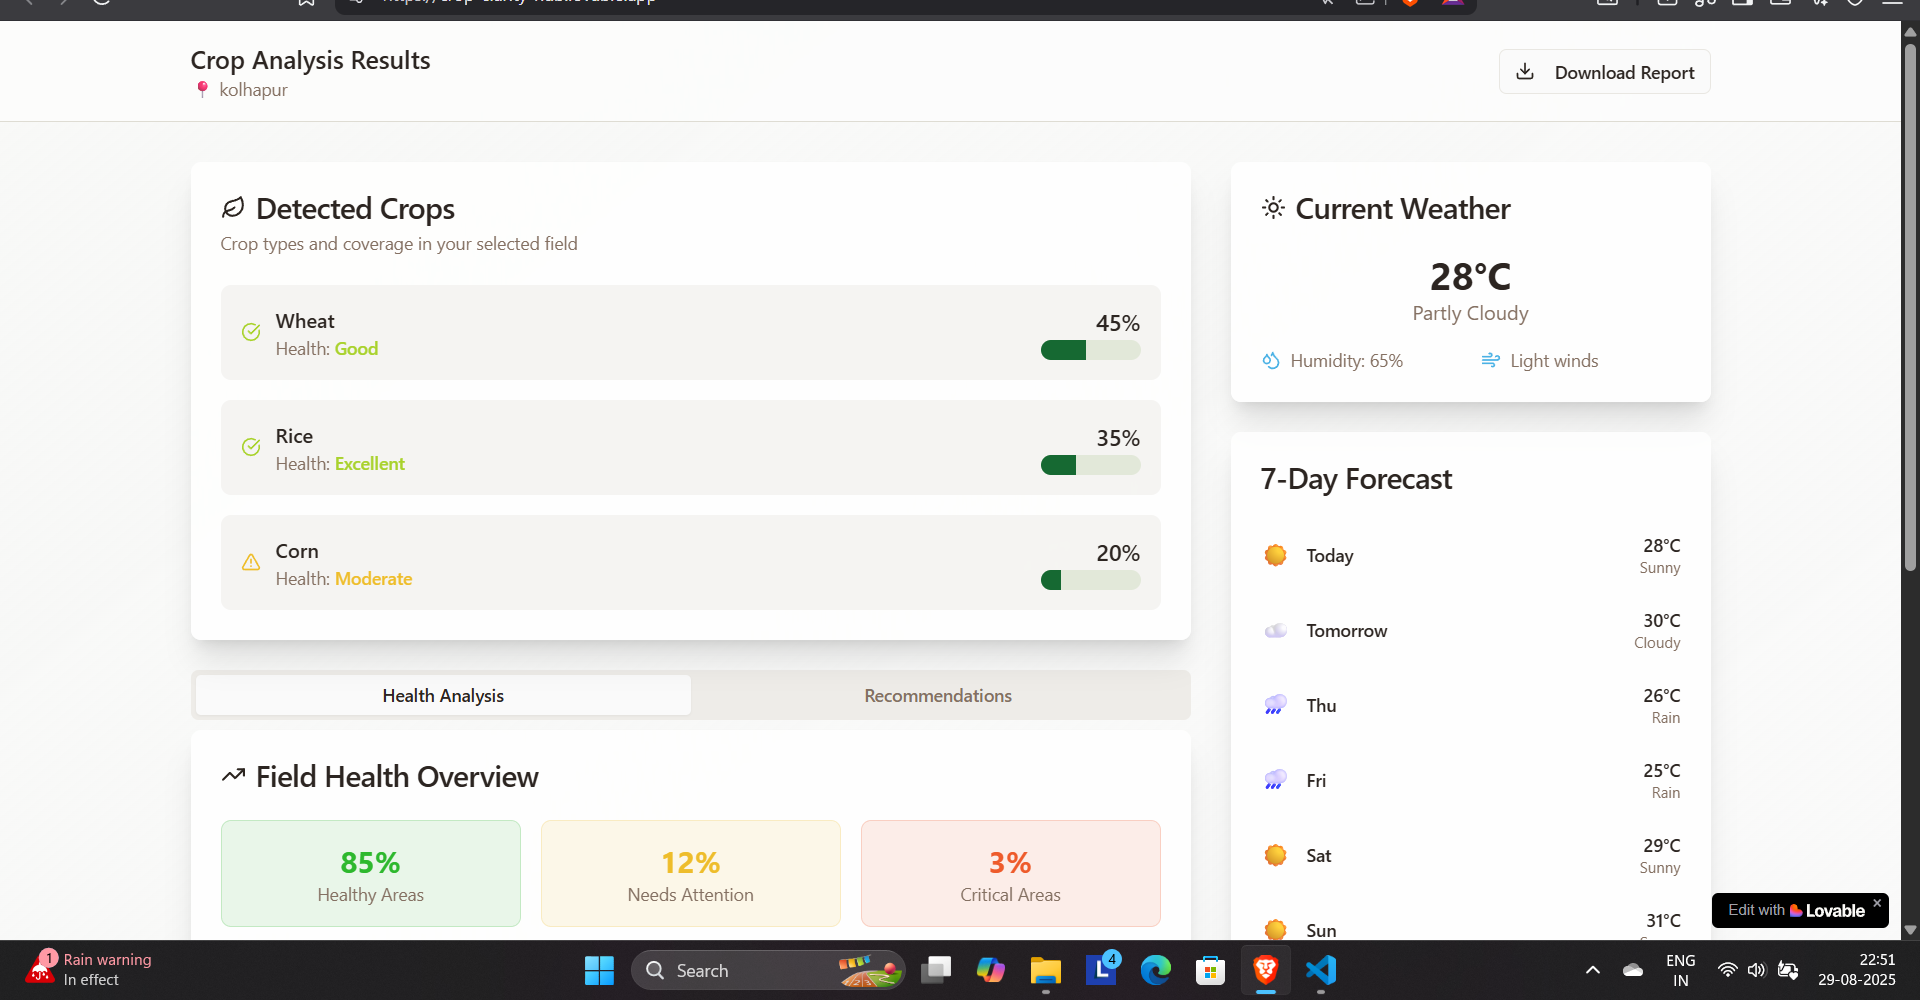
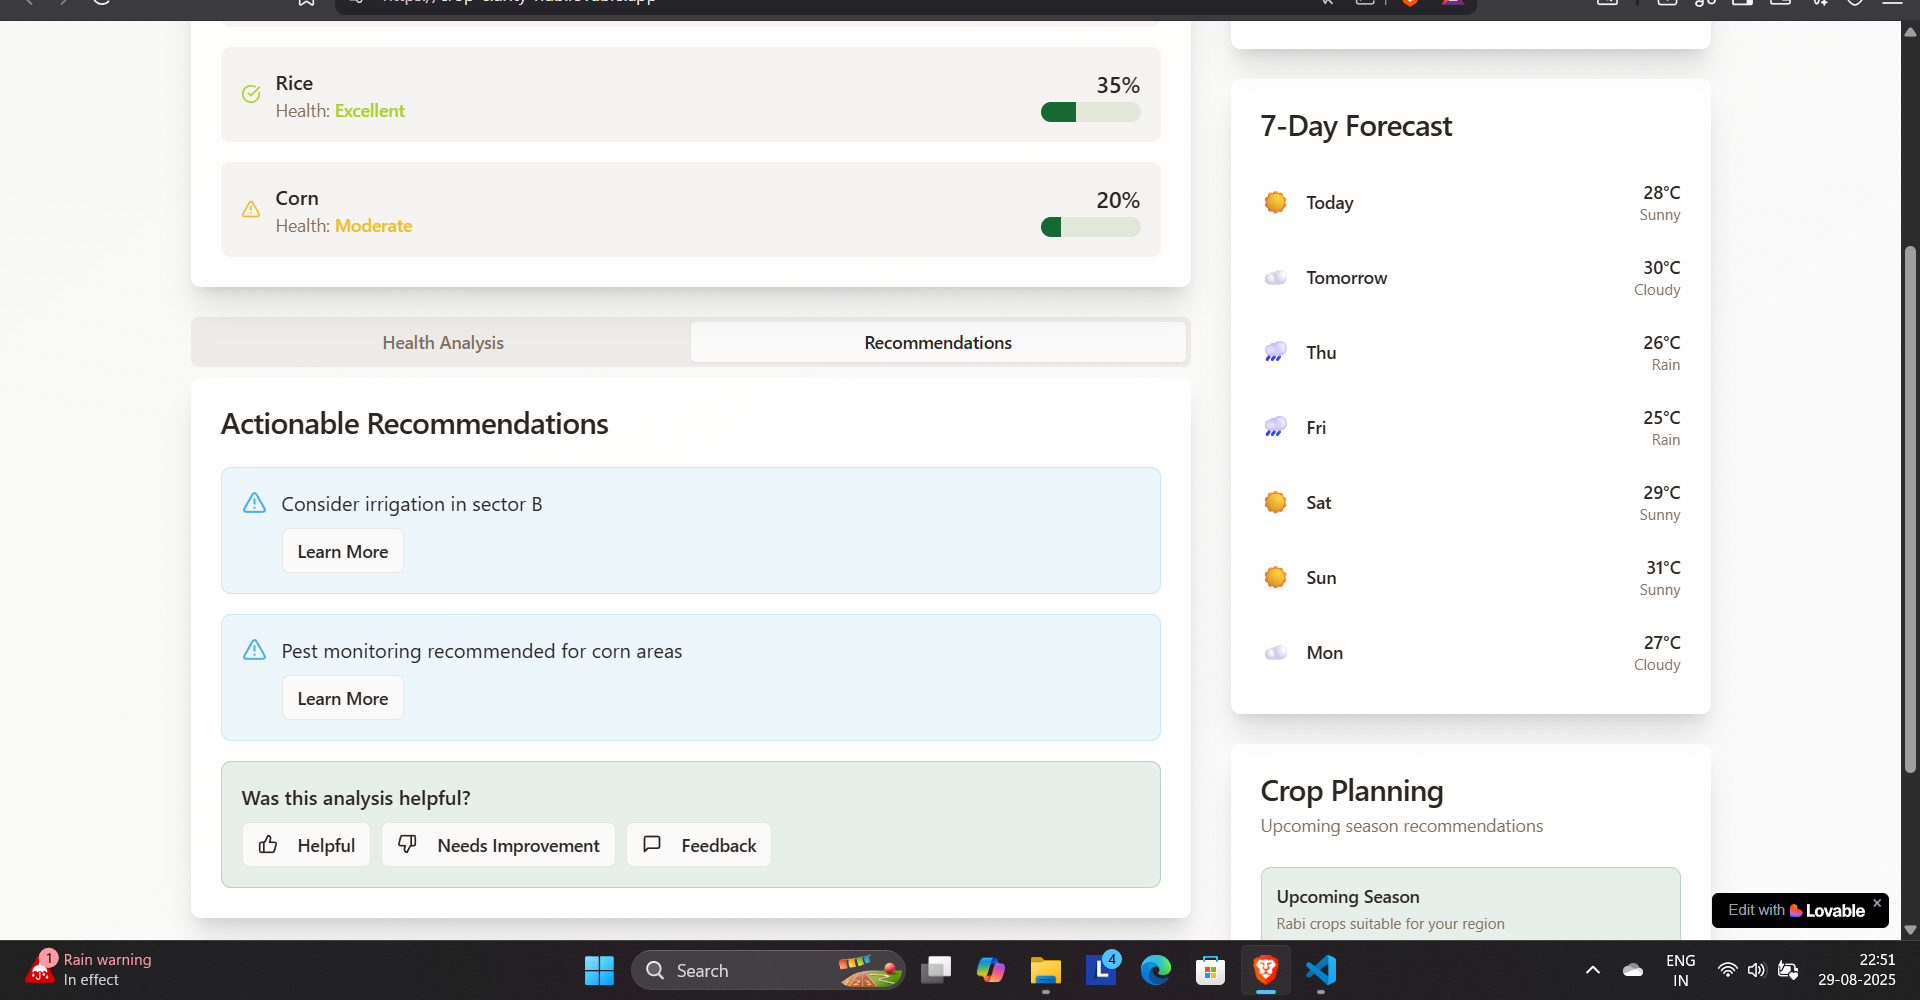
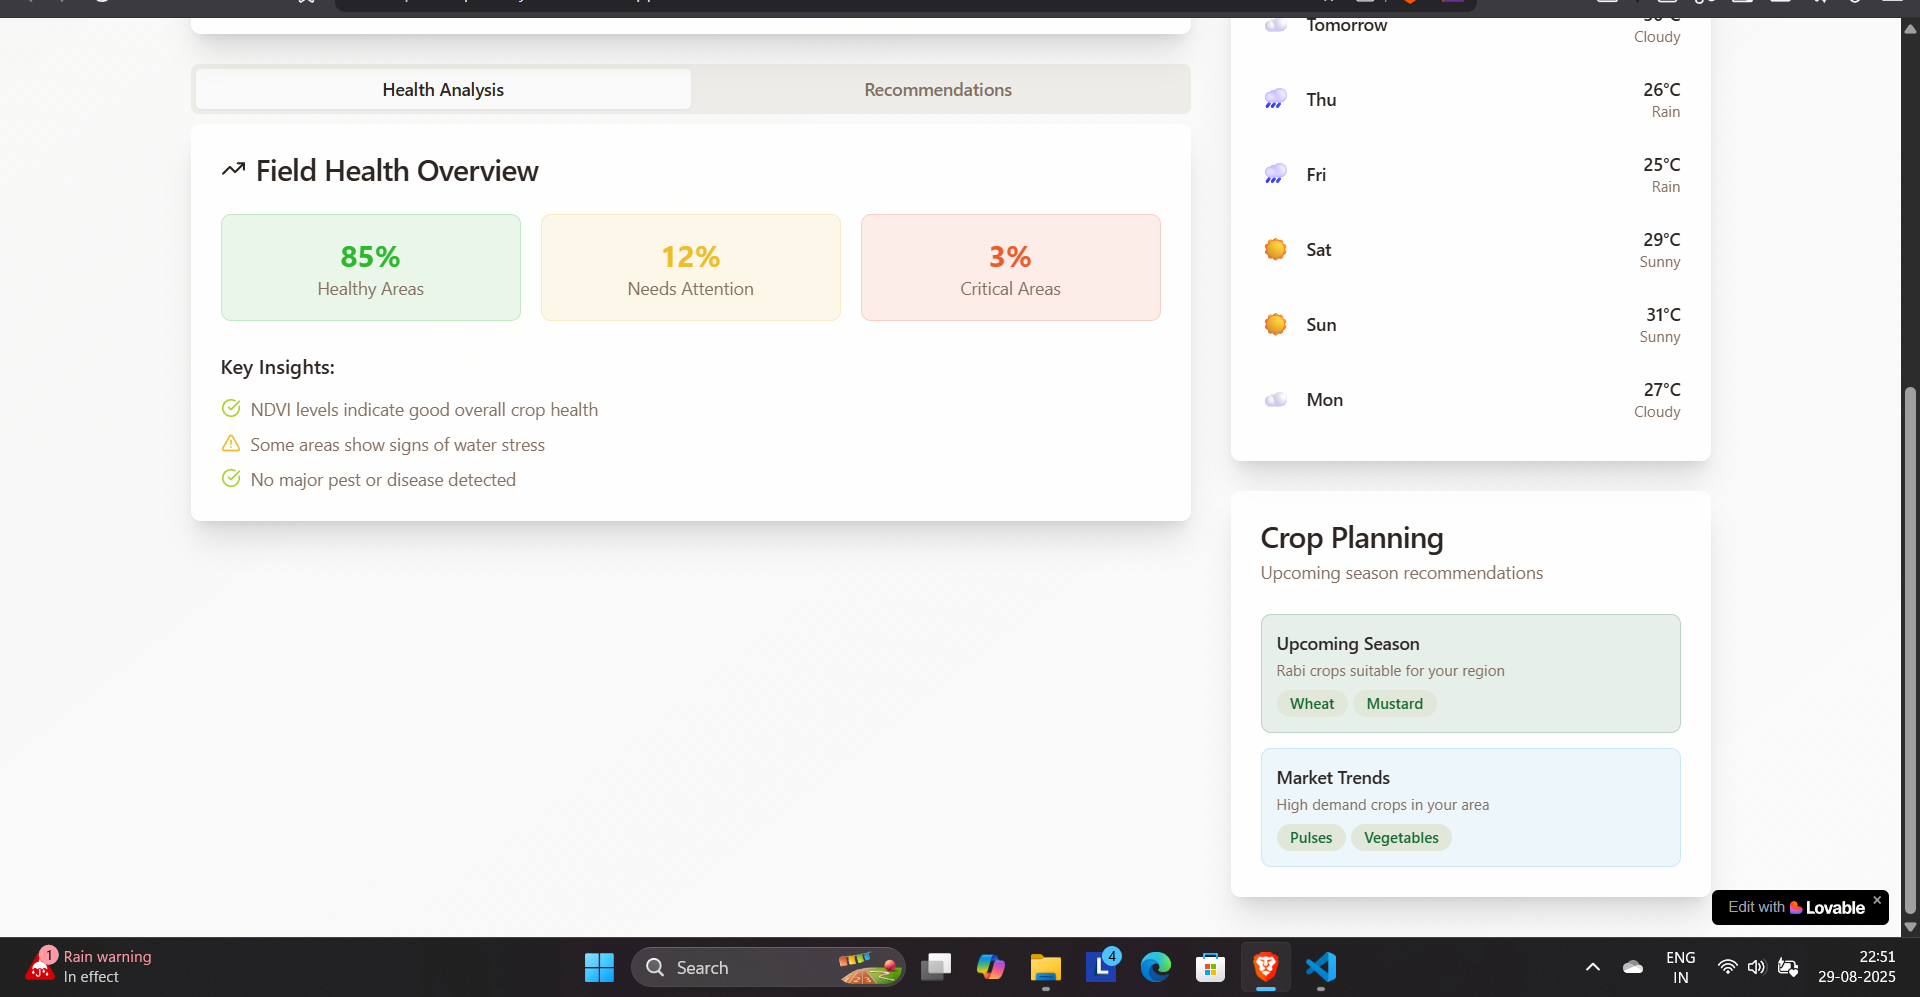
Analysis and Reporting: Once a field is selected, the application processes the area and presents a mock-up of an in-depth analysis, including crop types, health scores, and actionable recommendations. ....................................................................................................................................................................
Challenges We Faced Our biggest technical challenge was implementing the interactive field selection feature. We needed to allow users to draw a precise polygon on a satellite image, handle the coordinate data, and visually represent the selection in real-time. This required careful state management and a custom SVG overlay on top of the image component. We also had to manage the state flow between multiple application "pages" without a traditional routing library, which we handled by implementing a state machine within our main App component.
Another challenge was working with the mock data for the crop analysis. We had to design a data structure that was realistic and comprehensive enough to demonstrate the full potential of a real-world implementation. This involved defining mock health metrics, crop types, and recommendations, and then building the UI to display them effectively ............................................................................................................................
Our key accomplishments for CropVision are:
Responsive User Interface: We successfully built a modern, responsive user interface using React, TypeScript, and Tailwind CSS with shadcn/ui components. The UI is clean, intuitive, and provides a clear user journey from login to analysis.
Interactive Field Selection: We developed a core feature that allows users to select a specific agricultural field by either drawing a polygon on a satellite image or entering GPS coordinates. This feature is critical for providing a personalized analysis.
Structured Project Architecture: The project has a well-defined structure with clear separation of concerns, including a state machine for managing the application's different views (login, dashboard, satellite, analysis) in the Index.tsx file.
Comprehensive Analysis Mockup: We designed a detailed mockup for the crop analysis results, showcasing key metrics like crop composition, health scores, and actionable recommendations. This demonstrates the project's potential and vision for helping farmers.
Efficient Development Workflow: We utilized modern tools like Vite and a well-configured eslint with typescript-eslint to ensure a fast and type-safe development process. .................................................................................................................................................
What We Learned This hackathon was a great opportunity to deepen our skills in building interactive, data-driven applications. We learned a lot about advanced React patterns, especially in managing complex UI state. We also gained significant experience in front-end development, specifically in how to create a polished and responsive design using Tailwind CSS and shadcn/ui. The project taught us the importance of thinking through the entire user journey, from initial login to the final data presentation, and how to structure a project to support this flow. .............................................................................................................................................................................
Based on the current state of the CropVision project, here are several potential next steps and areas for development, ranging from immediate improvements to more advanced features.
Immediate Next Steps (Backend & Data) Integrate with a real data source: The current project uses mock data for crop analysis and weather. The most crucial next step is to replace this with real data from a satellite imagery provider (e.g., a service that provides NDVI data) and a weather API.
Implement a robust backend: The application currently relies on a client-side state machine. A backend is needed to handle user authentication, store user-specific farm data, process image analysis requests, and manage API keys securely.
Add real-time data fetching: Update the application to fetch real-time satellite imagery for the user's selected location, rather than relying on a static placeholder image.
Feature Enhancements Interactive Charts and Historical Data: The CropAnalysis.tsx component shows key insights but could be enhanced with a real charting library to visualize trends over time. This would allow farmers to see how crop health has changed throughout a season.
Advanced Crop Recommendations: Use a machine learning model on the backend to provide more personalized and detailed recommendations based on the detected crop, historical data, and current weather conditions.
Pest and Disease Detection: The current analysis includes a mock pest alert. A more advanced version could use computer vision to identify specific types of pests or signs of disease from high-resolution drone or satellite imagery.
Farm Management Tools: Expand beyond just analysis. Introduce features for farmers to plan their planting seasons, log activities like irrigation and fertilization, and set up custom alerts for their fields.
User Experience & Design Improvements Refine the User Flow: The user flow between login, dashboard, and analysis is currently managed by a simple state in Index.tsx. A more robust routing system would improve navigation.
Mobile-First Design: While the app seems to have some mobile considerations (e.g., useIsMobile hook), a full mobile-first design pass would be beneficial. This could include using mobile-friendly components like Drawer for navigation.
User Feedback Loop: The CropAnalysis.tsx file includes a feedback section. This feature could be made functional to collect user input and improve the recommendation models over time.
Localization: To reach a wider audience of farmers, the application should support multiple languages.
Built With
- css
- javascript
- react
- react-hook-form
- react-router-dom
- shadcn/ui
- tailwind
- typescript
- vite

Log in or sign up for Devpost to join the conversation.