-
-
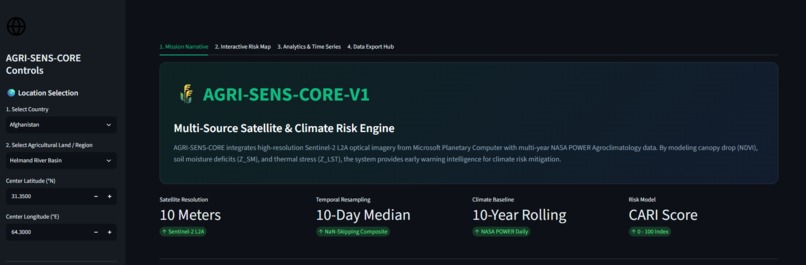
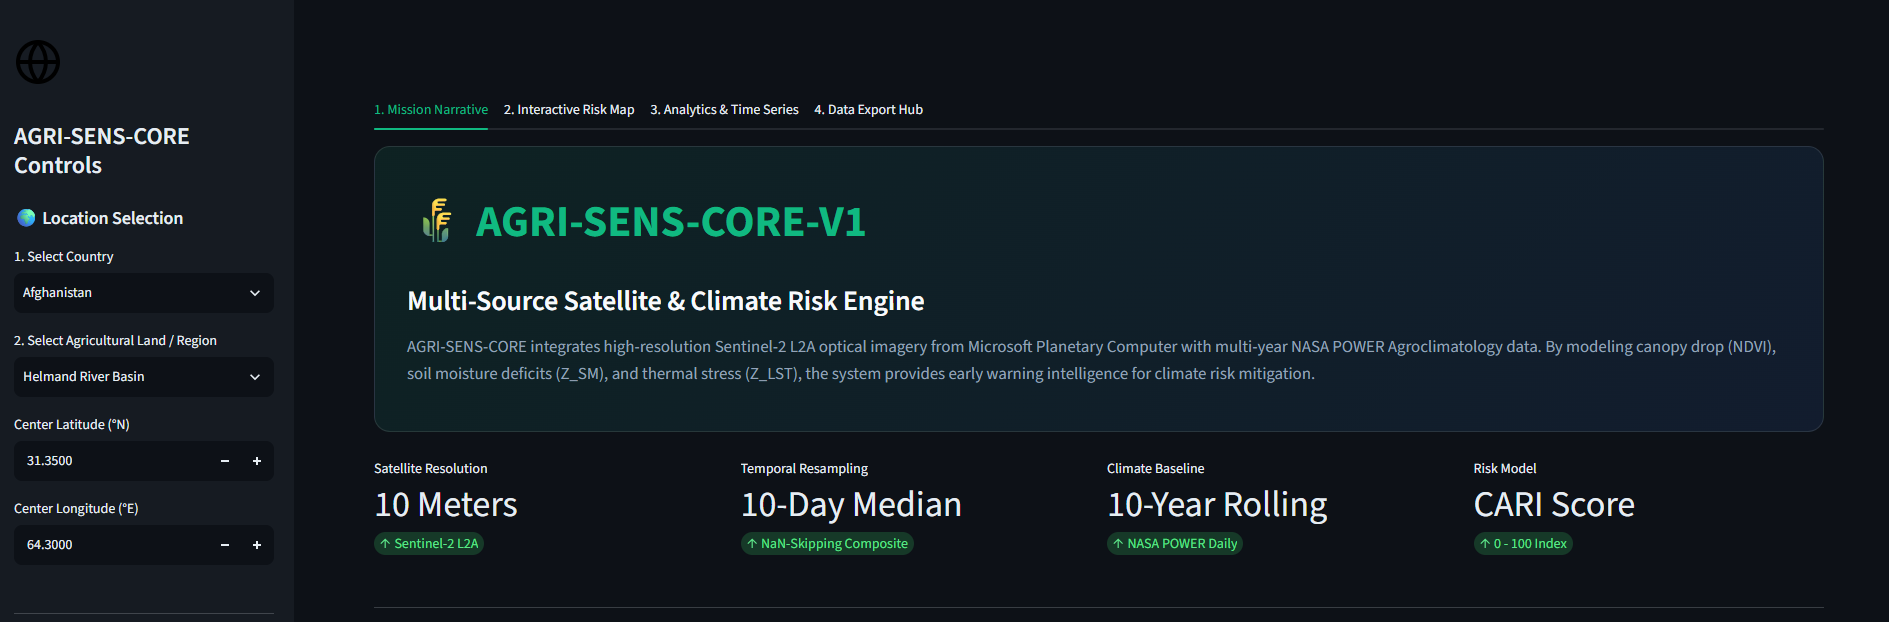
AGRI-SENS-CORE platform homepage featuring target region controls and multi-source satellite data resolution settings.
-
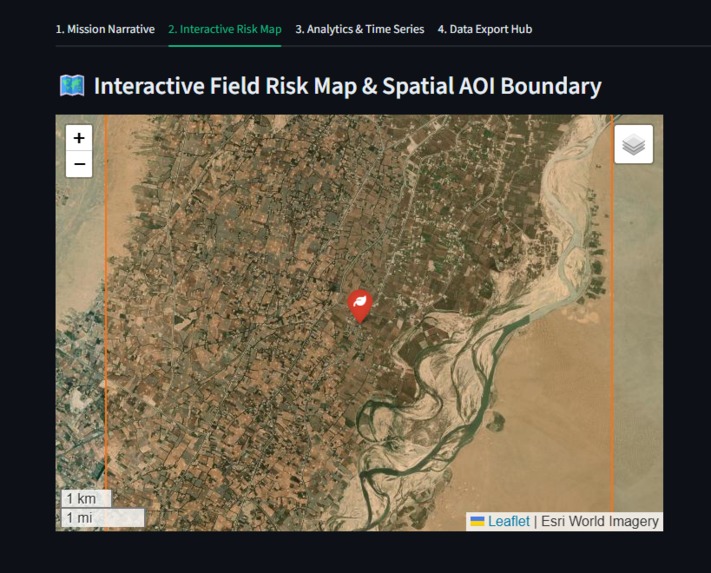
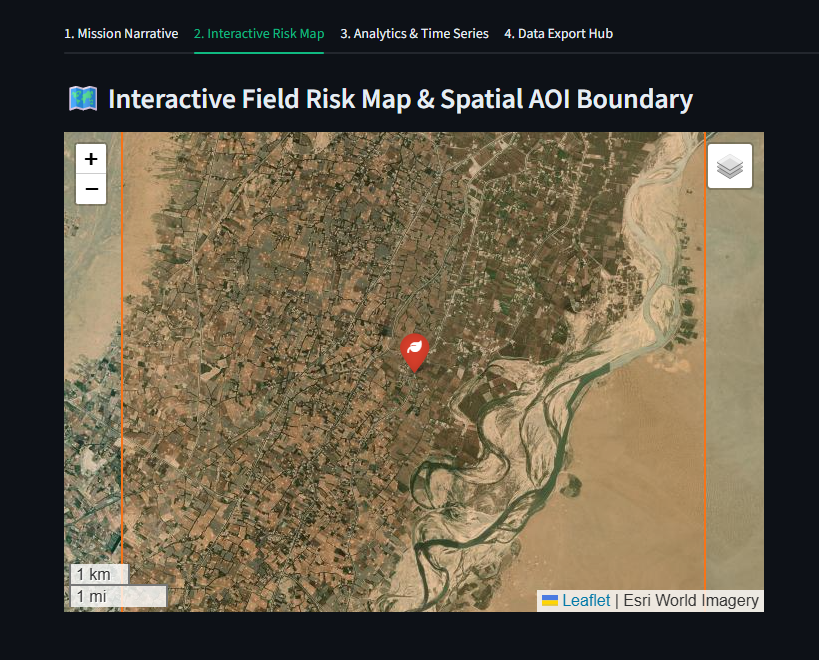
High-resolution interactive field map displaying spatial AOI boundaries overlaid on Esri World Imagery.
-
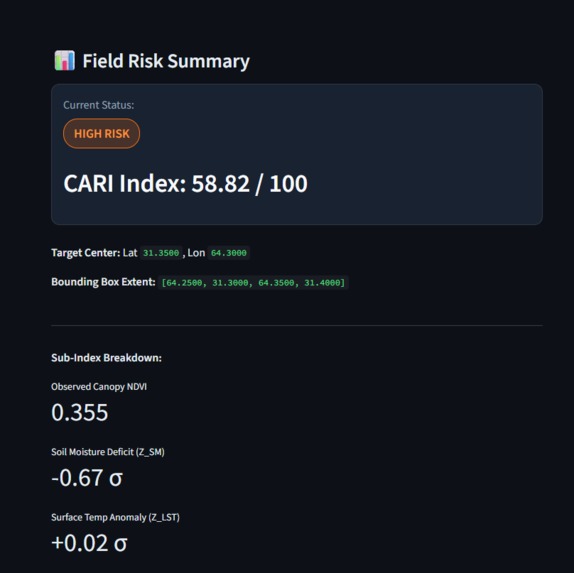
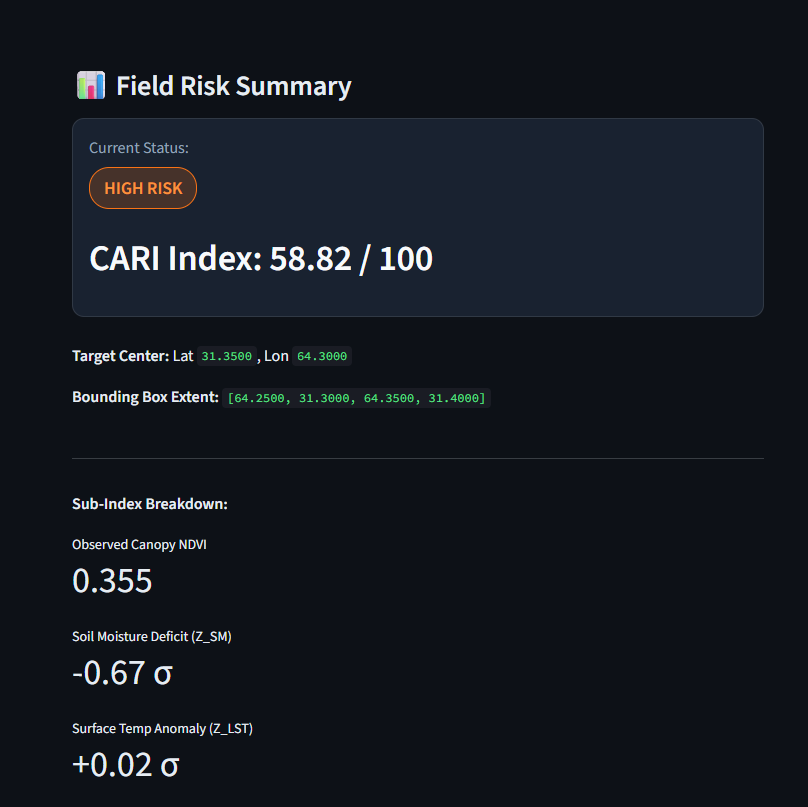
Real-time field risk summary panel displaying calculated CARI index scores and sub-index metrics.
-
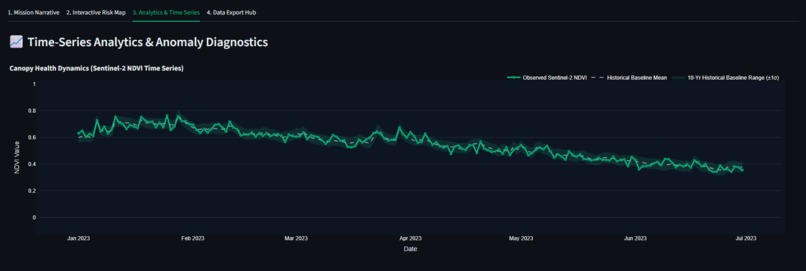
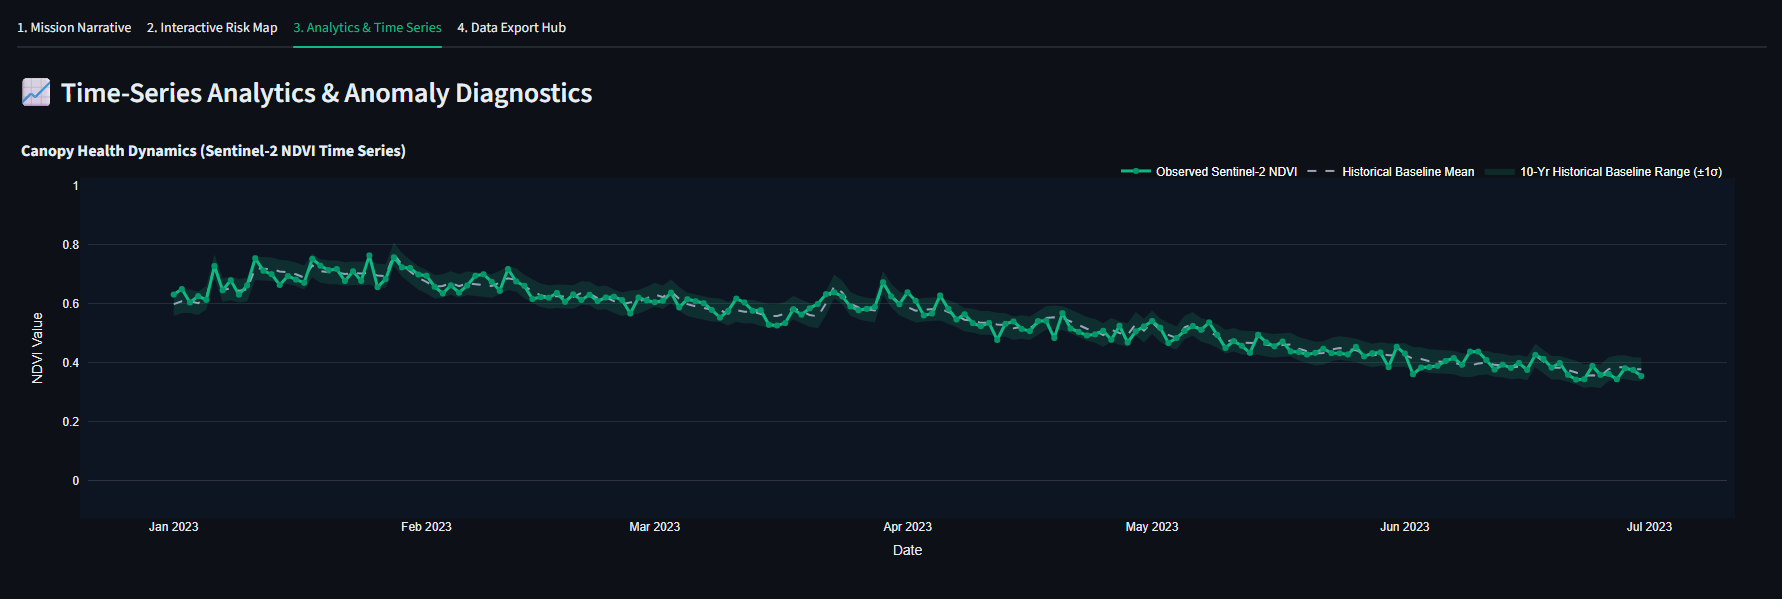
Sentinel-2 NDVI time-series chart tracking canopy health dynamics over the user-selected date range against historical baseline averages.
-
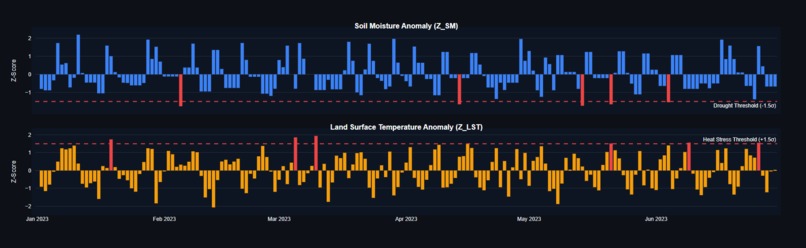
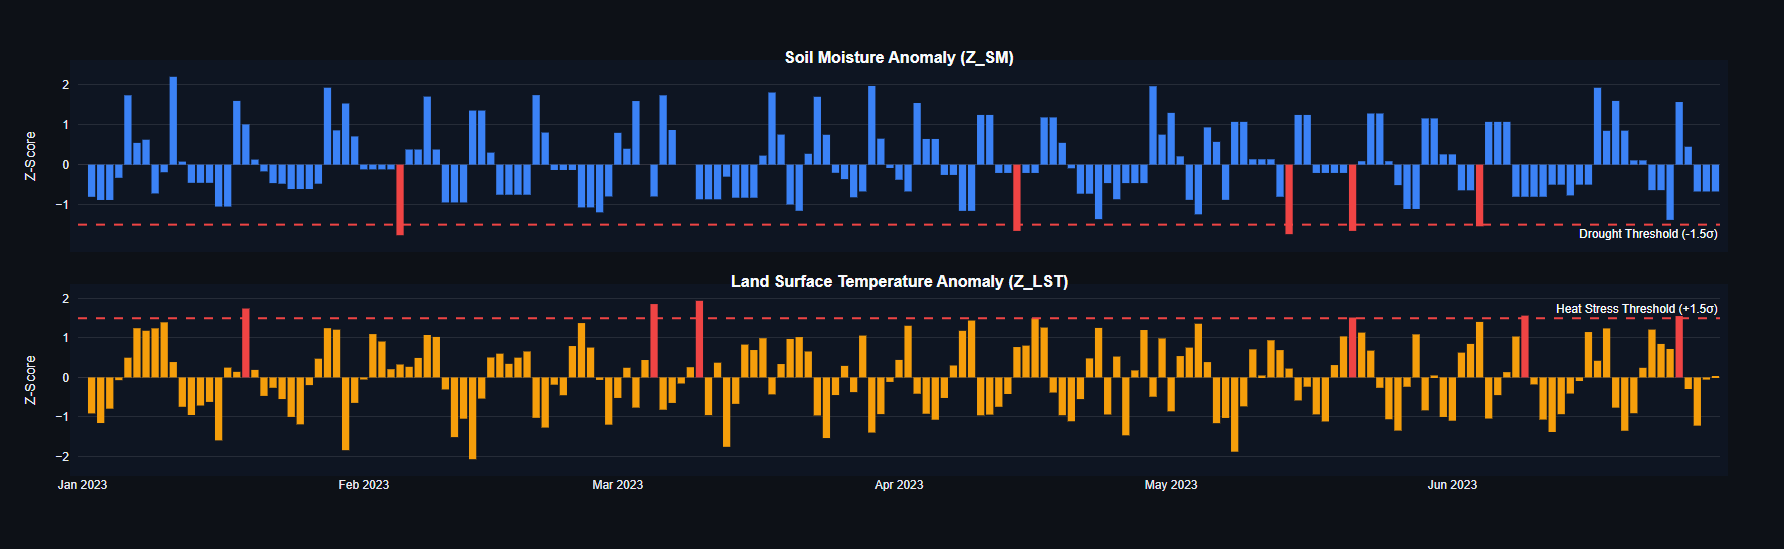
Soil moisture and land surface temperature anomaly z-score diagnostic charts highlighting stress thresholds.
-
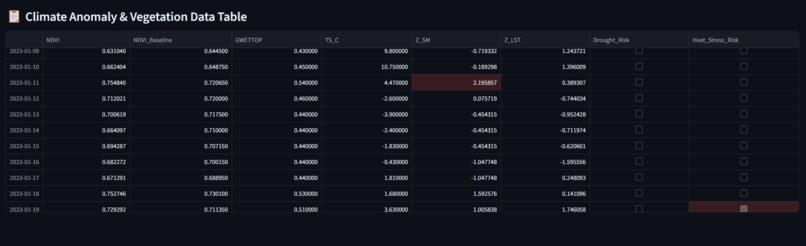
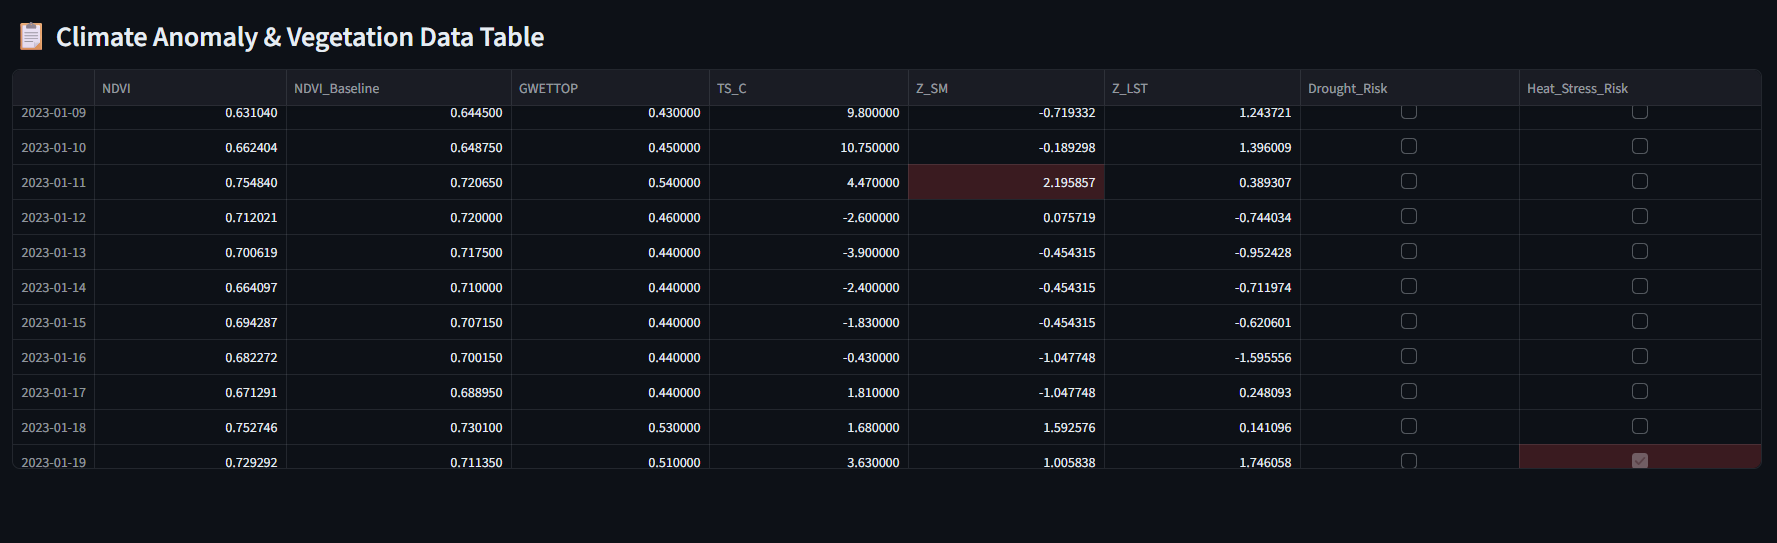
Detailed climate anomaly and vegetation tabular view flagging drought and heat stress risks.
-
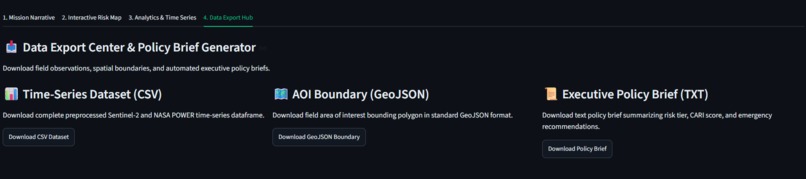
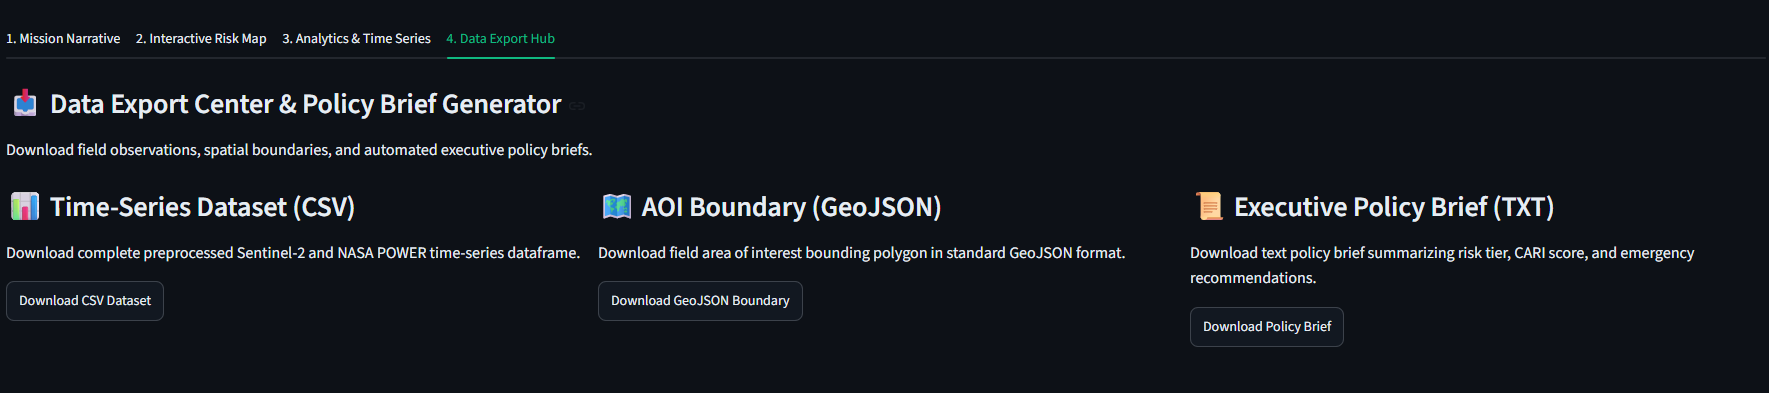
Data export hub enabling downloads of time-series datasets (CSV), spatial boundaries (GeoJSON), and automated policy briefs.
-
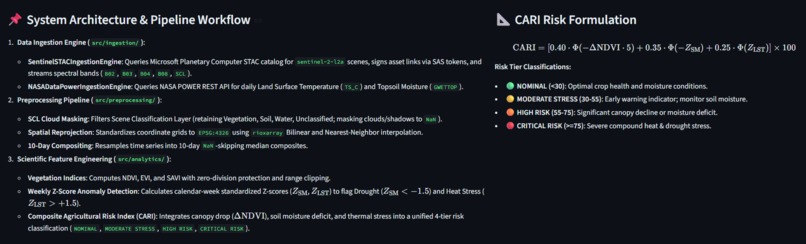
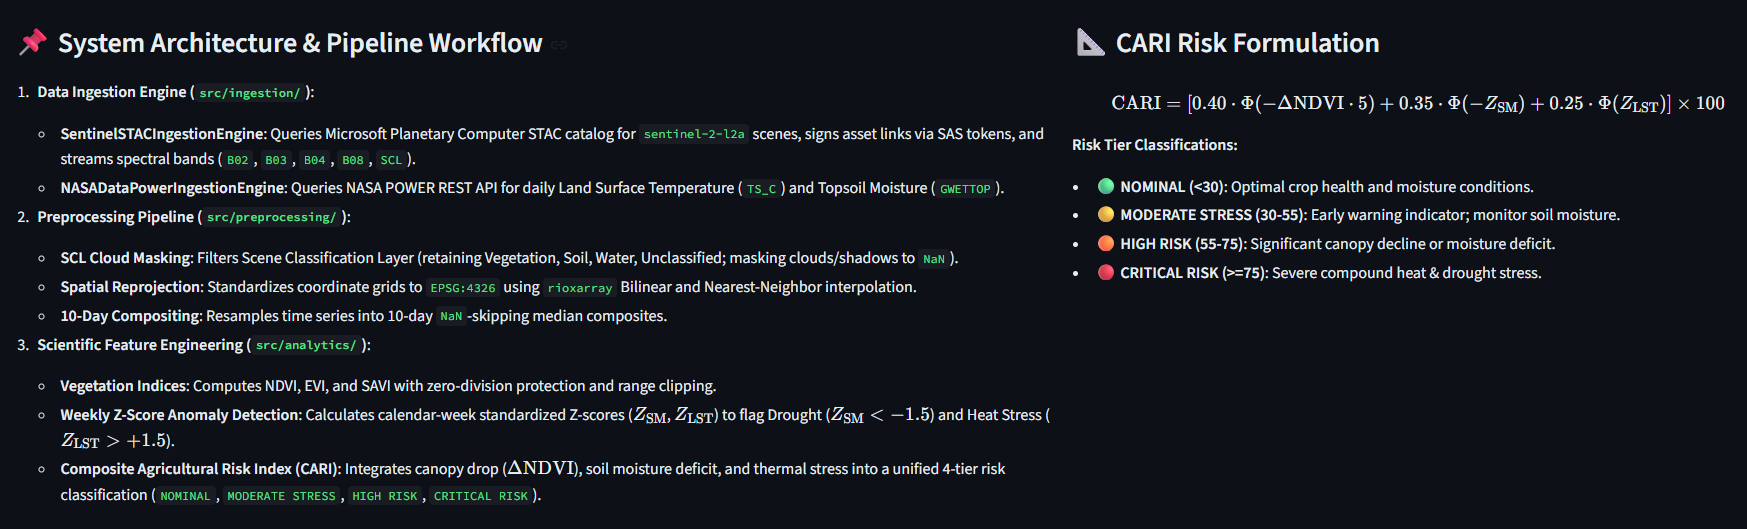
System architecture documentation showing the end-to-end data ingestion, preprocessing pipeline, and CARI risk mathematical formulation.
-
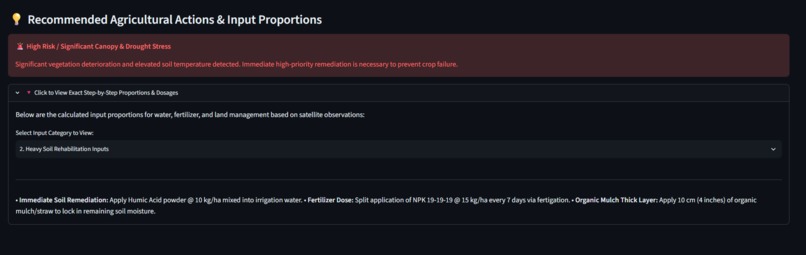
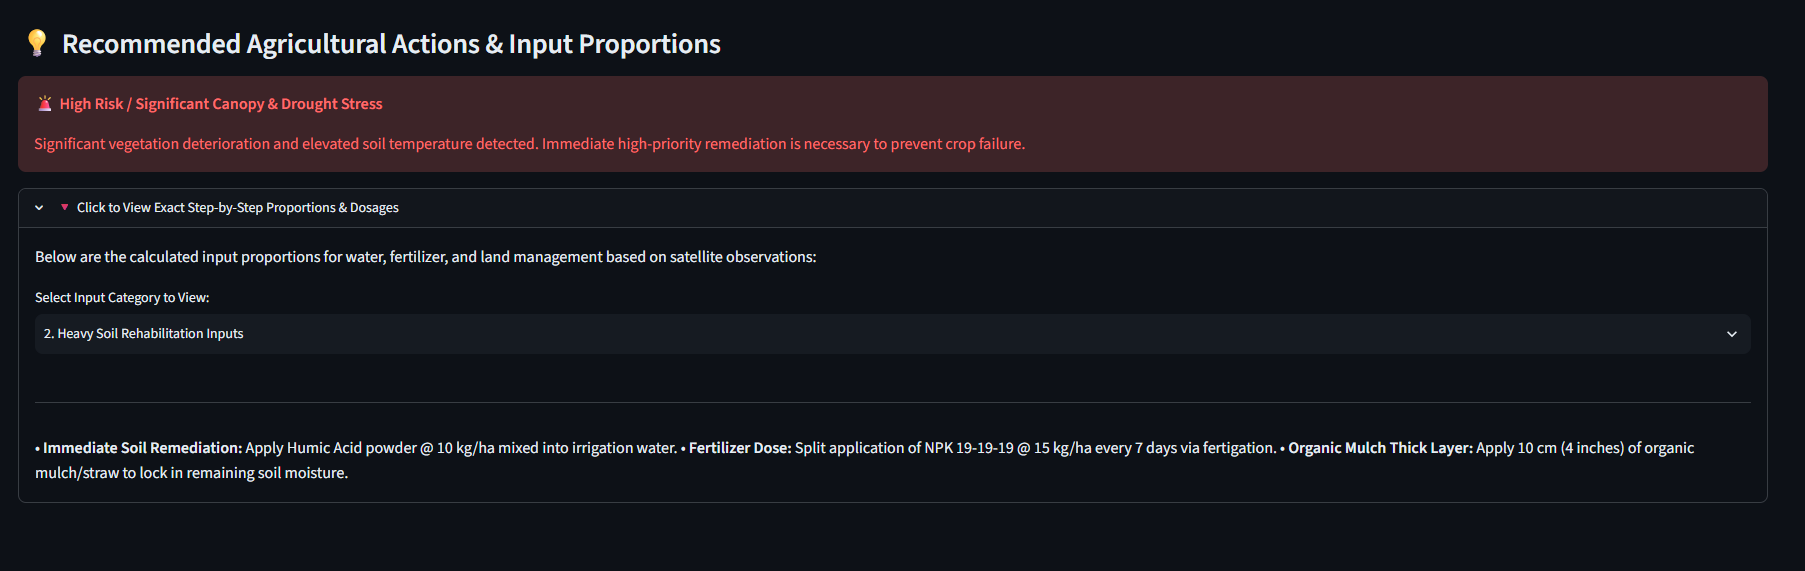
Actionable remediation panel providing specific, calculated fertilizer and soil input proportions for high-risk fields.
-
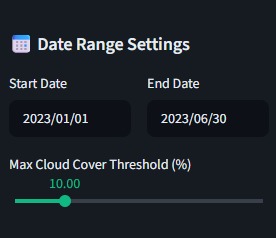
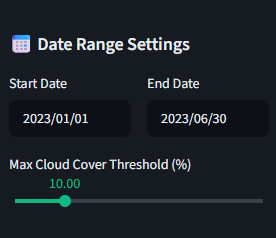
Date Range Settings panel allowing users to configure custom start and end dates along with satellite cloud cover percentage thresholds.
Inspiration
A lot of small-scale farmers still have to rely on guesswork when it comes to soil nutrients, crop selection, or diagnosing plant diseases. Catching an infection or planting the wrong crop for a specific soil type can wipe out a season's income. I created AgriSens to give farmers a simple, AI-powered toolkit that turns complex agricultural and environmental data into actionable advice they can trust.
What it does
AgriSens gives users a clear view of field conditions using satellite data and automated calculations:
Vegetation Health Tracking (NDVI): Processes multi-spectral satellite imagery to monitor crop canopy health and density over time using Normalized Difference Vegetation Index (NDVI) calculations.
Thermal & Environmental Anomaly Detection: Analyzes thermal band feeds and climate variables to spot sudden moisture stress, micro-climate changes, or land degradation early.
Interactive Visualization Dashboard: Translates complex geospatial raster files and remote sensing indices into intuitive visual maps, time-series graphs, and actionable reports.
How I built it
I built AgriSens using a custom Python pipeline for remote sensing and geospatial data: Geospatial Processing: Wrote scripts using Python geospatial libraries to process multi-spectral satellite imagery, extract band values, and run index calculations like NDVI. Data Processing: Used Pandas and NumPy to structure multi-dimensional raster arrays, run anomaly detection logic, and clean up time-series data. Dashboard: Built a fast web interface with Streamlit (supported by a FastAPI backend) to render field maps and performance charts smoothly
Challenges I ran into
Working with satellite raster files was brutal on memory. Loading high-resolution imagery caused major performance lag on the web dashboard early on, so I had to restructure how I process and slice raster layers before rendering. Fine-tuning the anomaly detection logic was also tricky—I had to make sure normal seasonal shifts in vegetation weren't incorrectly flagged as crop stress.
Accomplishments that I'm proud of
I built a fully functional processing pipeline from scratch that converts complex satellite raster files into clear visual maps and automated crop health metrics.
What I learned
Building AgriSens taught me how to work with geospatial datasets, perform multi-spectral band math, and handle memory-heavy files in Python. I got much better at optimizing data processing pipelines and creating intuitive dashboards for complex scientific data.
What's next for AgriSens
I plan to connect AgriSens directly to Sentinel and Landsat APIs to pull new satellite imagery automatically and train predictive machine learning models for yield forecasting.
Built With
- data
- fastapi
- geospatial-data
- machine-learning
- ndvi
- numpy
- pandas
- python
- remote-sensing
- streamlit

Log in or sign up for Devpost to join the conversation.