🏆 Built for DreamHacks 2026
🌍 The Harvest Ledger
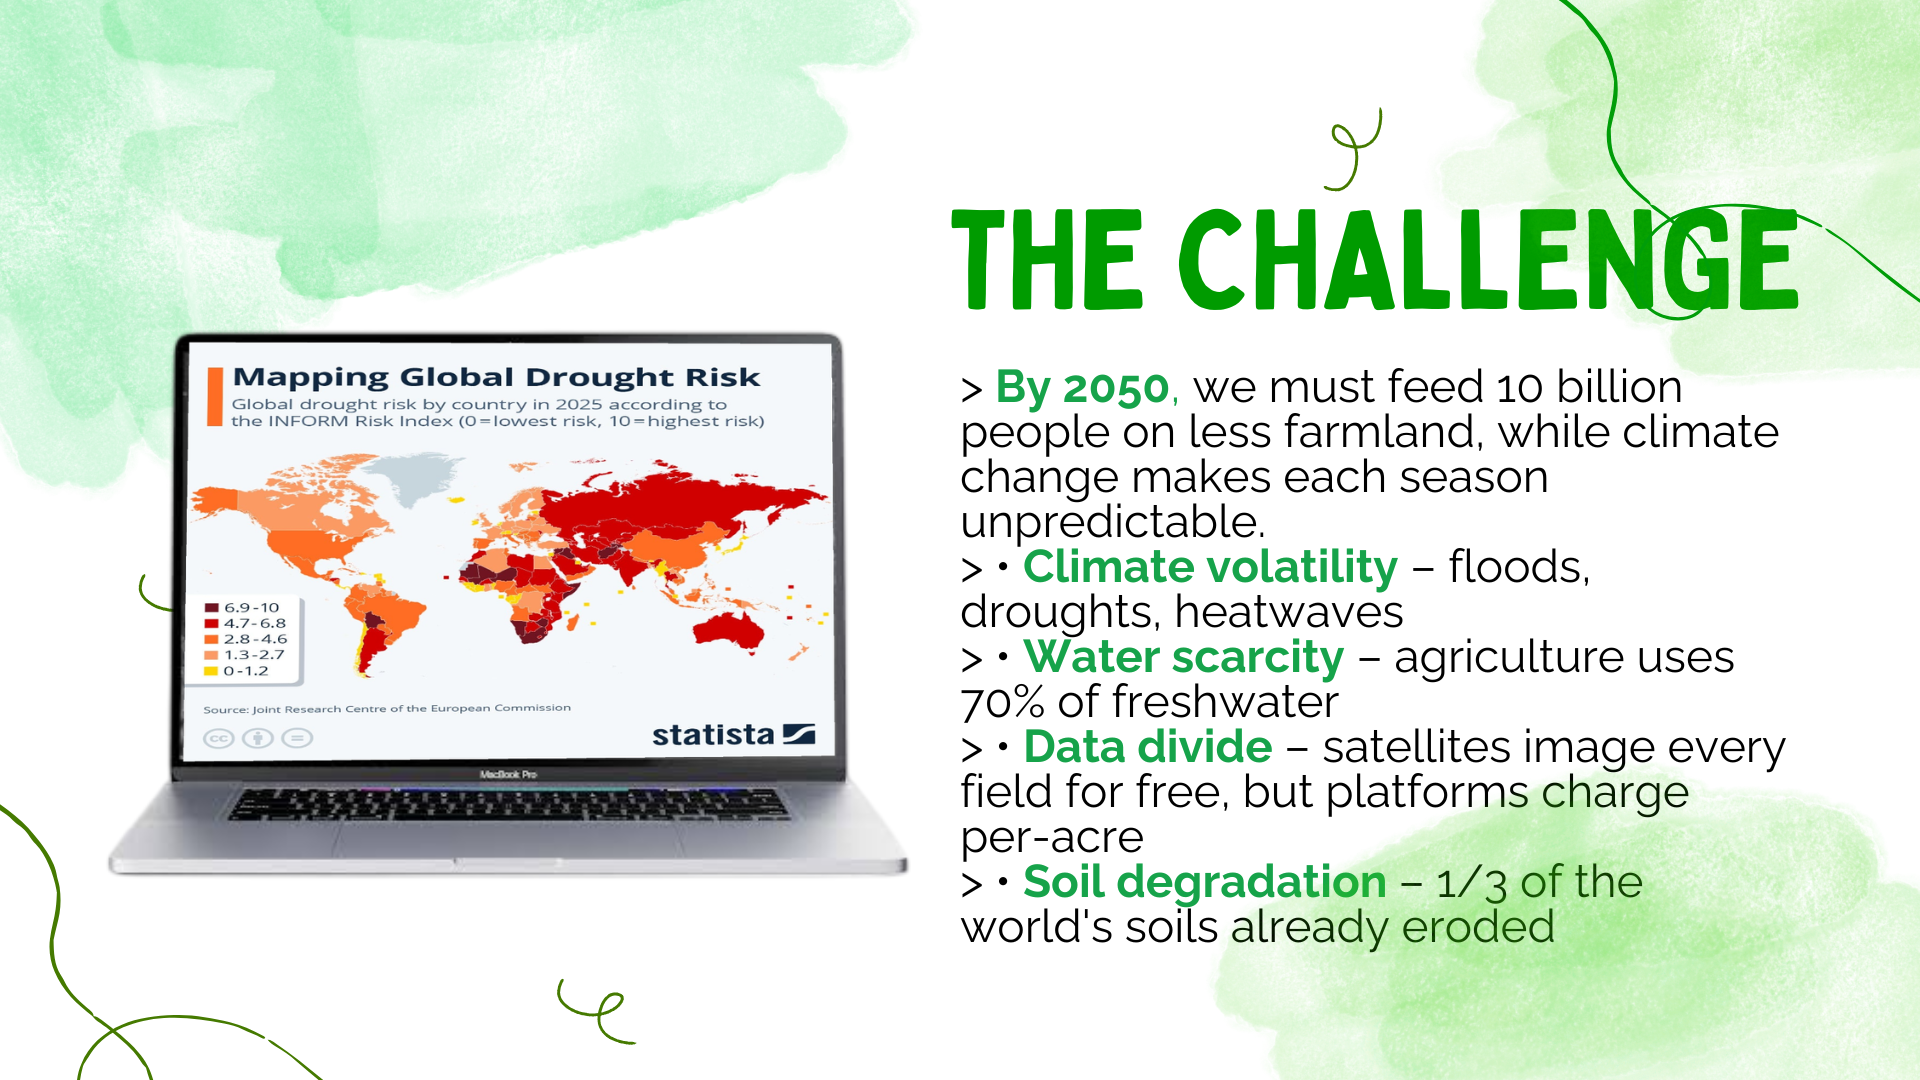
By 2050, the world must feed ~10 billion people — on the same farmland, in a destabilizing climate. The data to do it falls from the sky every five days. We refuse to let it expire unread.
AgriPulse is real-time planetary monitoring for next-gen farming: open-source crop intelligence that fuses satellite imagery, weather, and soil into explainable, actionable insight for every field on Earth. Free forever. Self-hostable. MIT licensed.
Repository: https://github.com/robloxsagax-web/AgriPulse · Demo video: https://youtu.be/1RWzJamAJI0
🚨 The 2050 Problem
We don't get to shrug off this number. Feeding 10 billion people is the assignment of this generation — and the arithmetic says we're losing time.
| The hard number | What it really costs |
|---|---|
| 🌡️ More volatile seasons | Droughts, floods, heatwaves now arrive faster than farmers can react |
| 💧 ~70% of global freshwater to agriculture | Irrigation allocated largely without data — misallocated by design |
| 🛰️ Every field imaged every 5 days, free | Locked behind per-hectare analytics prices the smallholders — who produce one third of the world's food — can't pay |
| 🌱 One third of soils degraded | Yield and carbon bleed invisibly below our feet |
The divide is not data; it's access. Farmers can't buy the analytics layer that would turn free orbital imagery into decisions. That is the entire AgriPulse thesis: put the orbital pipeline in everyone's hands, frankly explainable.
🌉 The Bridge
AgriPulse is open-source public infrastructure for crop intelligence — end-to-end, explainable to the last pixel.
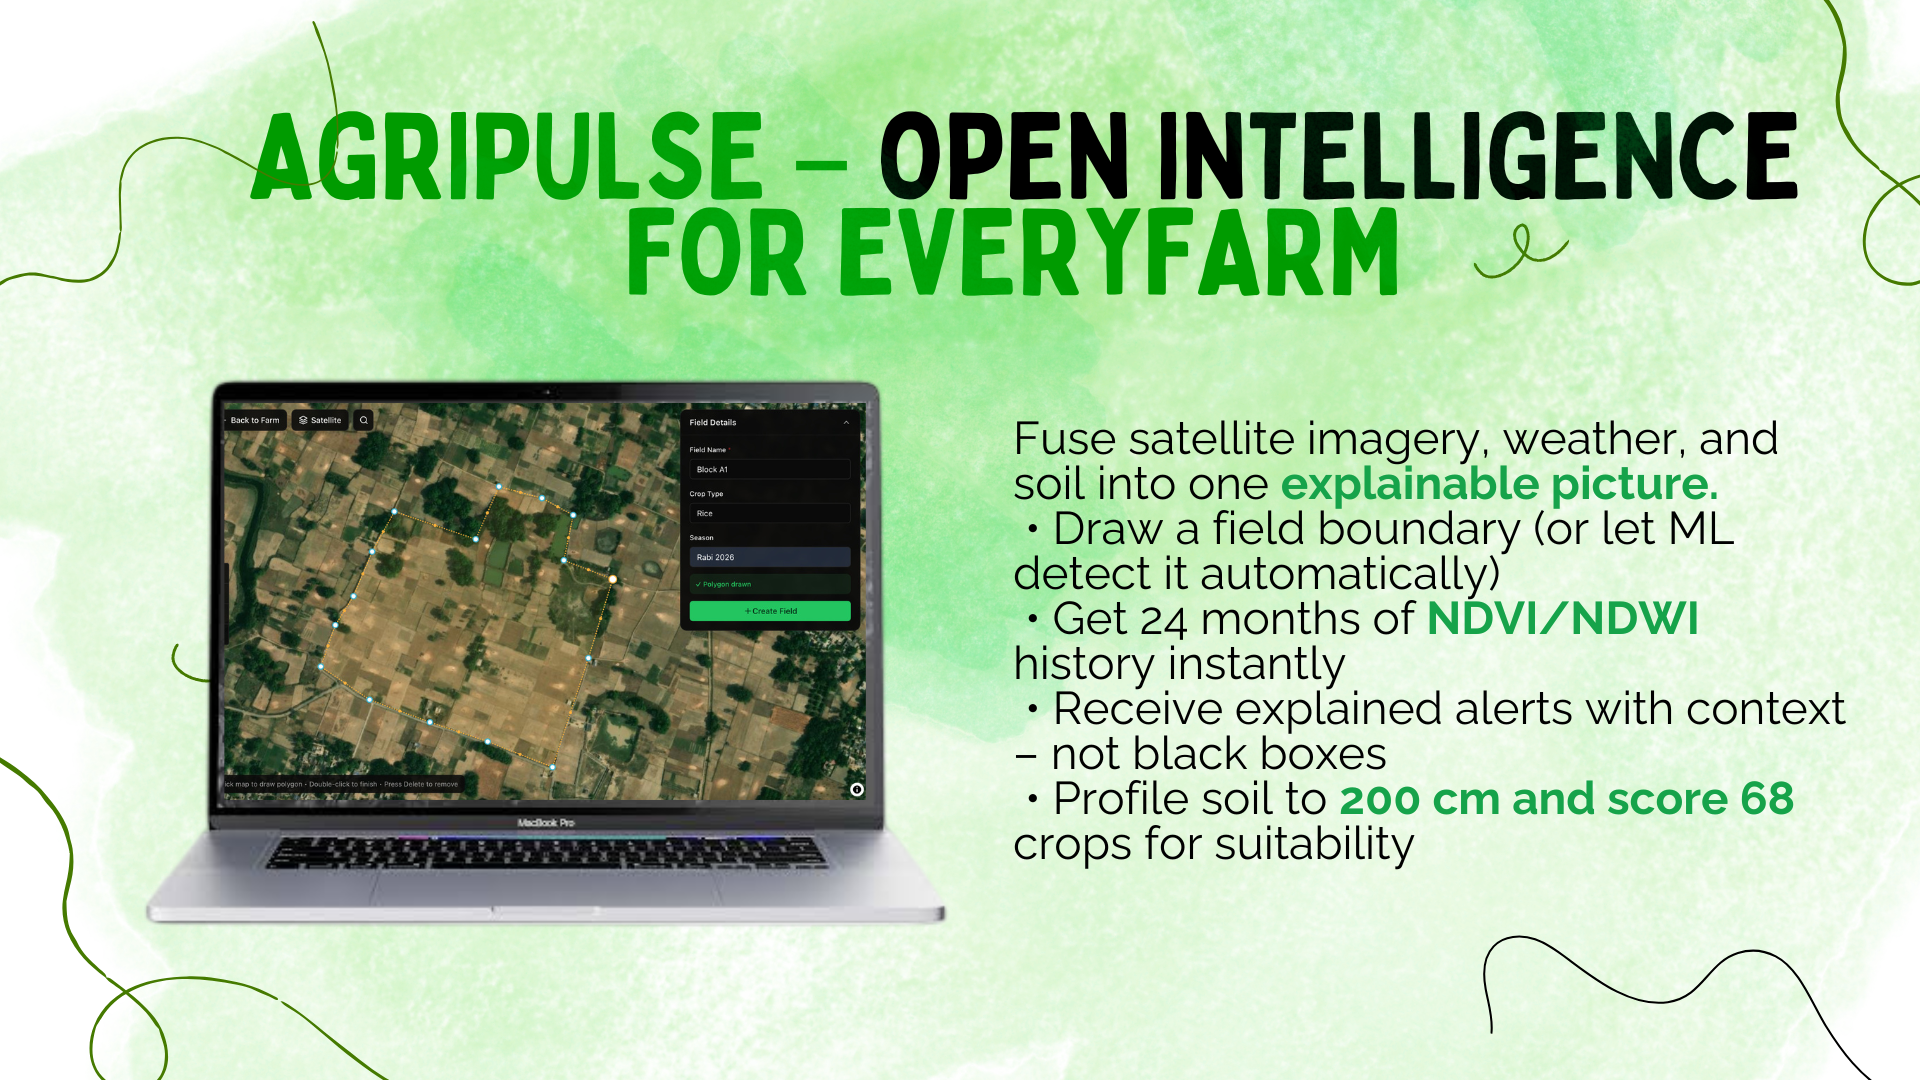
Draw a field boundary on a map (or let our ML model detect it — PyTorch on Fields of The World), and the platform delivers automatically:
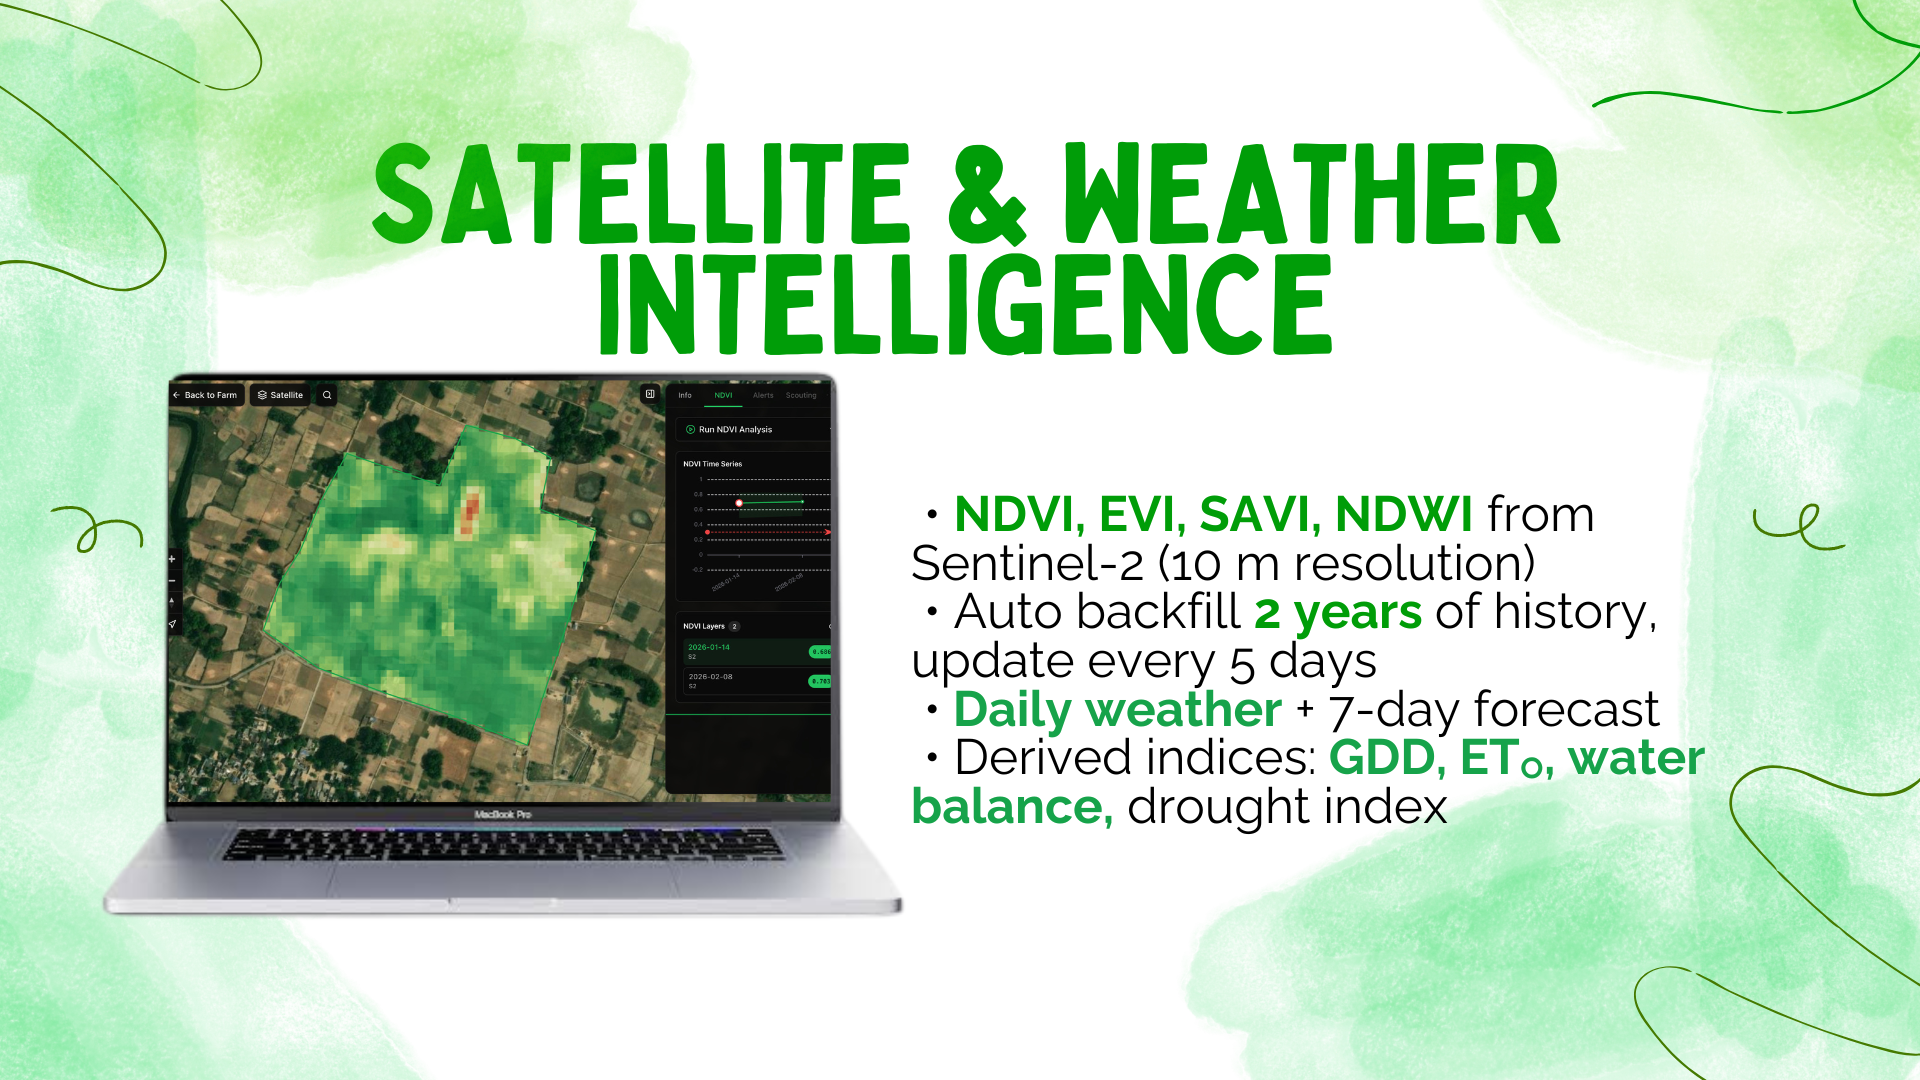
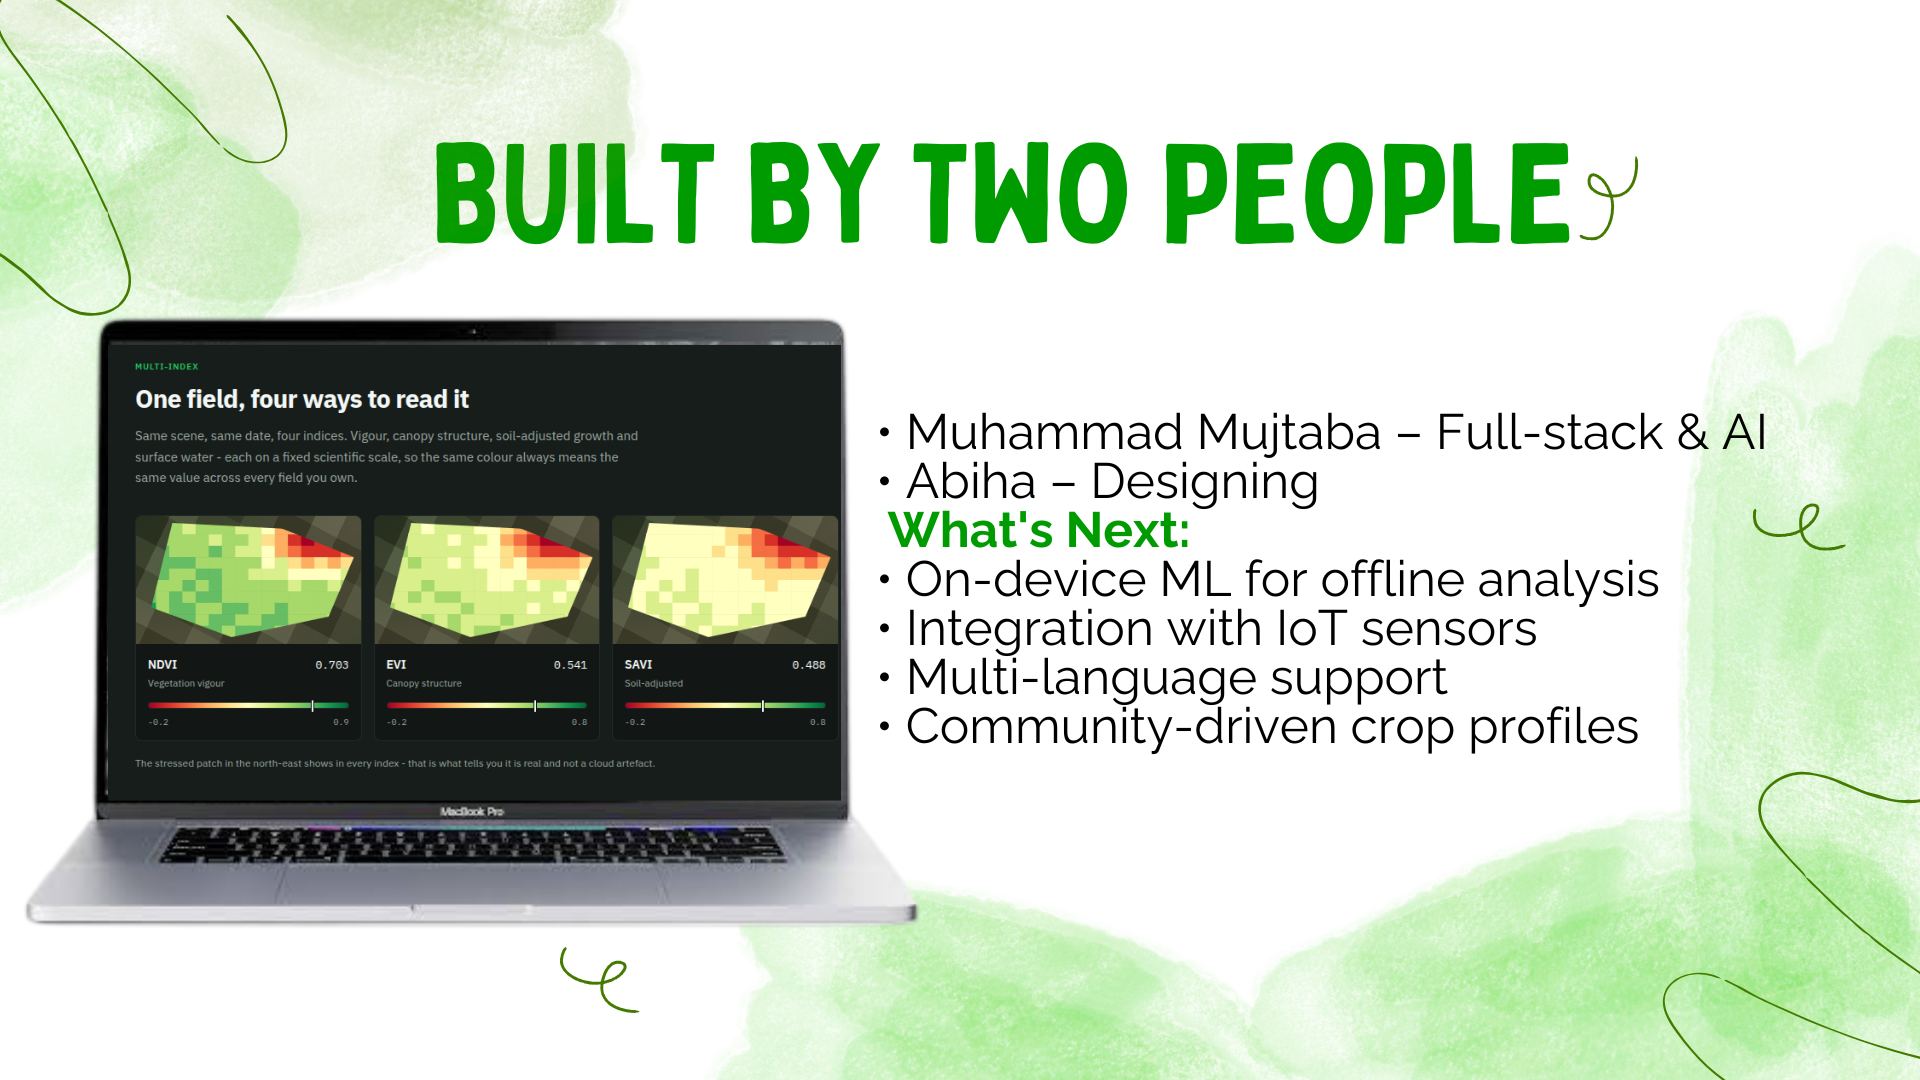
- ⏪ Backfills 24 months of vegetation history — NDVI, EVI, SAVI, NDWI from the public Sentinel-2 archive at 10 m
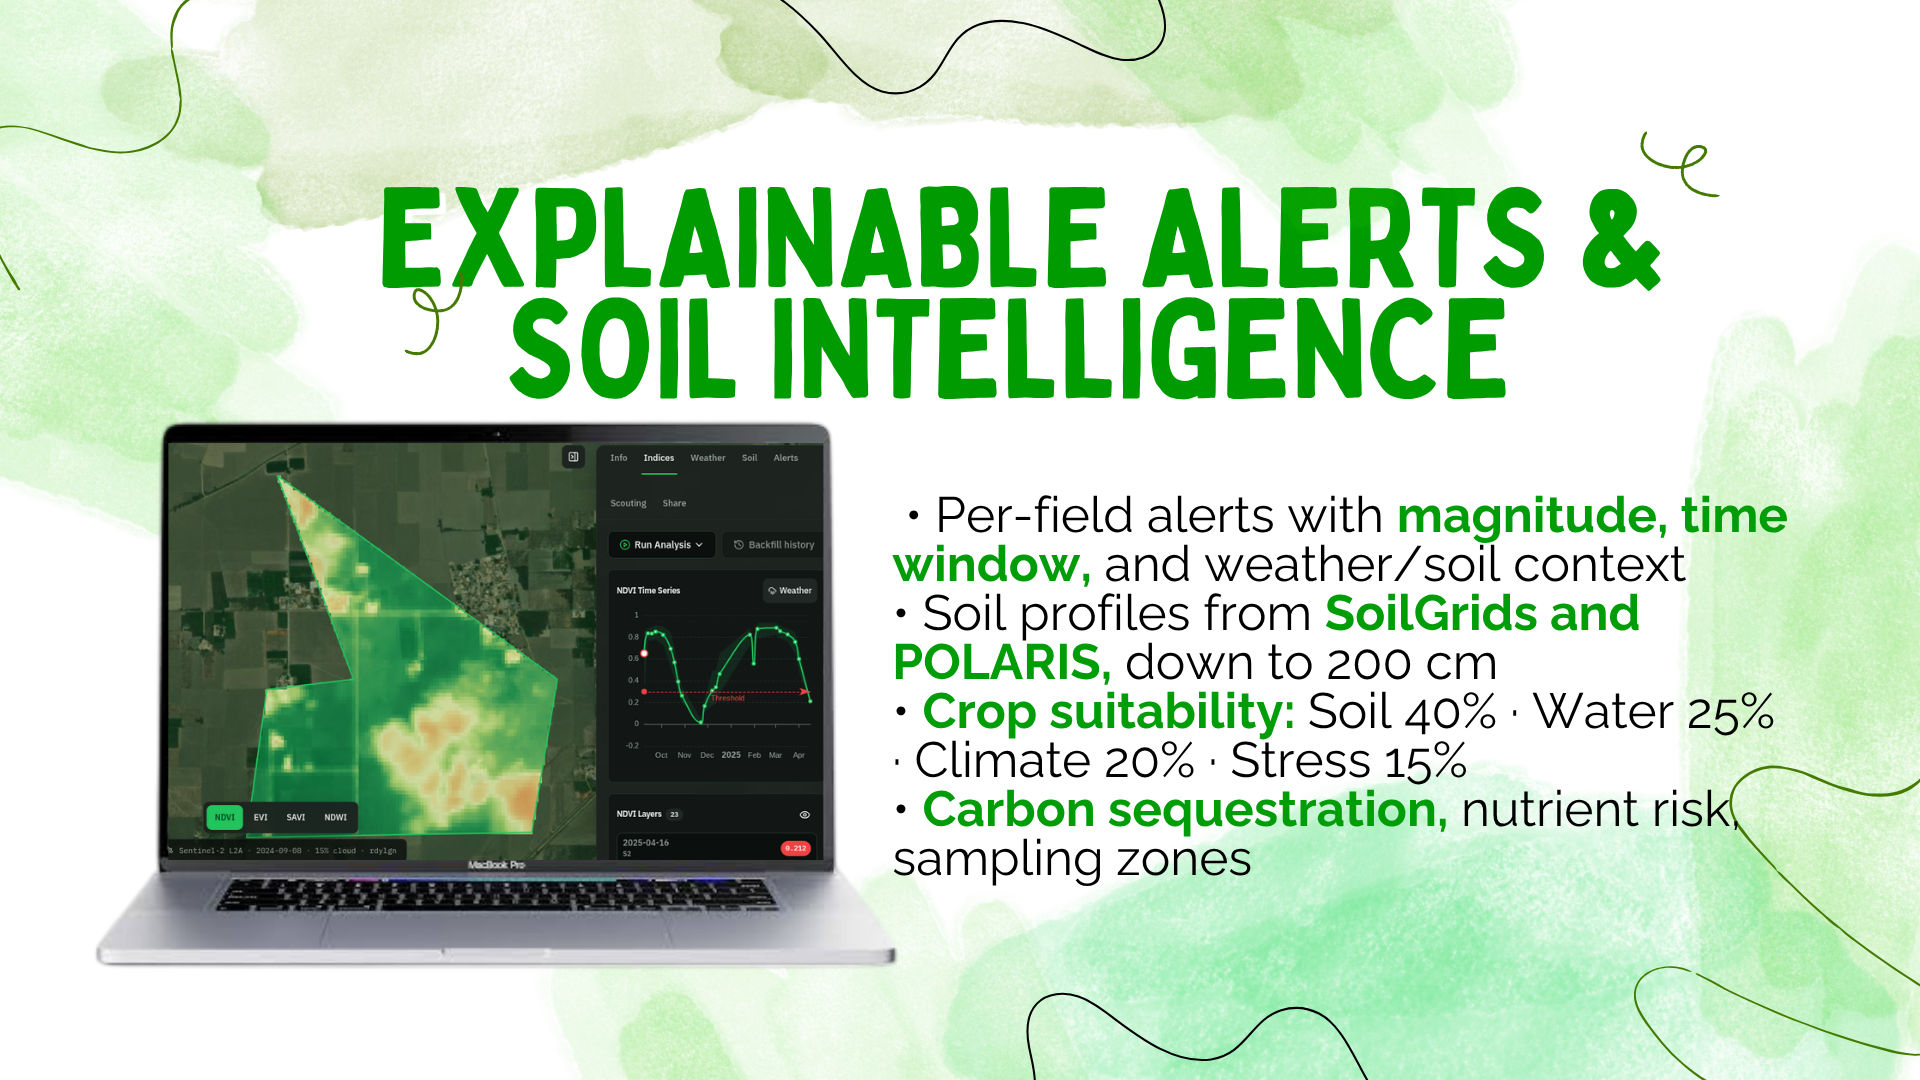
- 📡 Watches the field every 5 days and raises explained alerts — each anomaly ships with observation, magnitude, time window, and the weather + soil drivers behind it.
No black boxes - 🌱 Profiles soil to 200 cm (SoilGrids global / POLARIS US) and scores 68 crops for suitability with a transparent 4-pillar model
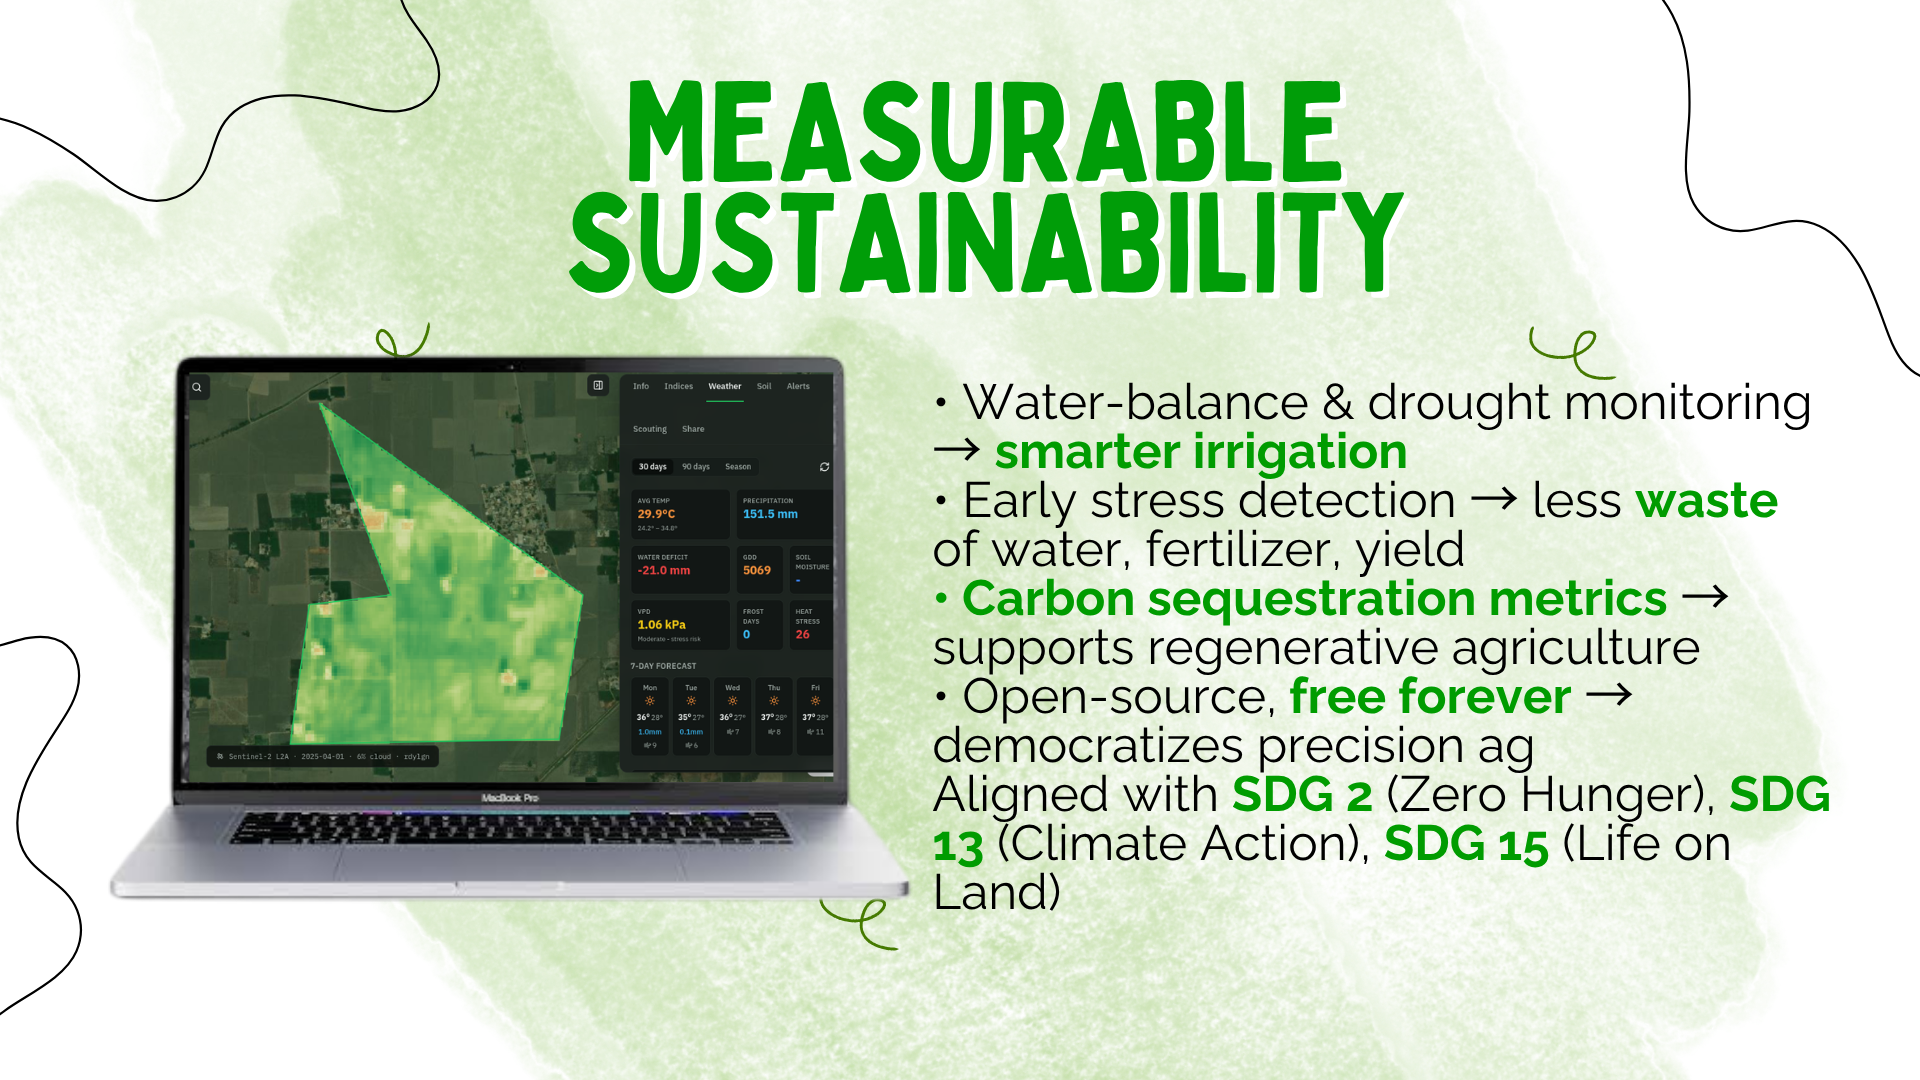
- 🌍 Quantifies sustainability — carbon sequestration potential, water balance, drought index, leaching/compaction/waterlogging risk
No API keys · No vendor lock-in · No per-acre fees · MIT License
🛰️ The Full Feature Dossier
| Capability | How it works | Why it matters |
|---|---|---|
| 🛰️ Satellite Intelligence | 4 indices (NDVI, EVI, SAVI with configurable L, NDWI) at 10 m from Sentinel-2; auto 24-month backfill + weekly compute | Trends appear on day one; anomalies aren't hindsight |
| 🌦️ Weather Intelligence | Daily history + 7-day forecast from Open-Meteo — temp, precip, ET₀, VPD, soil moisture/temp; agronomic derivations: GDD, water balance, drought index | Explains the why, not just the what |
| 🌱 Soil Intelligence | SoilGrids (250 m global) / POLARIS (30 m US) — texture by depth, pH, OC, CEC, bulk density, AWC; 68-crop suitability (Soil 40 · Water 25 · Climate 20 · Stress 15) with limiting-factor explanations; sustainability: carbon sequestration, nutrient risk, sampling zones, soil×weather stress | Transparent models you can defend in a boardroom |
| 🤖 ML Boundary Detection | PyTorch/TorchGeo (Fields of The World) — draw a rough area, review detections with confidence, accept in one click | Eliminates the "magic" boundary-drawing step |
| 🚨 Explained Alerts | Configurable thresholds and drop-percentage rules; every alert enriched with weather + soil drivers | No false panic. No unexplained noise |
| 🗺️ Delivery | MapLibre + PMTiles (no Mapbox token), colormaps, scouting markers with photos; ECharts percentile bands; read-only share links; OAuth → JWT, RBAC, audit logs, EN/ES i18n, themes | Farmers, agronomists, buyers share one truth |
🏛️ The Three Layers
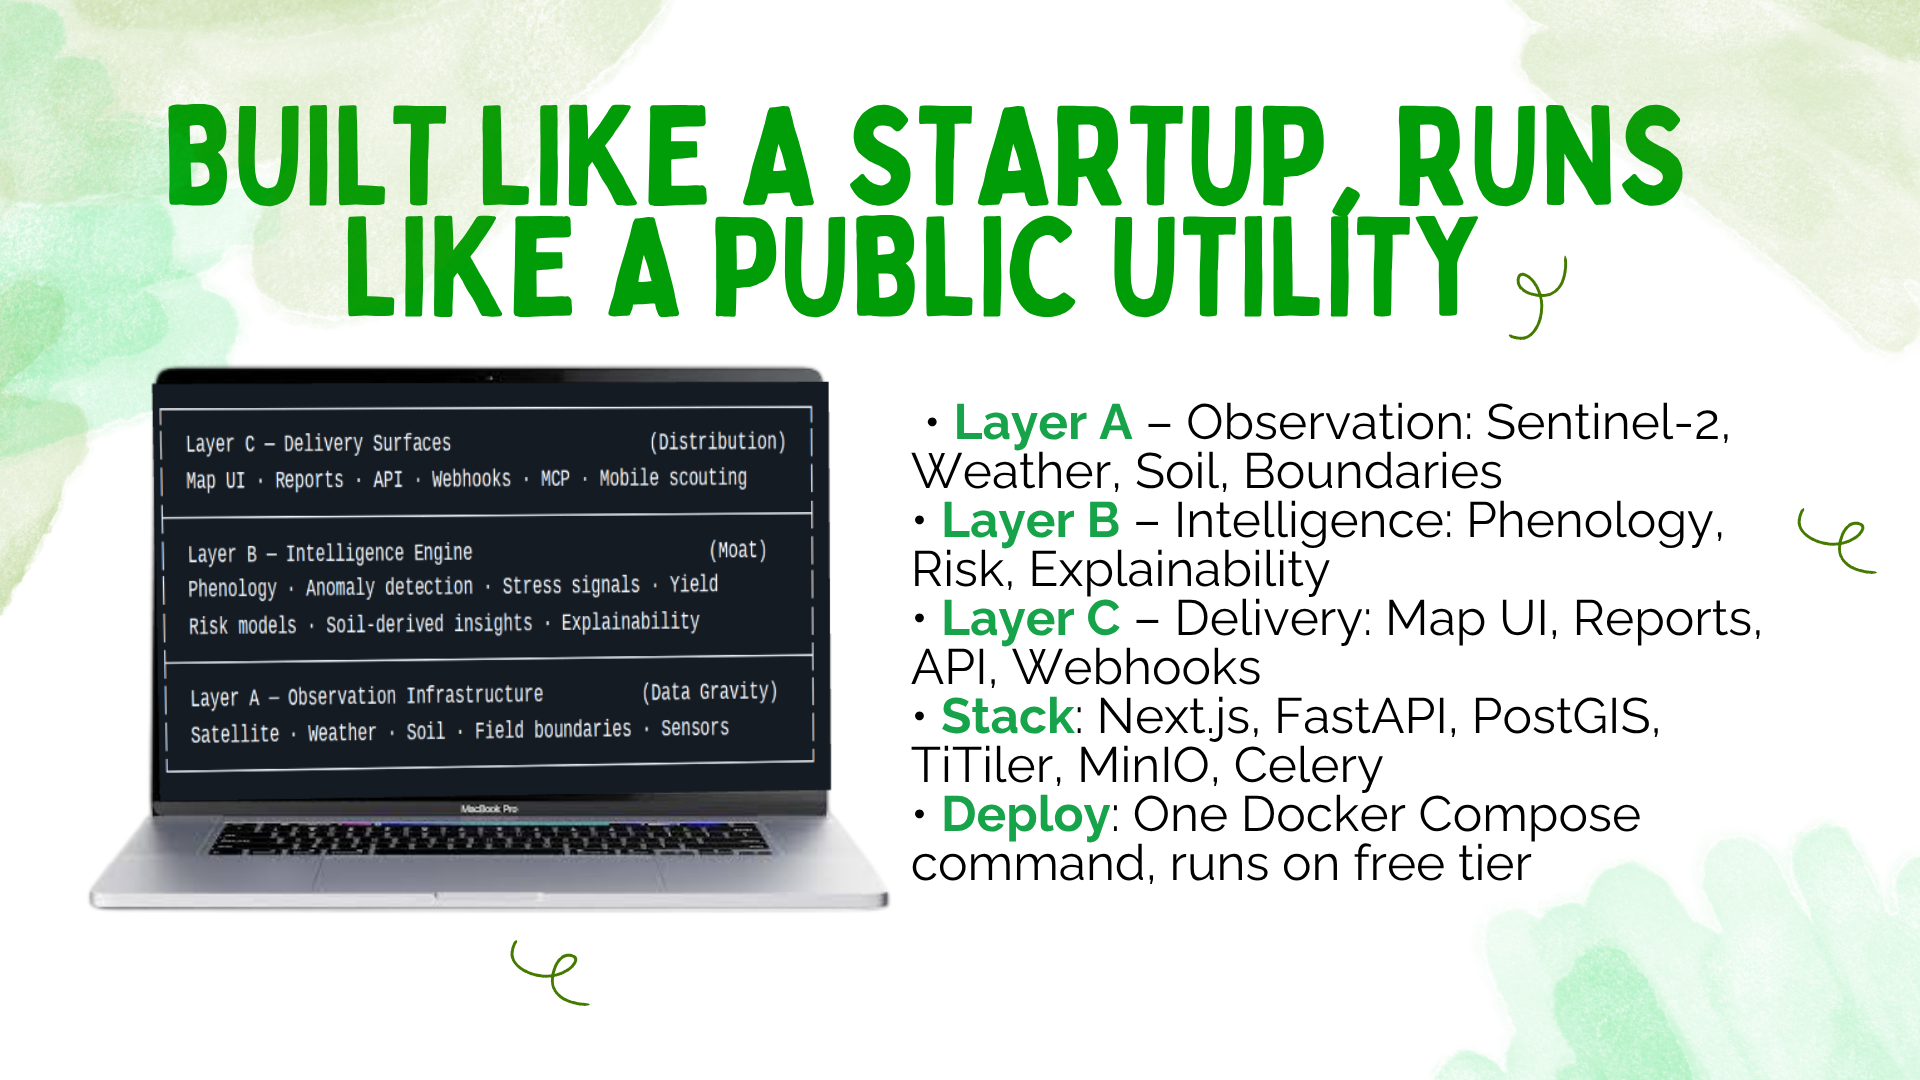
Engineered as a 3-layer system — independently deployable, assembled to last.
┌───────────────────────────────────────────────────────────────┐
│  Layer C — DELIVERY SURFACES                 (Distribution)   │
│  Map UI · Reports · API · Webhooks · MCP · Mobile scouting    │
├───────────────────────────────────────────────────────────────┤
│  Layer B — INTELLIGENCE ENGINE                    (Moat)      │
│  Phenology · Anomaly detection · Stress signals · Yield       │
│  Risk models · Soil-derived insights · Explainability         │
├───────────────────────────────────────────────────────────────┤
│  Layer A — OBSERVATION INFRASTRUCTURE       (Data Gravity)    │
│  Satellite · Weather · Soil · Field boundaries · Sensors      │
└───────────────────────────────────────────────────────────────┘
Each layer is a module you can swap without breaking the others. That's the moat: explainability bounded by architecture, not by prompts.
📸 The Platform, Live
.png) |
.png) |
.png) |
.png) |
⚙️ The Machine Under the Hood
| Stack | Purpose |
|---|---|
apps/web/ |
Next.js 14 · NextAuth (Google OAuth) · Tailwind · shadcn/ui · MapLibre · ECharts |
services/api/ |
FastAPI · SQLAlchemy 2.0 (async) · Alembic · Celery |
services/tiler/ |
TiTiler COG tile server (shared JWT auth) |
infra |
PostgreSQL/PostGIS · Redis · MinIO · Docker Compose · Caddy (auto-SSL) |
ml |
PyTorch · TorchGeo (Fields of The World) |
✔ 7-service Docker Compose — one command; no cloud account; no paid keys. ✔ CI-enforced quality — ESLint + typecheck + build; Ruff + format check. ✔ Audit-logged RBAC — owner/admin/member/viewer with audit events on key actions.
Deep dive: ARCHITECTURE.md · DESIGN.md
📊 The Impact Ledger
Mapped to UN SDGs — measurable, not metaphorical:
| Metric | Mechanism | Outcome |
|---|---|---|
| 🌾 SDG 2 · Zero Hunger | 68-crop suitability + yield risk | Better crop-planning under climate change |
| 🌡️ SDG 13 · Climate Action | Per-field carbon sequestration estimation | Track carbon stocks transparently |
| 🌍 SDG 15 · Life on Land | 24-month stress history + early anomaly alerts | Detect decline in weeks, while restoration is possible |
| 💧 Water stewardship | Water balance, drought index, ET₀, VPD, leaching risk | Allocate irrigation with data |
| ⚖️ Equity | $0/acre, self-hostable, MIT | Satellite-grade intelligence as public infrastructure |
🧗 The Hard Climbs
- 🌐 Cross-source telemetry — STAC, weather, and soil come from different eternities; we normalized both time and geometry before the math runs.
- 🤖 ML that doesn't own the field — boundary detection must suggest, let the user accept, and be honest about confidence. Detection without review is how bad fields get analyzed.
- 📐 Soil scoring at scale — 68 crops demand a weighted model, tuned across texture, pH, AWC, and weather stress — enough structure to be plausible, simple enough to explain.
- 🗺️ Tile economics — PMTiles + TiTiler beat SaaS tile costs by orders of magnitude; the tradeoff was freshness vs. compute, solved by scheduled re-inks.
- 🔐 RBAC without friction — OAuth + JWT + org roles, auditable, with no surprise private endpoints.
📚 What We Learned
We arrived with production web habits and left with geospatial intuition: OG COG/PMTiles, self-hosted tile serving, correct geometry handling in PostGIS, distributed queues with Celery, and how to debug ML regressions honestly. The lesson we won't stop sharing: the explainability boundary is a design choice, and it's the cheapest moat we've seen.
🗺️ The Road Forward
On ROADMAP.md:
- 🌾 Yield estimation & phenology tracking — monitoring → forecasting
- 📱 Mobile scouting app — offline-first observations synced to the map
- 🔌 Webhooks & MCP integrations — field intelligence in the tools farmers already use
- 🤝 Community agronomy models — open, peer-reviewed crop and risk models
🌾 Why AgriPulse Demands Attention
💡 Unmatched Originality
AgriPulse breaks away from the noise of generic sustainability dashboards. It delivers a highly unique solution by fusing open-source precision agriculture directly into deeply explainable, per-field alerts.
🌍 Authentic Earth Stewardship
The platform achieves a total, uncompromising implementation of sustainable farming practices. It provides comprehensive, real-world utility by actively modeling water balances, tracking localized drought threats, measuring soil carbon retention, and running precision scoring analytics for 68 distinct crop varieties.
🚀 Production-Ready Completion
This is not a concept; it is an entirely completed product. The repository ships with a functional live demo, an instant one-command Docker deployment pipeline, strict CI quality control, multi-language internationalization, and professionally formatted, shareable field reports.
📚 Accessible Educational Framework
The project acts as an elite learning blueprint. It utilizes a modern, teachable technical architecture backed by immaculate, step-by-step documentation explicitly curated to mentor developers entering the agricultural tech ecosystem.
🎨 Human-Centric Design Principles
The interface prioritizes premium visual utility. It utilizes a highly structured, token-driven design system paired with the clinical readability of IBM Plex typography and fully compliant accessible color themes.
⚙️ Cutting-Edge Infrastructure
The software architecture relies entirely on modern, cloud-native pipelines. Data flows seamlessly from STAC to COG, TiTiler, PostGIS, and PMTiles, supercharged by PyTorch machine learning, asynchronous Celery task workers, and strict role-based access control security.
🔗 Deploy It Yourself
Prerequisites: Docker 24+ · one free Google OAuth client · two random secrets.
git clone https://github.com/robloxsagax-web/AgriPulse.git
cd AgriPulse
cp .env.example .env
docker compose -f docker-compose.yml -f docker-compose.dev.yml up --build
Then open http://localhost:3000, sign in, draw a field — the 24-month backfill begins. Production deployment (Caddy auto-SSL, Terraform/cloud-init): DEPLOYMENT.md.
🙏 Made on Open Data
Copernicus Sentinel-2 (ESA) · Element84 Earth Search · Open-Meteo · ISRIC SoilGrids · POLARIS · Fields of The World · OpenStreetMap & Protomaps
Built With
- celery
- docker
- fastapi
- minio
- next.js
- open-meteo
- postgis
- postgresql
- pytorch
- react
- redis
- sentinel-2
- solidfire
- sqlalchemy
- tailwind-css
- titiler
- torchgeo
- typescript

Log in or sign up for Devpost to join the conversation.