-
-
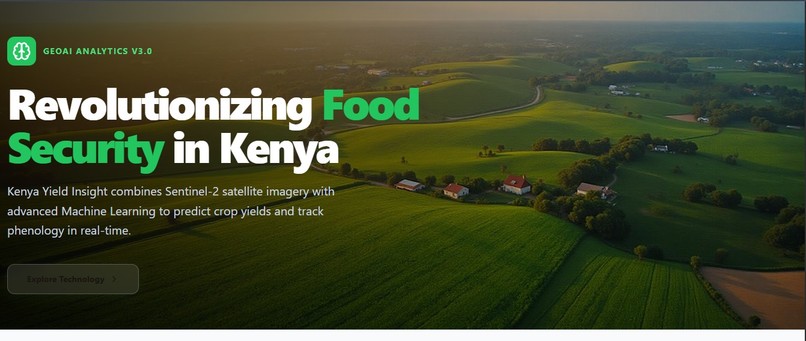
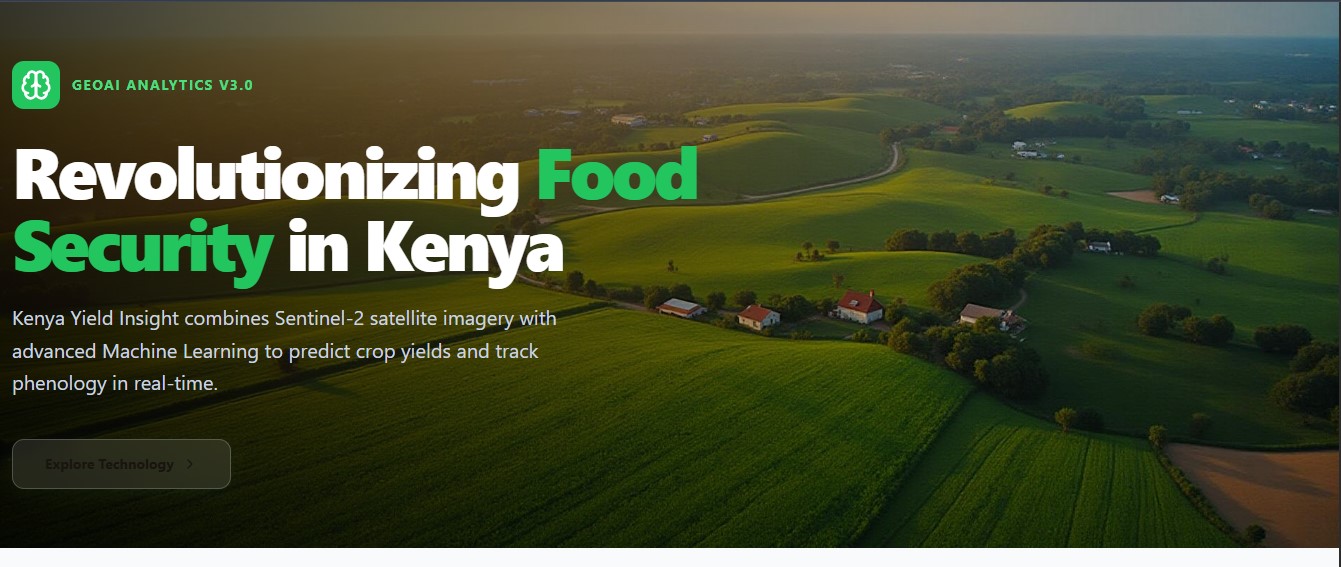
Landing page of the system
-
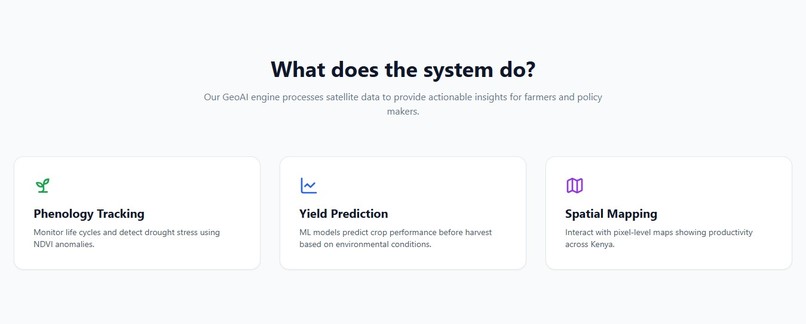
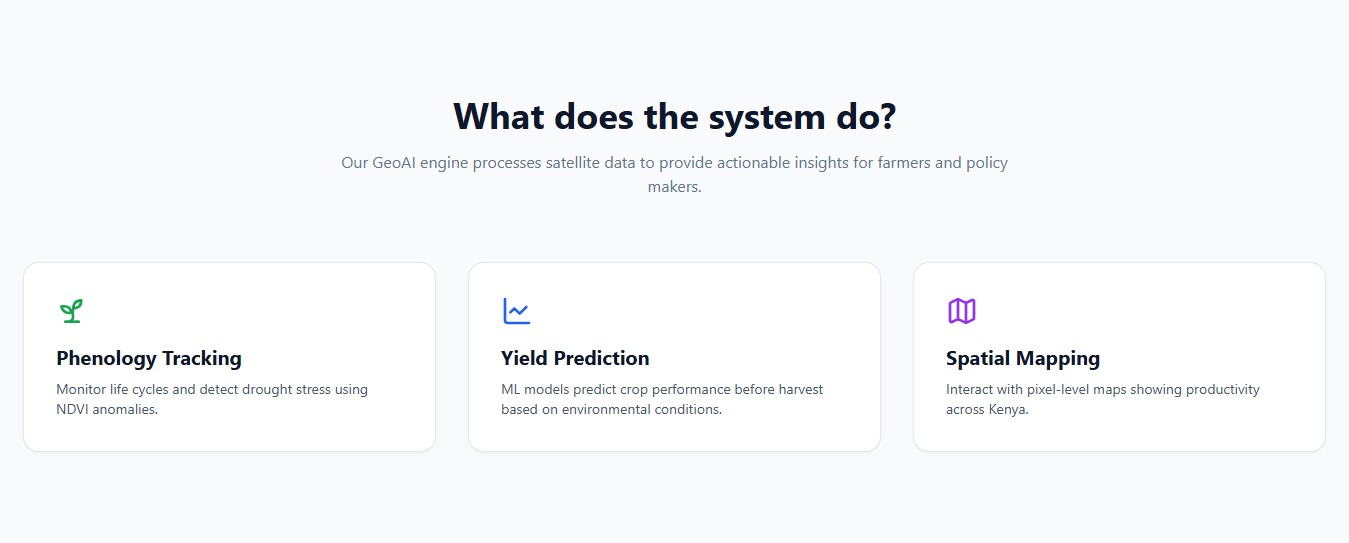
What the system does
-
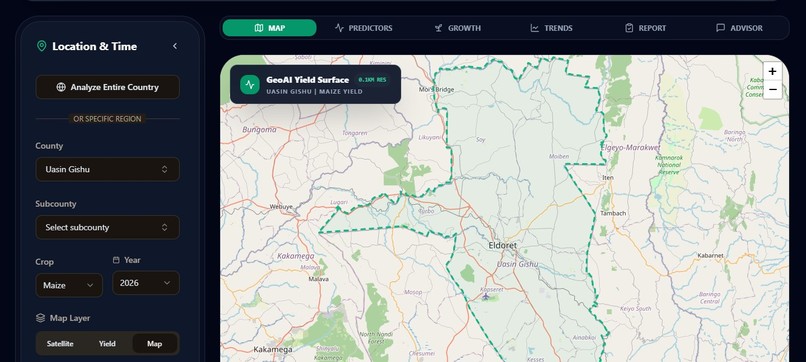
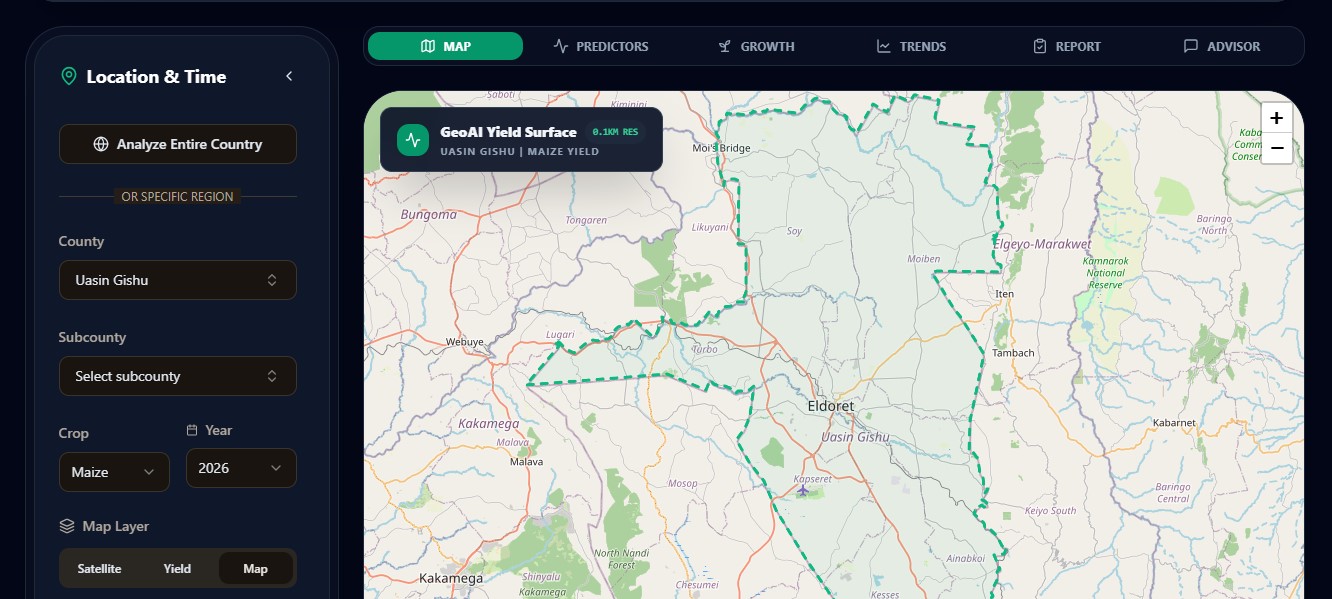
Control page with a default leaflet map centering Uasin Gishu county
-
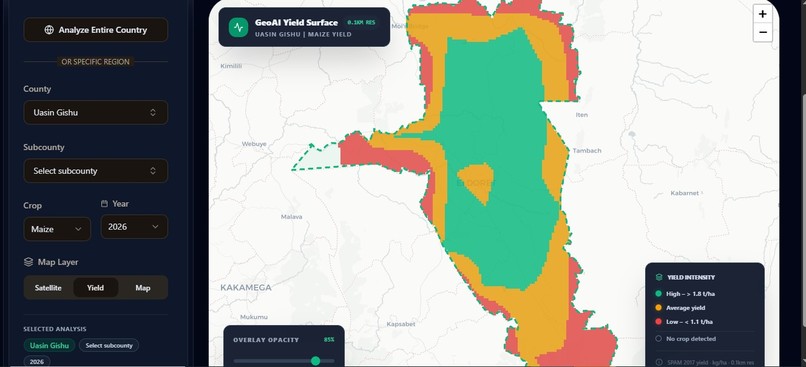
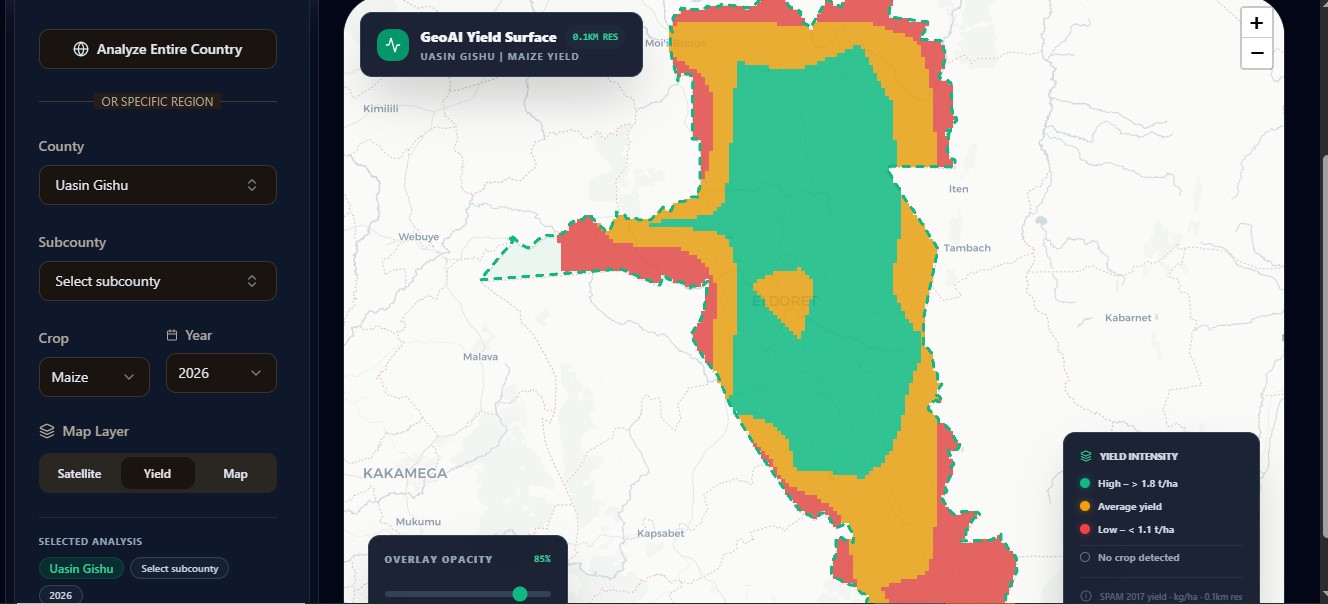
Yield map for Uasin Gishu county
-
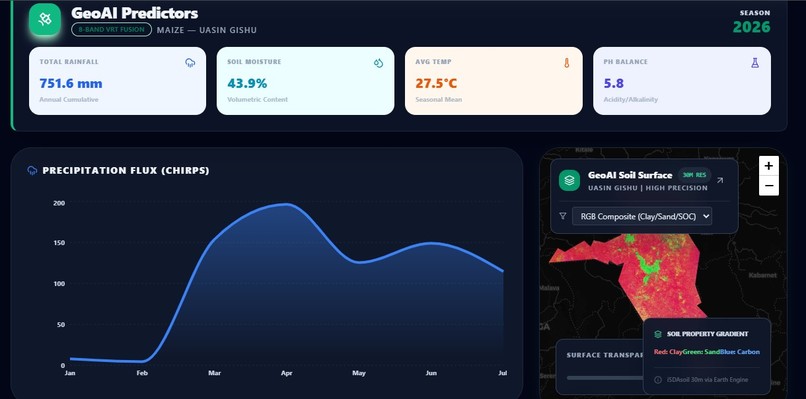
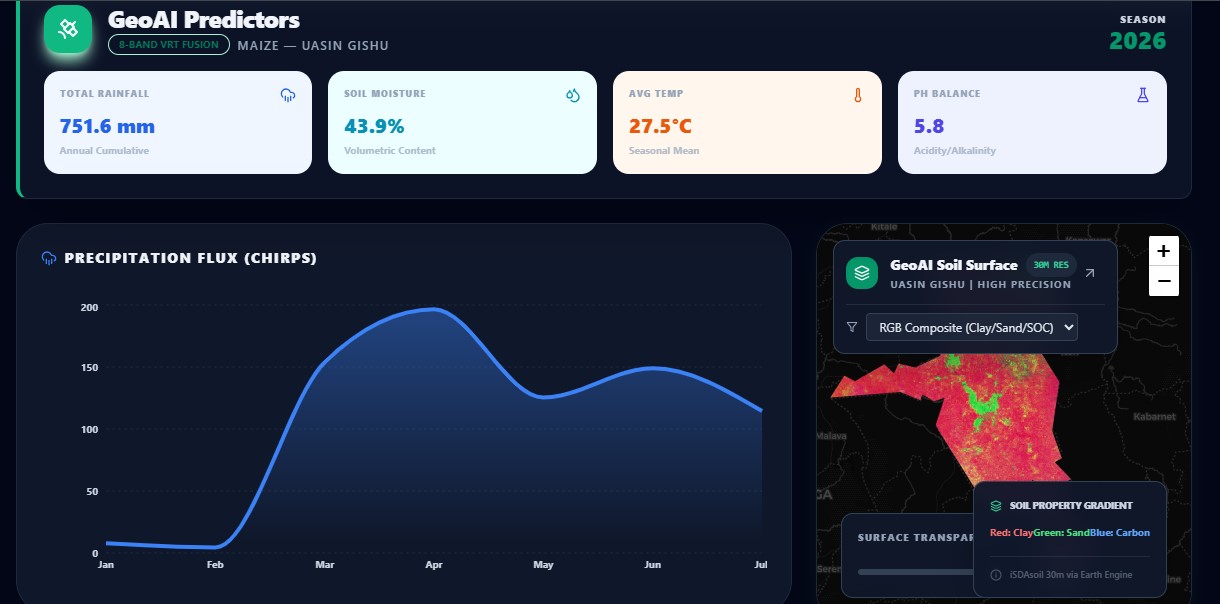
Predictors page for Uasin Gishu county
-
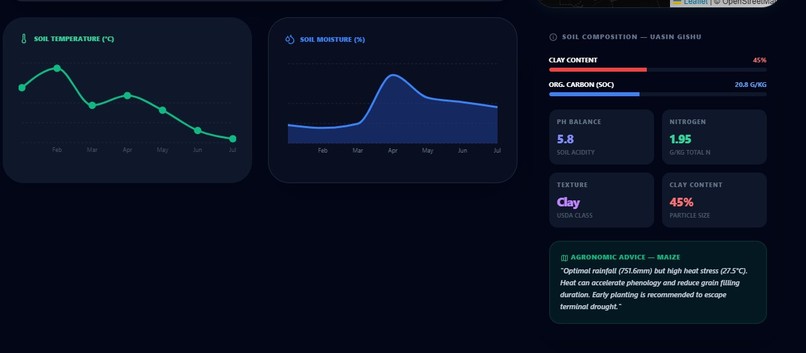
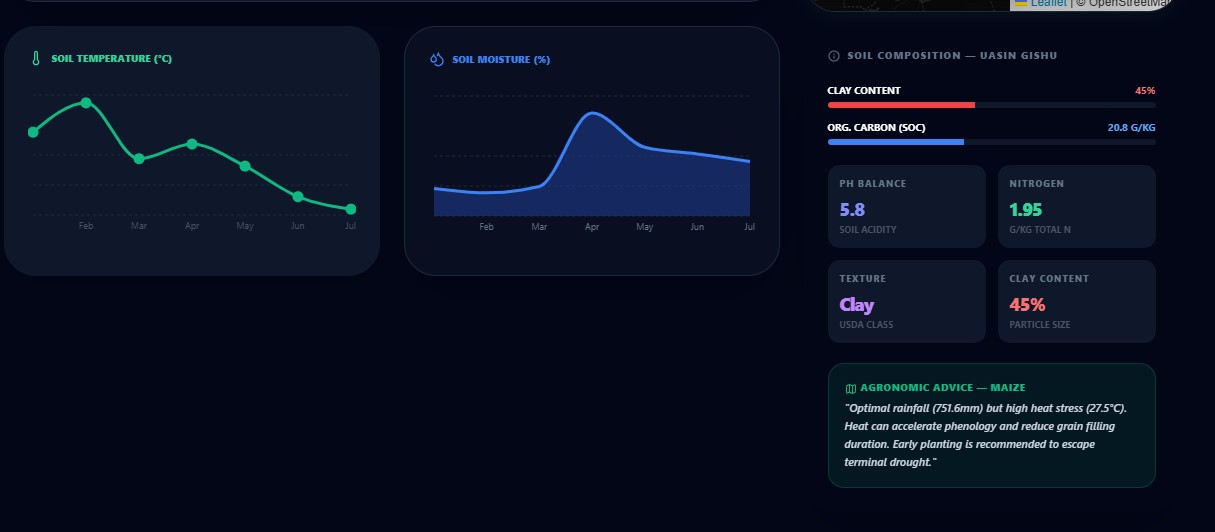
Continuation of predictors page for Uasin Gishu county
-
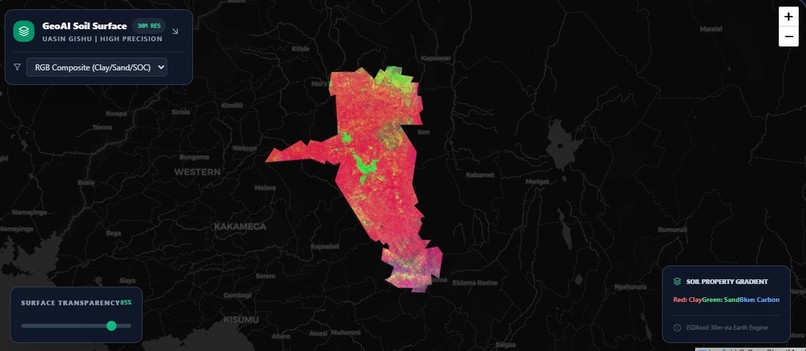
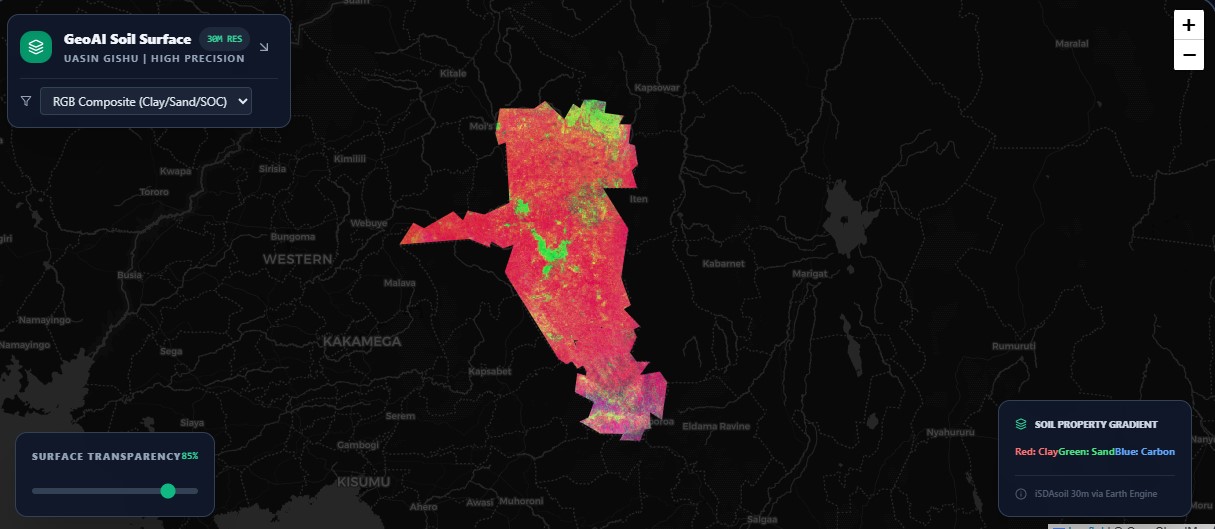
Uasin Gishu county soil map
-
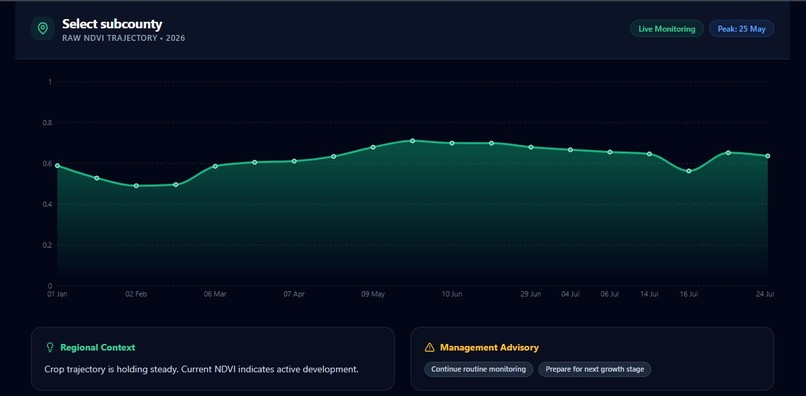
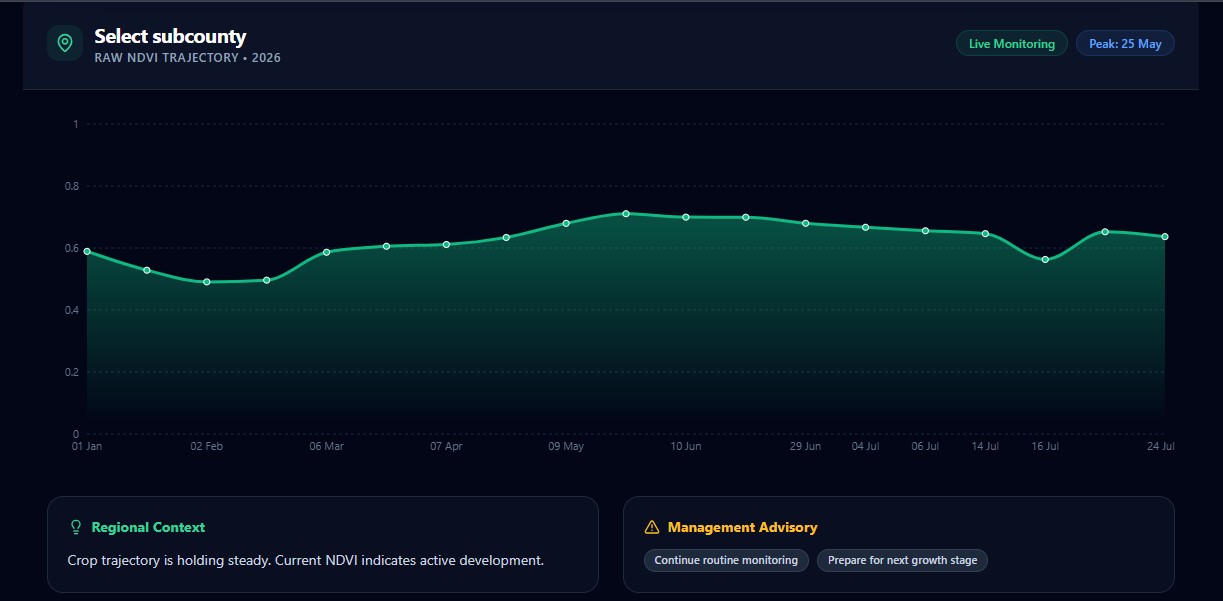
Phenology track for Uasin Gishu county
-
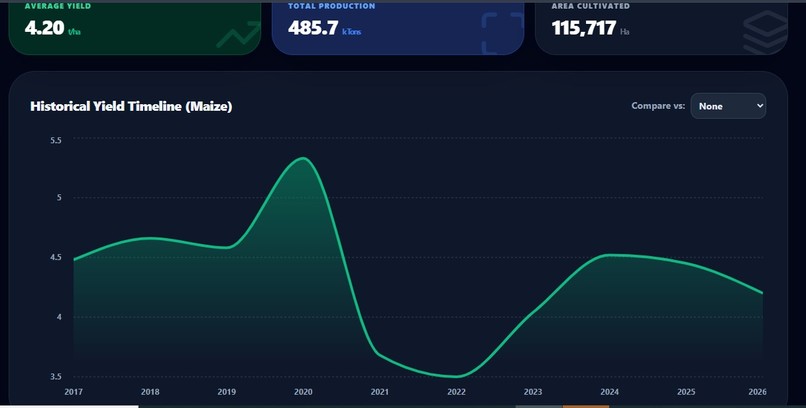
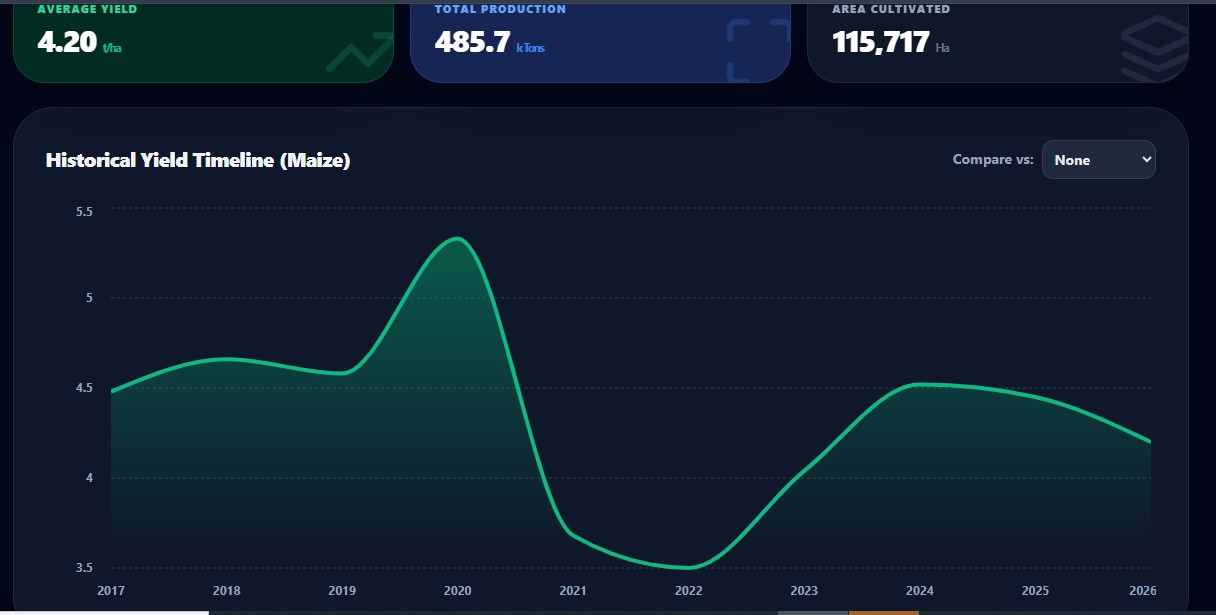
Maize yield trends for Uasin Gishu county
-
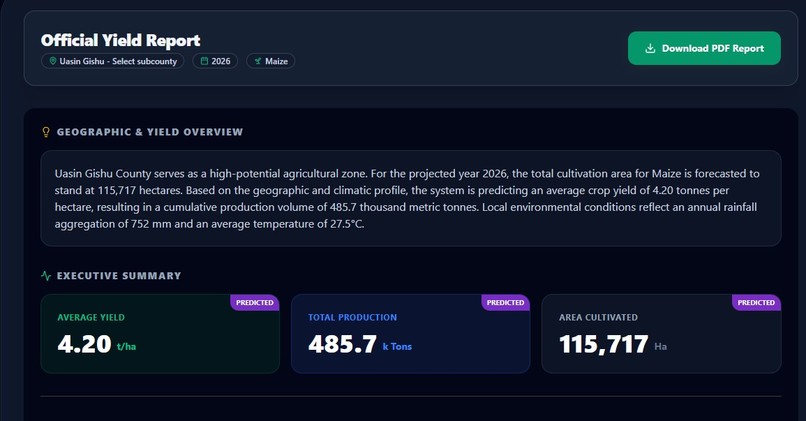
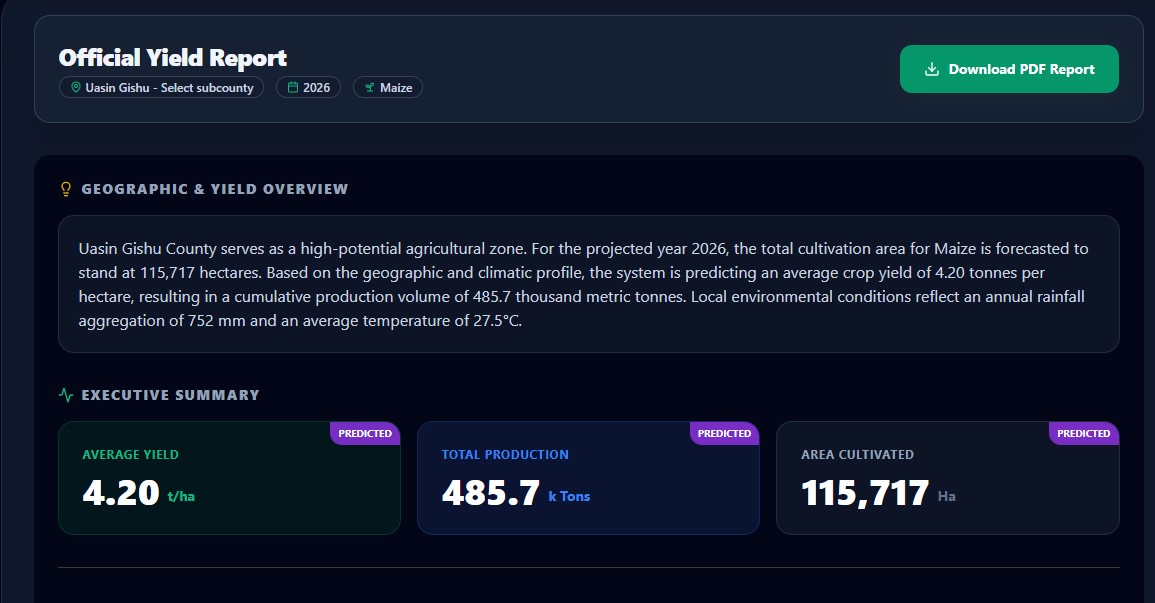
Report generator page
-
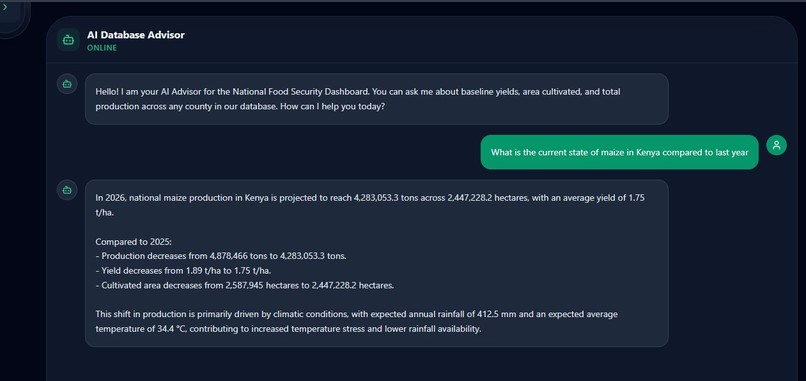
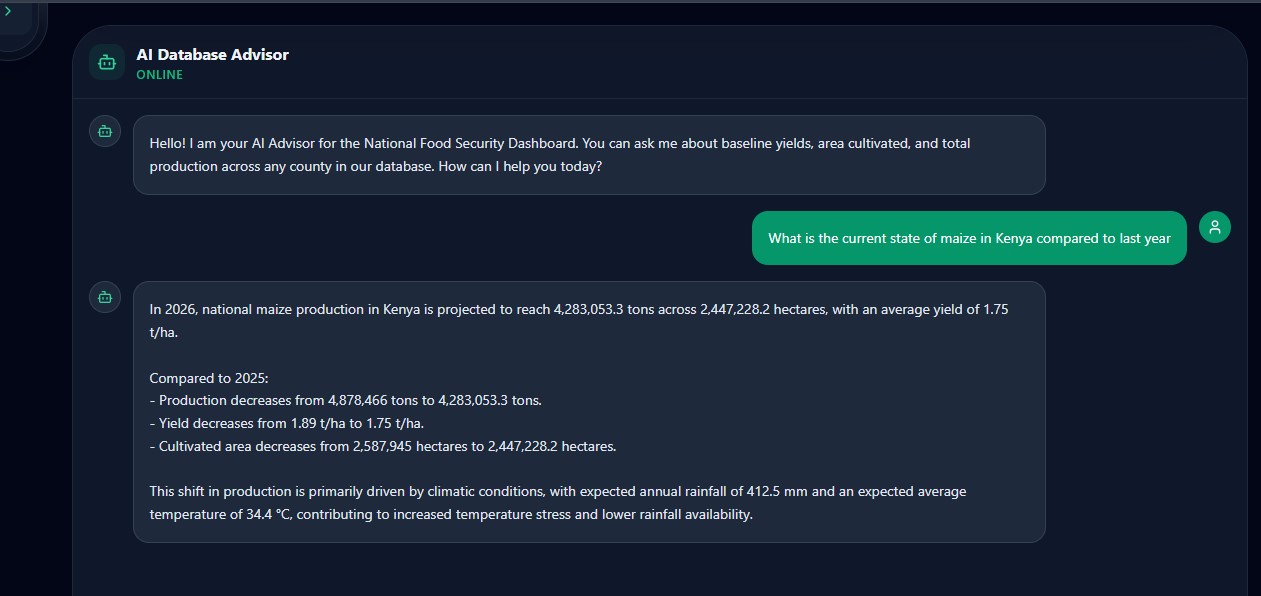
AI advisor page
-
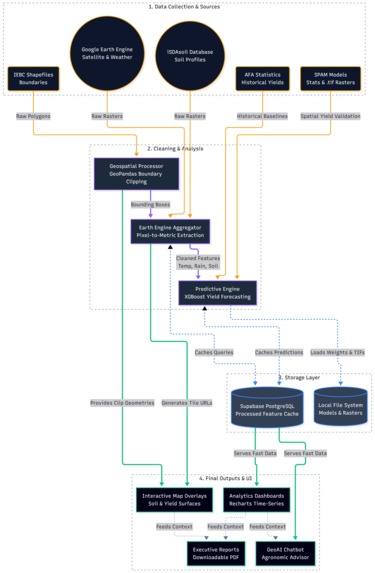
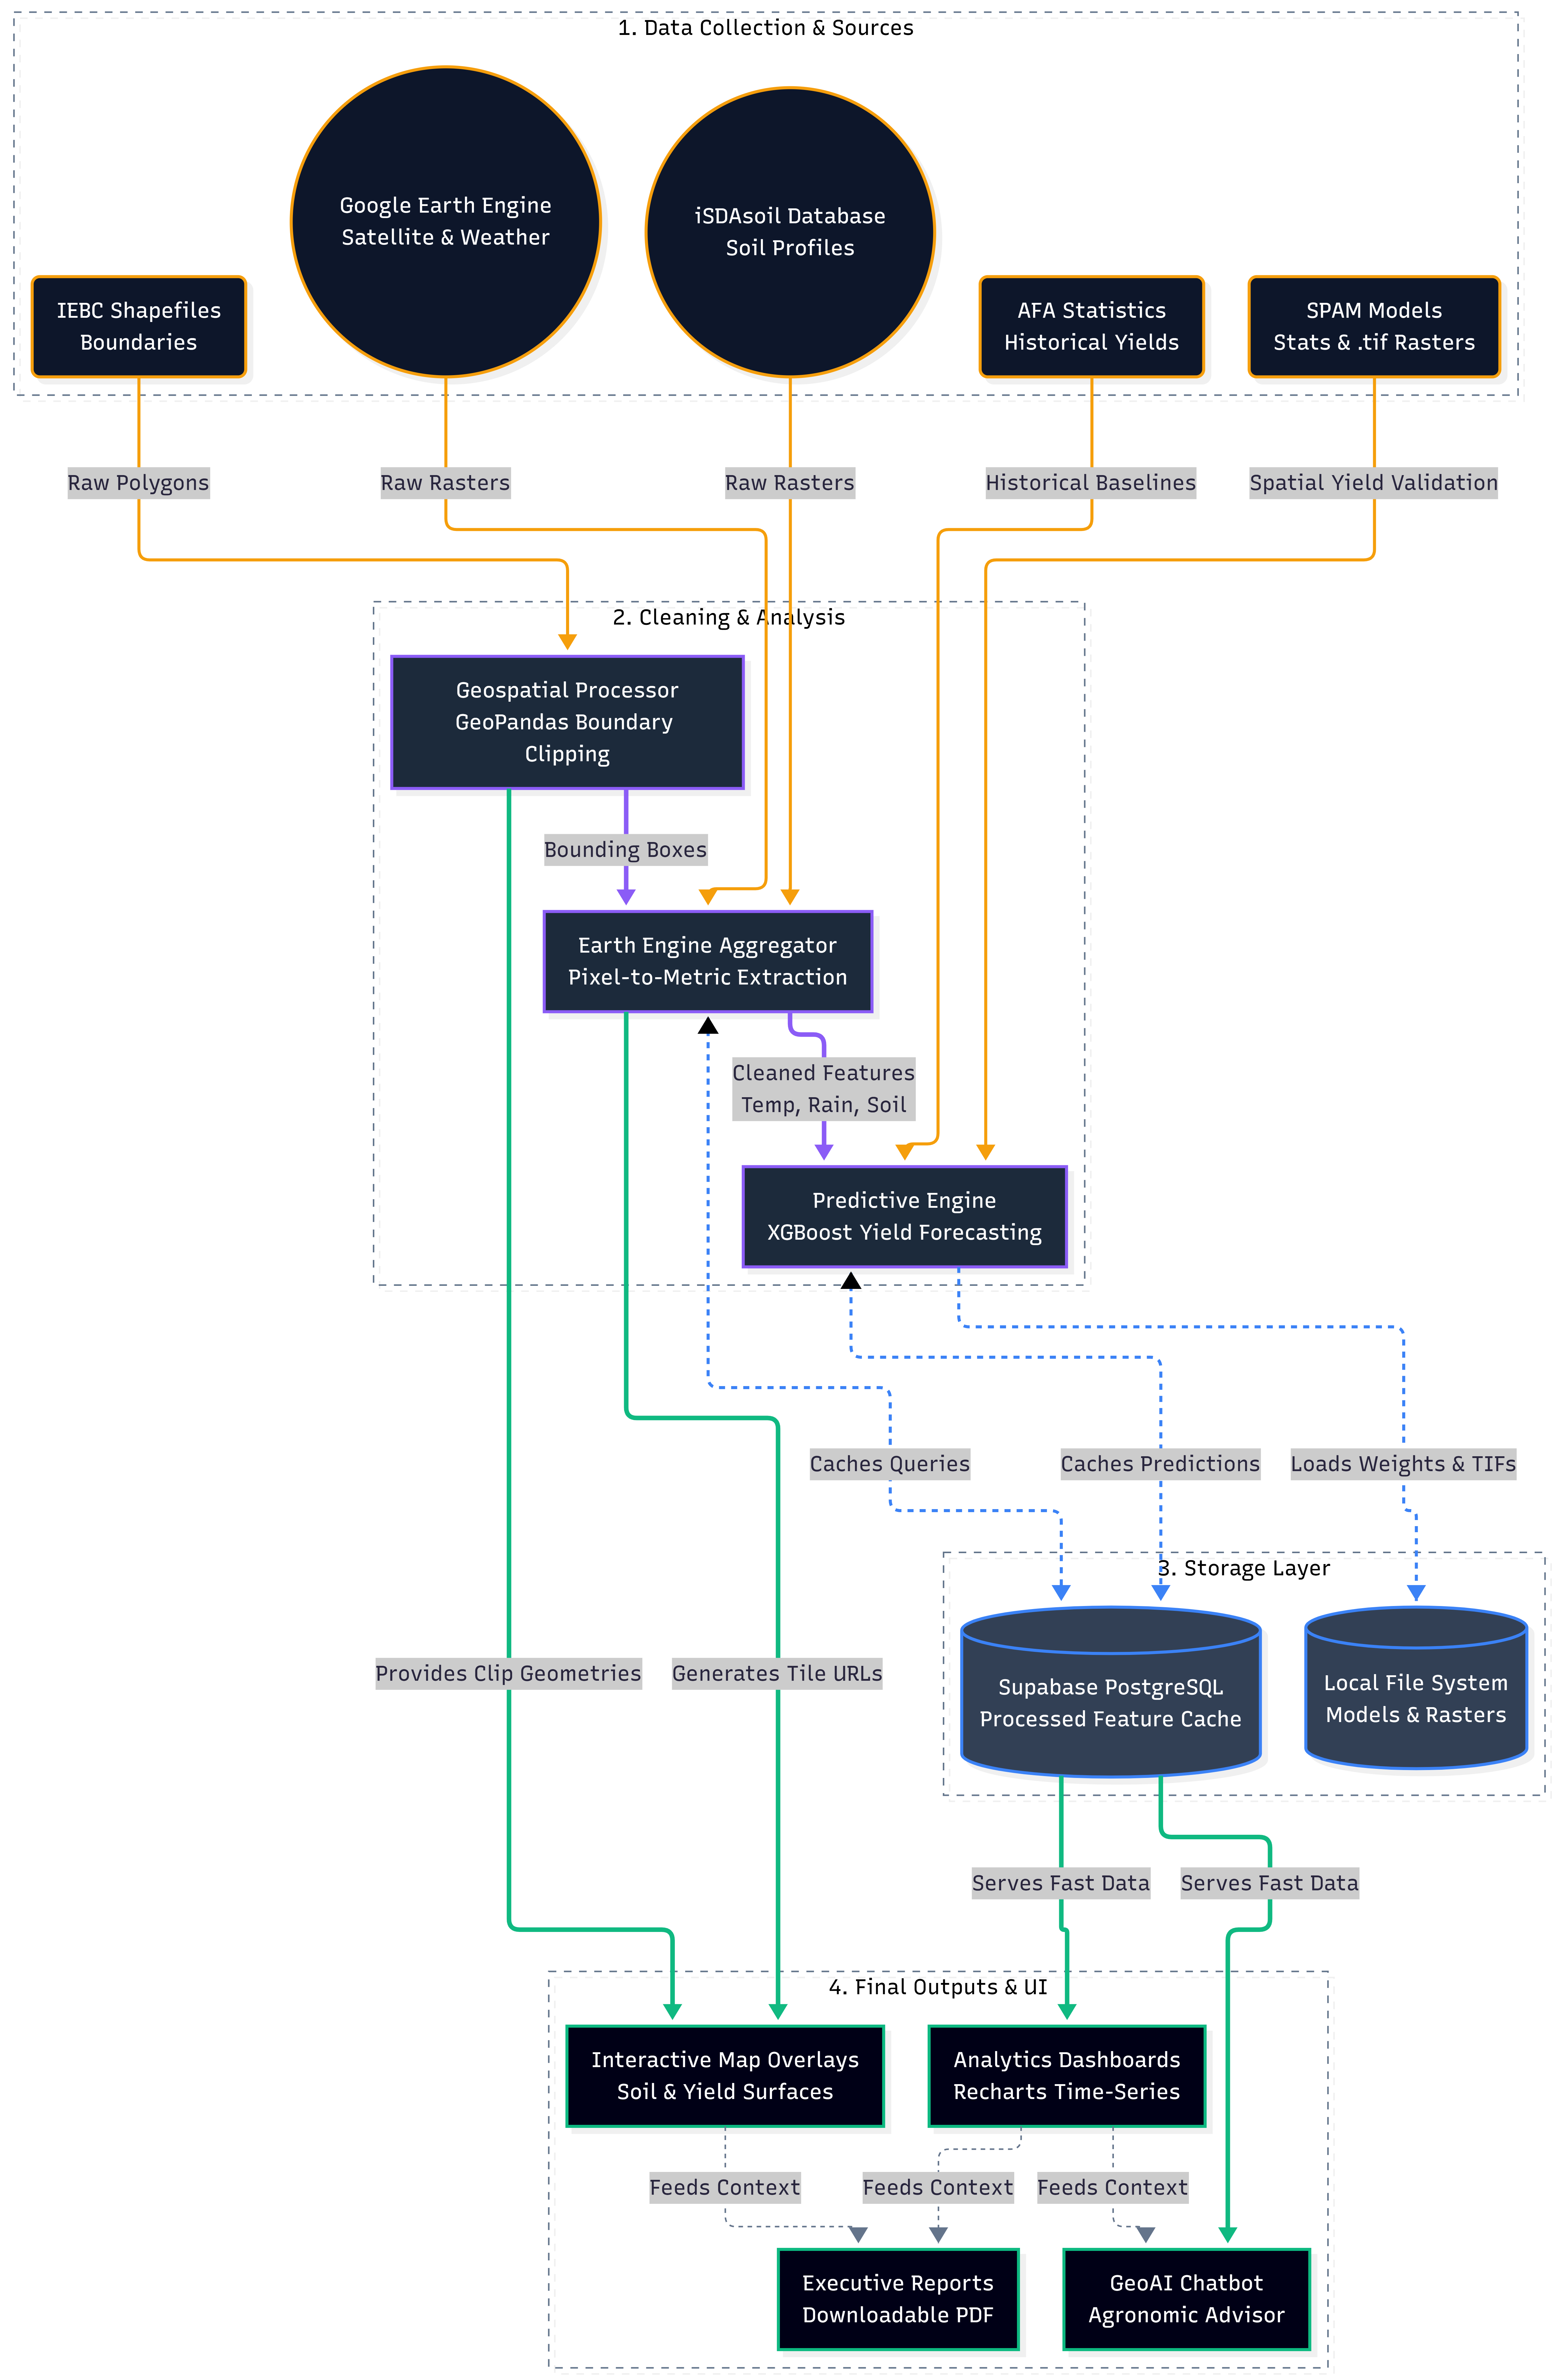
Conceptual model of the system
Inspiration
Climate change has made seasonal weather patterns in East Africa increasingly erratic. In Kenya, where agriculture contributes over 30% of the national GDP and supports millions of smallholder livelihoods, a single failed rain season can trigger a severe food security crisis.
Historically, disaster response has been reactive: food aid is mobilized only after widespread crop failure and malnutrition are documented on the ground. By then, the human and economic costs are already devastating.
I wanted to change this. I was inspired to build a system that could predict crop yields months before harvest, at a high spatial resolution, using real-time satellite observations. AgriWatch KE was born from this vision - shifting food security management from crisis response to anticipatory action by translating real-time satellite climate signals into actionable, county-level crop yield forecasts.
What it does
AgriWatch KE is a geospatial decision-support dashboard designed for agricultural officers, humanitarian planners, and policy makers. It monitors four primary staple crops across all 47 counties of Kenya: Maize, Wheat, Potatoes, and Pigeonpeas.
Key Features:
- Interactive GeoAI Yield Surface: Renders custom 0.1 km high-resolution spatial heatmaps showing exactly where crops are yielding well, average, or poorly.
- Dynamic Alert HUD: Computes county and subcounty-level deviations from historical baseline statistics and triggers an automated warning system:
- GREEN (Normal): Yield is within 10% of baseline.
- ORANGE (Watch): Yield is between 10% and 30% below baseline. Resources should be pre-positioned.
- RED (Alarm): Yield is more than 30% below baseline. Triggers immediate anticipatory action protocols.
- Satellite Predictor Deep-Dives: Visualizes historical and predicted climate datasets including NDVI (Normalized Difference Vegetation Index), LST (Land Surface Temperature), CHIRPS rainfall, and soil moisture.
- Gemini-Powered Q&A Chatbot: An embedded LLM conversational interface that answers complex, multi-county food security queries using the underlying dashboard analytics.
How we built it
As a solo developer, I built the entire system end-to-end, from the machine learning models and data pipelines to the interactive map interface:
1. The Core AI Prediction Engine
I trained an XGBoost Regressor on five years of county-level crop production stats provided by the Agriculture and Food Authority (AFA) of Kenya, combined with historical climate features.
For any selected county and crop, the predicted yield \(\hat{y}\) is modeled as the sum of predictions from \(K\) sequential regression trees:
$$ \hat{y} = \sum_{k=1}^{K} f_k(X) $$
Where the feature vector \(X\) contains monthly aggregated satellite observations:
- NDVI (MODIS MOD13Q1): Vegetation vigor index.
- Land Surface Temperature (MODIS MOD11A2): Thermal stress indicator.
- Rainfall (CHIRPS Daily): Accumulated precipitation.
- Soil Moisture (TerraClimate): Crop-available water content.
2. Crop Presence Masking & Early Warning Calculations
To ensure mapping accuracy, I calculate the crop yield deviation \(\Delta Y\) relative to the historical baseline yield \(Y_{base}\):
$$ \Delta Y = \left( \frac{Y_{pred} - Y_{base}}{Y_{base}} \right) \times 100\% $$
To prevent drawing yield predictions in areas where a crop is not actually cultivated (such as deserts or urban centers), I apply a high-performance rasterized harvested-area mask on the server. If the local harvested area \(H\) is below a strict threshold:
$$ H < 0.1 \text{ hectares} \implies \text{Yield} = 0.0 $$
This filters out spatial resampling noise and isolates crop data to actual agricultural zones.
3. The Tech Stack
- Backend: FastAPI (Python) handles geospatial clipping, raster operations using
RasterioandGeoPandas, and prediction caching. - Frontend: React, TypeScript, Vite, TailwindCSS, and Leaflet.js for custom GeoTIFF rendering.
- Data Pipelines: Google Earth Engine (GEE) Python API for real-time remote sensing extraction.
- Conversational AI: Gemini 2.5 Flash API for context-aware Q&A.
Challenges we ran into
Building a full-scale GIS and AI application alone came with significant technical challenges:
1. The National Merge Challenge
My local soil properties dataset consists of massive, high-resolution (30m) multi-band GeoTIFF rasters. When trying to merge and crop these files at a national level (spanning the entire country of Kenya), the raster merge array attempted to allocate 33.2 GiB of RAM, causing immediate Out-Of-Memory (OOM) backend crashes.
- Solution: I optimized
map_service.pyto inspect the bounds request. If a user views the entire country, the backend automatically performs a downsampled merge at 1 km resolution (res=(1000.0, 1000.0)). For county or subcounty closeups, it keeps the native, ultra-detailed 30m resolution. This solved the OOM issue and reduced national load times from infinity to under 30 seconds.
2. Desert Pixel Noise
In large, arid counties like Marsabit, Mandera and others bilinear interpolation during raster resampling created tiny decimal artifacts (e.g. 0.05 kg/ha yield) in desert zones. The mapping component colored these tiny values red, generating massive, inaccurate low-yield warning blobs over non-agricultural land.
- Solution: I modified the backend processing pipeline to execute a post-resampling yield filter. Any pixel with a yield value below 50 kg/ha (or 200 kg/ha for Potatoes) is dynamically zeroed out. This eliminated over 5.4 million noise pixels nationally and resulted in incredibly clean, highland-isolated crop maps.
3. Leaflet Memory Leaks and Bundler Minification
During testing, switching crops caused the map to lock up or display multiple overlapping crop layers. Leaflet layers were escaping React's state management because class names (like GeoRasterLayer) were minified by Vite into single-letter characters in production.
- Solution: I attached a custom, minification-safe property (
gl.isGeoAIYieldLayer = true) to the Leaflet layers, and wrote an imperative sweeper that sweeps the Leaflet map and purges matching layers before every state change.
Accomplishments that we're proud of
- End-to-End Solo Build: I am incredibly proud of having designed, built, optimized, and deployed the entire stack—from the machine learning models and GEE satellite data aggregation pipelines to the full React frontend—by myself.
- Low-Latency Geospatial Pipeline: I successfully optimized heavy geospatial
.tifprocessing, clipping, and resampling operations on the fly, allowing them to serve in under 1 second on a standard free-tier cloud container. - High-Precision Filtering: Overcoming the spatial noise problem in arid zones to produce clean, professional-grade agricultural maps that represent true cultivation fields.
What we learned
- Geospatial Optimization: I learned how to handle heavy GeoTIFF reading, masking, and warping in memory without overloading free-tier cloud containers.
- The Value of Ground Truth: Satellite indices are powerful, but aligning them with official AFA and county-level harvested statistics is what turns raw numbers into realistic crop forecasts.
- Leaflet & Canvas Control: I gained deep experience in imperatively cleaning up non-react DOM layers (like Canvas elements in Leaflet) to prevent memory leaks and overlapping render states in complex React single-page applications.
What's next for AgriWatch KE
- Cross-Validation with ICPAC: Integrating the platform directly with ICPAC's regional Drought Watch alerts.
- HUSIKA SMS Warnings: Linking the warning engine to automated SMS systems to broadcast crop warnings and climate advisory bulletins directly to smallholder farmers.
- Mobile Field App: A lightweight companion app for county extension officers to submit geo-tagged crop photos to continuous retrain and validate the XGBoost model.
Built With
- antigulatory-action
- climate-change
- fastapi
- food-security-data
- geopandas
- gis
- google-earth-engine
- google-gemini-api
- leaflet.js
- machine-learning
- mapbox
- postgresql
- python
- rasterio
- react
- remote-sensing
- tailwindcss
- typescript
- vite
- xgboost


Log in or sign up for Devpost to join the conversation.