Inspiration
The ongoing pandemic has negatively affected small and medium-sized businesses, something we witnessed personally in the form of the temporary closure of the farmers' market in central Cambridge. During this time, supermarket chains like Sainsburys and Tesco have been able to keep their heads above water by shifting their operations online, thanks to their established customer base and their ability to source things at scale. However, smaller businesses do not have the wherewithal to acquire and retain customers easily, especially during a pandemic. We thus felt a need to empower and support a small subset of SMEs, namely the agricultural industry.
What it does
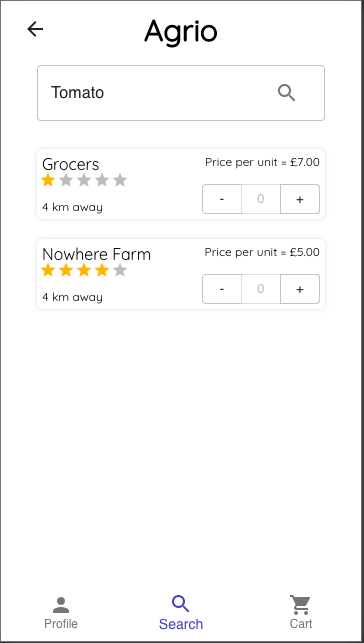
Through Agrio, we aim to connect people with local farmers giving the former more competitive prices and helping the latter by doing away with commission-hungry middlemen.
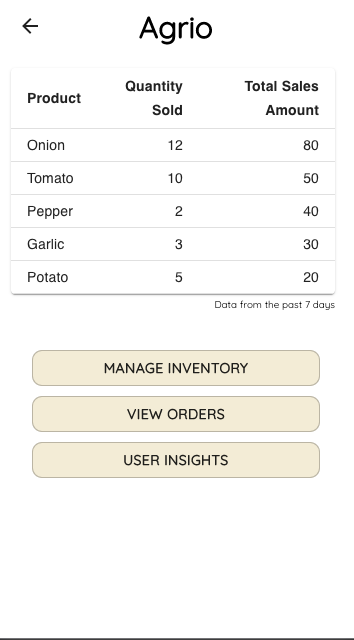
It also provides intuitive dashboards for Farmers to visualize complex data. We display demand for their products based on location as a heatmap, soil data over time, and potential for other products to grow.
How we built it
The main front-end application was created using the React-Redux framework. This was interfaced with a database of user purchases and farmer inventory built on Heroku. Lastly, live visualisation tools like the density maps and charts were created using Python, Matplotlib, and Sci-kit Learn.
Challenges we ran into
- Building a multi-page application with very basic knowledge of React
- Deploying applications at scale on a server
- Figuring out how to make the visualisations for the farmers intuitive
Accomplishments that we're proud of
- Being able to construct a working prototype within 24 hours
- Creating aesthetically pleasing visualizations for the sellers' section of the app
What we learned
- Incorporating geolocation data into data-science pipelines
- Building a multi-page app with react
- Hosting on a database on Heroku
What's next for AgriConnect
- Scaling up to more users.
- Optimize routes (in a similar manner to Uber) finding optimal travel routes for produce deliveries and matching producers to consumers in a manner which optimizes travel times.
- Incorporating more data sources for visualization:
- For example, crop yield data
- Weather forecasts and impacts on different crops
- Projected consumer trends
- Using reinforcement learning to recommend crops farmers should sell and grow depending on user demand as well as competitive insights about other farmers in the industry.
Built With
- django
- heroku
- javascript
- post.gis
- postgresql
- python
- react
- sklearn


Log in or sign up for Devpost to join the conversation.