Inspiration
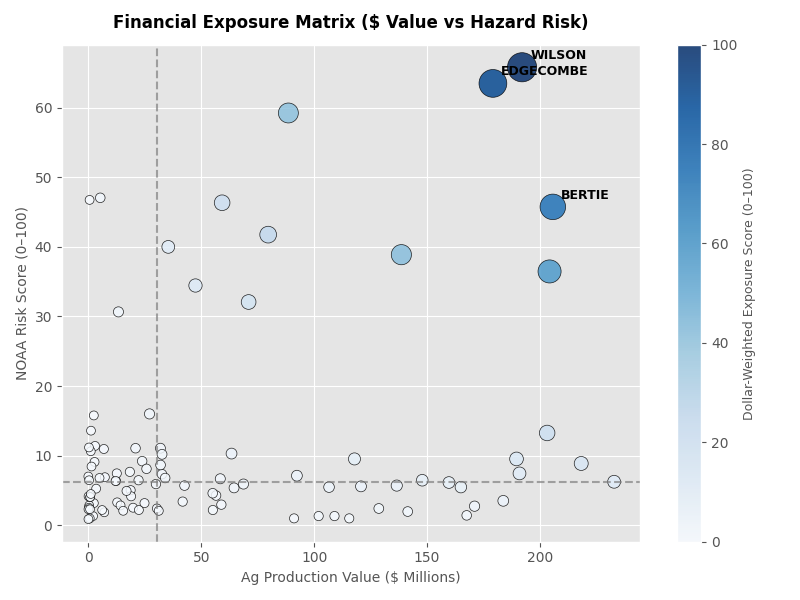
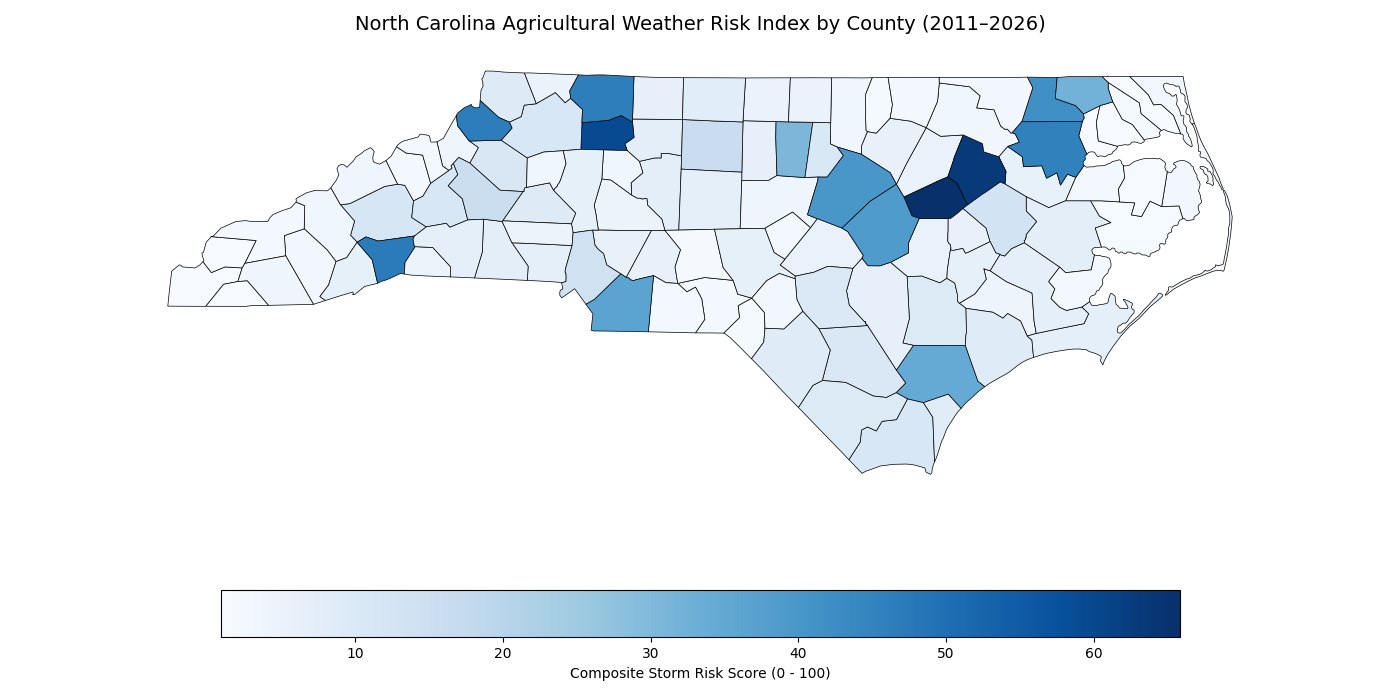
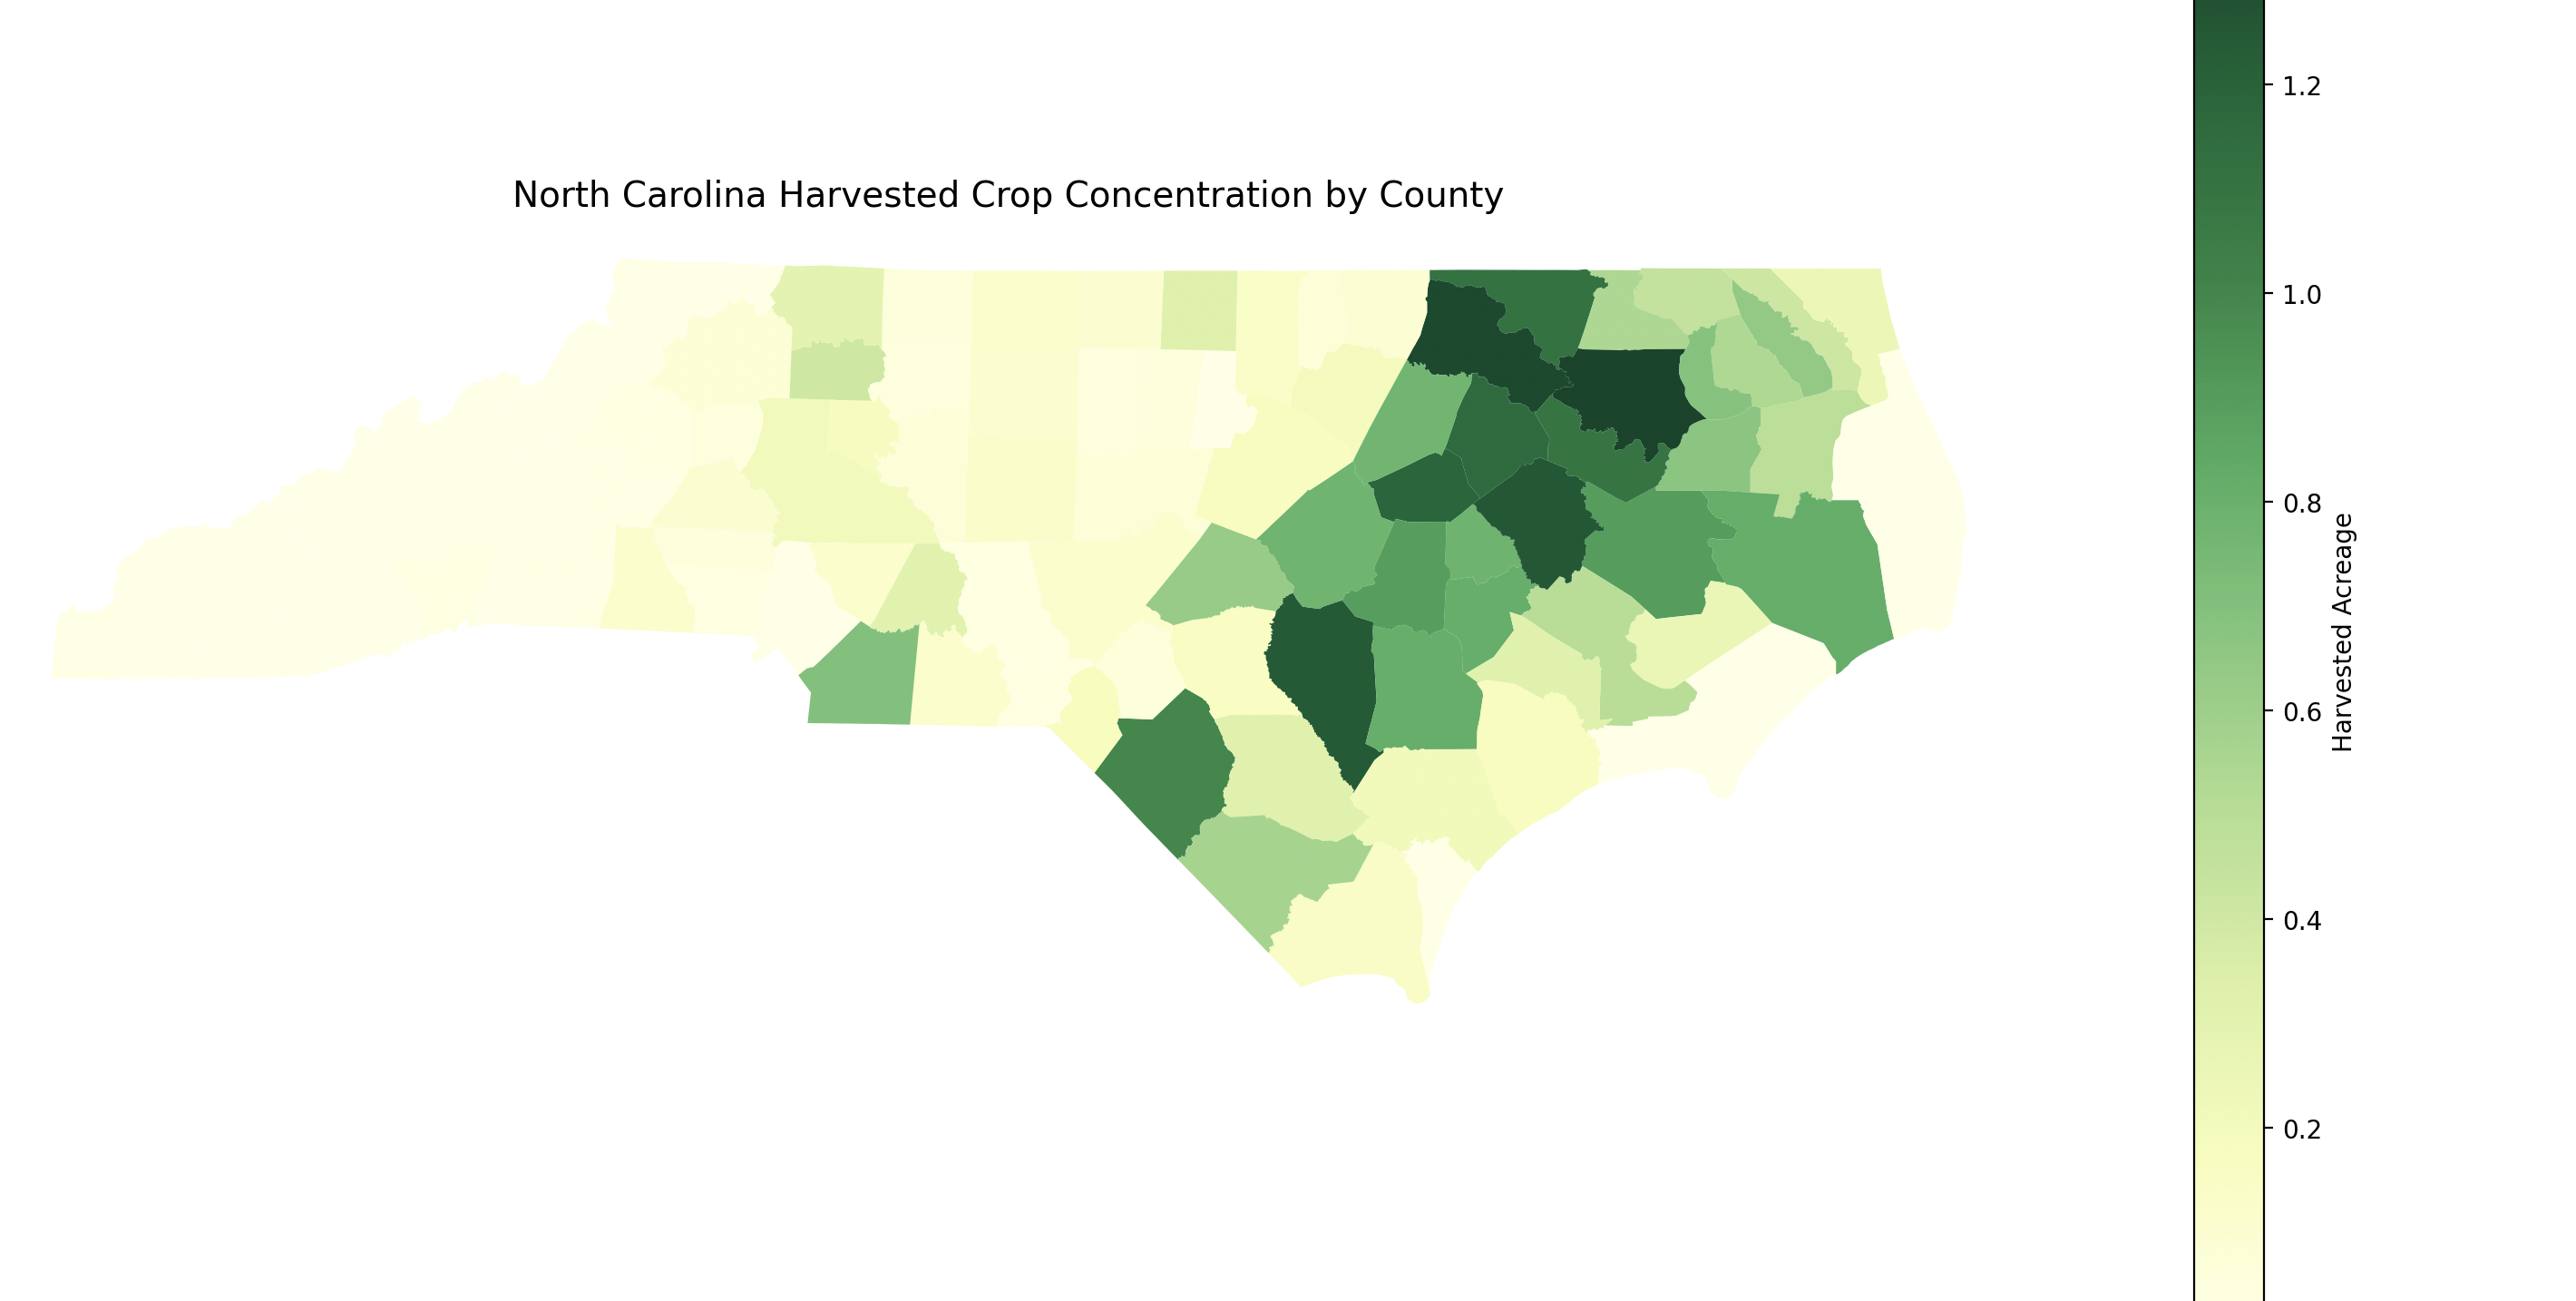
Agriculture drives over $80 billion in North Carolina’s economy, forming the backbone of rural livelihoods and regional food security. However, through our analysis of USDA production data and 15 years of NOAA disaster records, we uncovered a dangerous structural flaw: North Carolina’s highest-value agricultural counties are geographically concentrated directly in severe hurricane and hazard corridors.
Currently, public policy and government intervention are entirely reactive—waiting for catastrophic weather to destroy crops, drain emergency public budgets, and bankrupt family farms before sending disaster aid months later. We were inspired to build a solution that shifts agricultural policy from reactive post-disaster payouts to proactive, data-driven climate resiliency.
What it does
AgriShield AI is an algorithmic Decision Support System (DSS) designed for public-sector decision-makers, state departments of agriculture, and university extension services. It serves as a regional economic stress-tester that combines NOAA severe weather vectors and USDA agricultural output ($) to compute dollar-weighted Exposure Indexes (0–100) across counties.Ingests dynamic climate shocks (such as flash droughts or unseasonal freeze events) to simulate real-time regional Ag-GDP loss and vulnerability shifts. It runs constrained optimization models to calculate the most effective distribution of state climate-adaptation grants and recommend risk-mitigating crop rotation shifts to safeguard rural tax bases before storms strike.
How we built it
To built the model, we Processed USDA NASS agricultural statistics and NOAA severe storm database records (2011–2026) using Pandas and NumPy. We built custom risk-normalization algorithms and matrix operations to generate risk exposure frameworks and dollar-weighted vulnerability models. We implemented mathematical allocation logic (using NumPy matrix operations and proportional risk weighting) to predict effective crop strategy. Finally, we rendered an interactive dashboard using Matplotlib to give farmers clean, actionable visualization of county and crop risk scores versus recommended crop distributions.
Challenges we ran into
Normalizing raw weather frequency alongside high-dollar crop output required careful weighting as we had to ensure extreme, low-frequency events didn't drown out the continuous economic baseline of high-value specialty crops like tobacco and sweet potatoes.
Accomplishments that we're proud of
Successufly creating a risk model to identify the ineffective concentration of agriculture across North Carolina's high risk counties, and creating a model to predict effective crop strategy.
What we learned
Crop strategy and effectivness has a hug e impact on North Carolina's overall economic value, and it is improtant to ensure tracking of mutliple diffrent environmental factors to ensure that strategy.
What's next for AgriAI
: Integrating satellite vegetation health data (NDVI) and USGS real-time groundwater monitoring to enable mid-season, in-field risk recalibration.

Log in or sign up for Devpost to join the conversation.